
Briefly:In our opinion speculative long positions in gold, silver and mining stocks are justified from the risk/reward perspective.
Silver declined massively yesterday. Gold and mining stocks declined as well, but it was the slide in silver that caught the eyes of most traders – and rightfully so. The white metal not only broke the $17 level but also closed below it. Is the final washout in the precious metals sector over (given silver’s tendency to underperform in the final parts of a decline) or only underway?
In our opinion, the above did indeed indicate higher prices in the coming days, but the strength of the signal (here: silver’s underperformance) was not big enough to tell us that the final bottom was in.
Before we analyze silver, let’s take a look at the USD Index (charts courtesy of http://stockcharts.com). This time we will also start with the long-term chart, however, we will provide it in a different way – we will use weekly candlesticks instead of our regular monthly perspective.
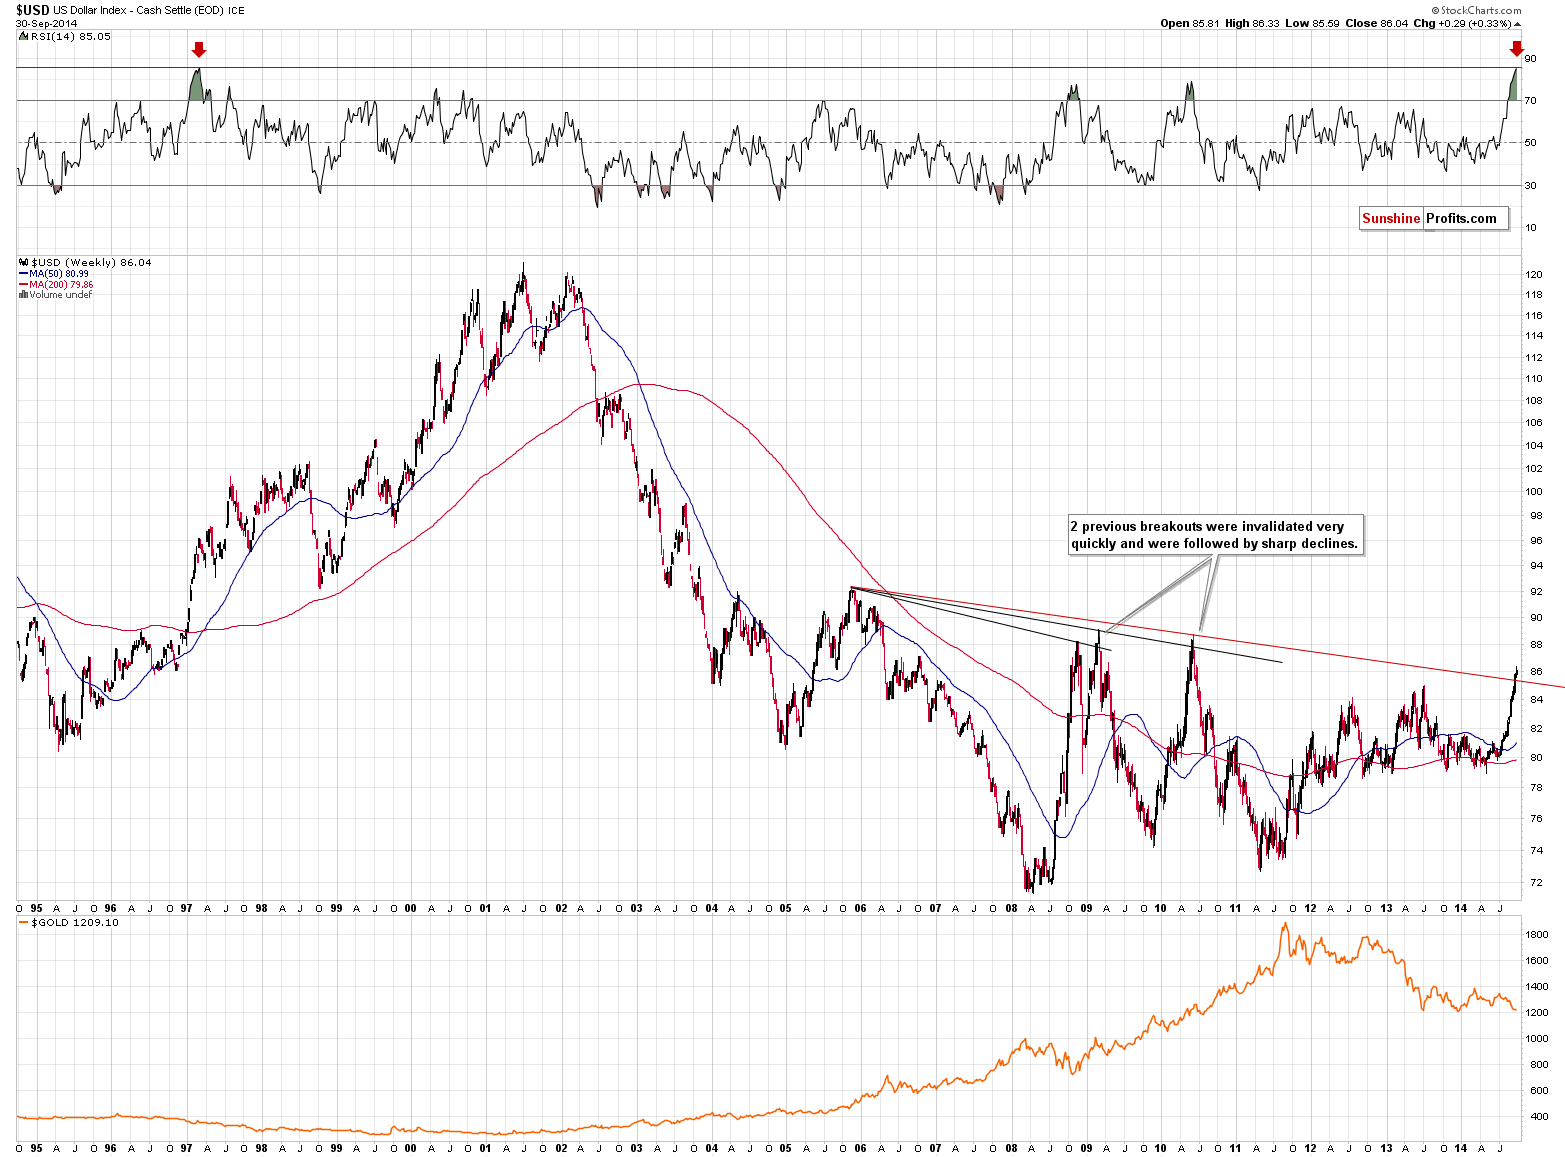
From the monthly perspective (and when you take a look at the above chart without enlarging it), the breakout is rather small. Enlarging the above chart, however, reveals that the breakout is indeed visible and similar to the previous 2 “breakouts.” The key thing here is that both previous breakouts above lines based on the 2005 high were followed by invalidations and sharp declines. That’s quite a good reason not to be bullish at this time or excited about the breakout.
There’s also another – perhaps even more important – interesting fact about the above perspective. The RSI indicator is at its 20+-year high. In other words, the sharpness of the most recent rally and absence of corrections have caused the USD Index to be extremely overbought from the medium-term perspective. We have been expecting the rally in the USD Index to be significant and we wrote on multiple occasions that given the long-term breakout that we saw over a year ago, the surprises would be to the upside, but no market could move in only one direction without periodical corrections. The RSI indicator tells us that such a correction is likely just around the corner.
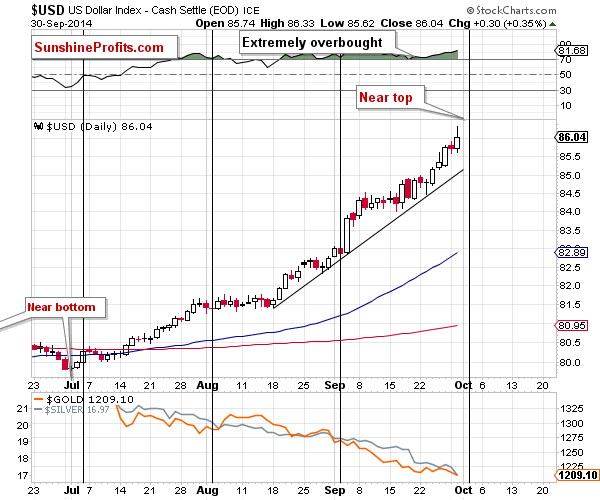
The USD Index rallied once again, but also – once again – reversed before the end of the session. Will it mark the top this time? It’s highly likely that it either does or that the top is very close.
The above is especially true given the proximity of the cyclical turning point. The turning point didn’t really work at the beginning of September, but that doesn’t make this technique any less valuable this time. No tool can work 100% of the time – if something works most of the time then traders should take it into account. Turning points have been very useful for years and it seems that paying attention to them now is also a good idea. At this time they tell us that a turnaround is just around the corner.
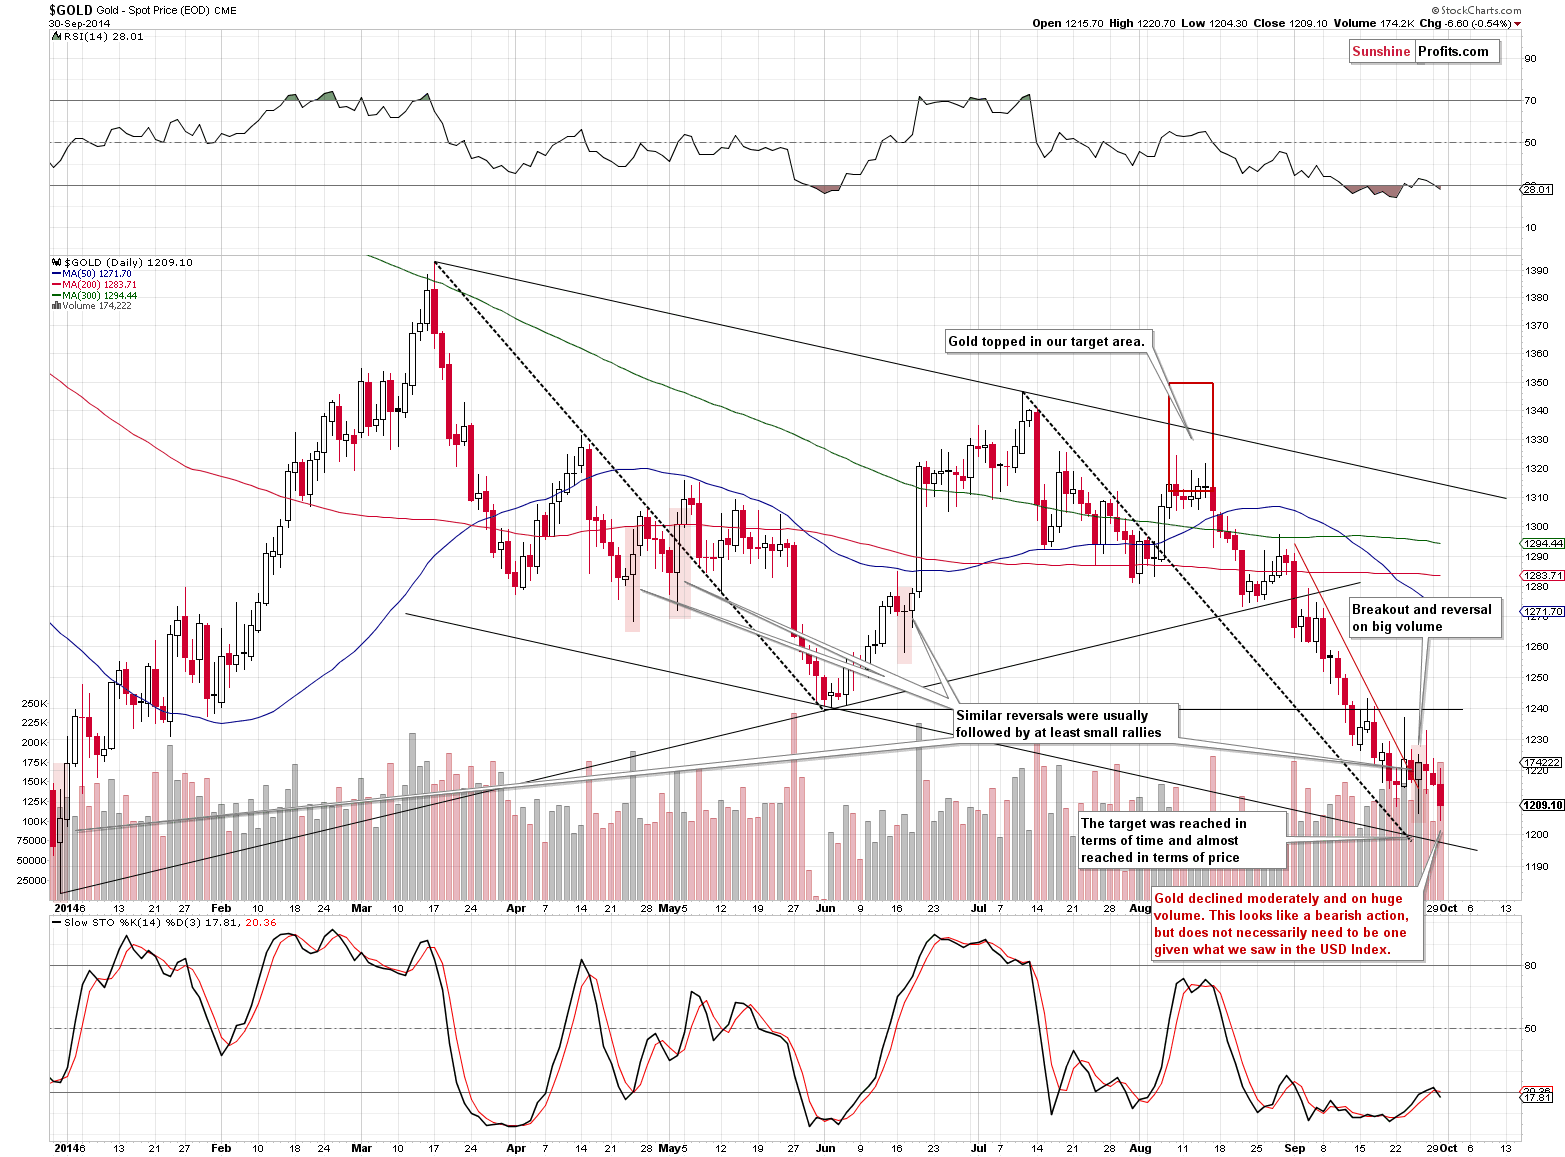
Given a rather significant rally in the USD Index, did gold decline as visibly? It didn’t. It barely moved below the previous intra-day low. It might be hard to believe, but gold is actually showing strength this week. It moved a bit lower, but it “should have” declined much more based on what happened with the USD Index.
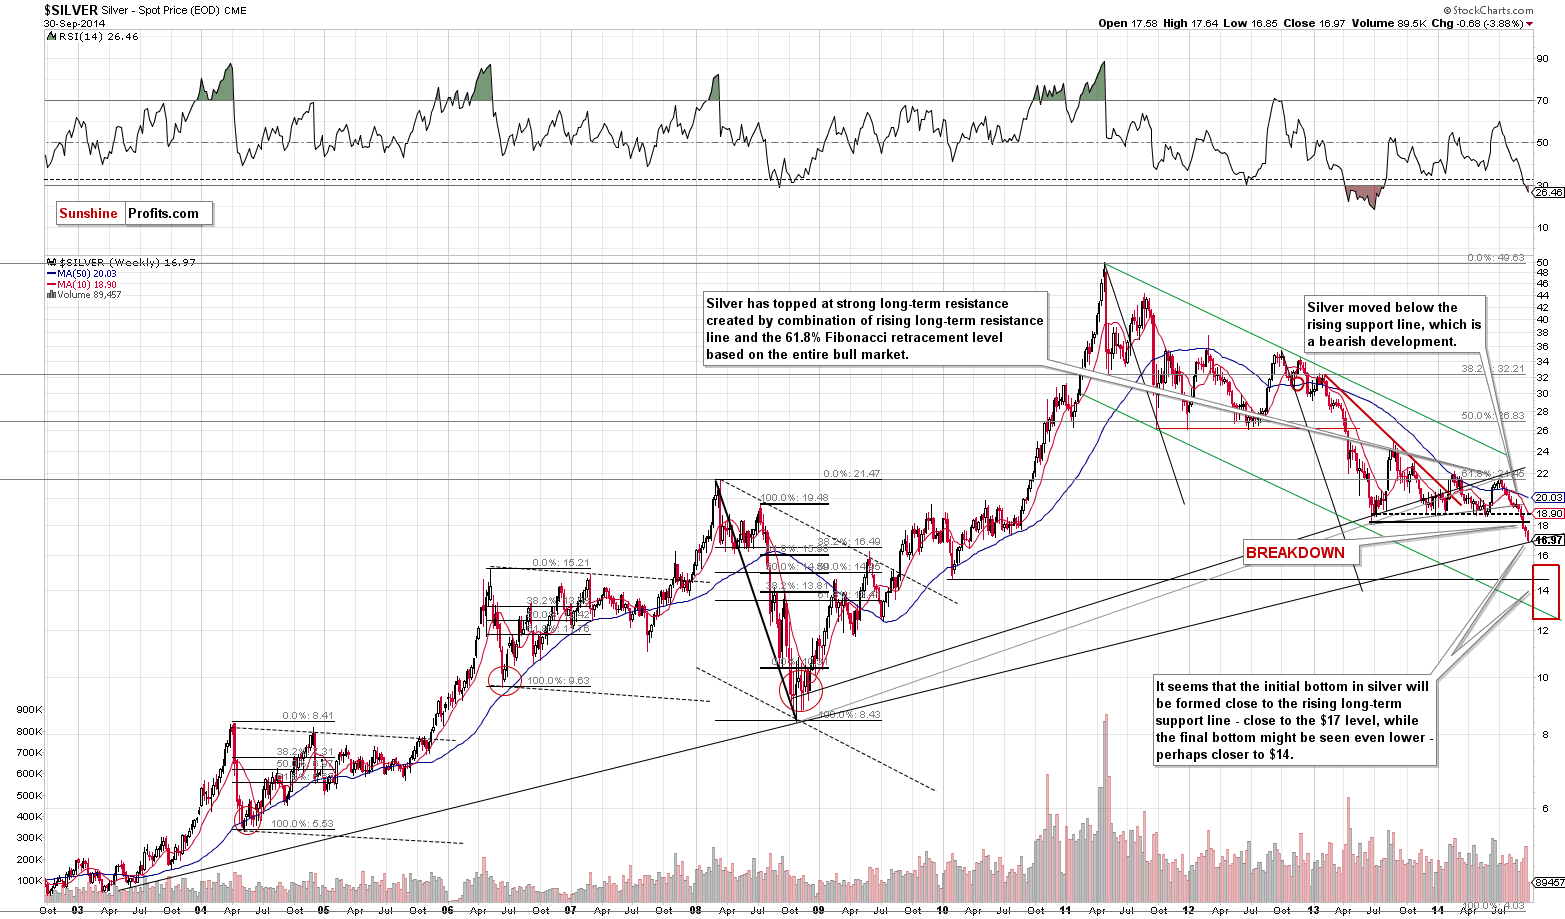
Of course, it was the silver market that got the most attention yesterday and it was not without a good reason. Silver declined over $0.50. It then moved back up somewhat, but still, the size of the intra-day slide was very visible. However, it was not the size of the move that is the most important thing to consider but the level that silver reached yesterday.
Silver declined to the very long-term and very strong support line (the one based on the 2003 and 2008 lows). That’s the last of the strong support levels that prevents silver from truly plunging – perhaps below $15.
Since silver is oversold on a short- and medium-term basis, it seems that a corrective upswing here is very likely.
Please note that the RSI indicator is at the level that marked a major bottom in 2008 and in 2012 – a move higher seems justified also from this perspective.
Having said that, let’s take a look at gold stocks – this time we will focus on their performance from the long-term perspective.
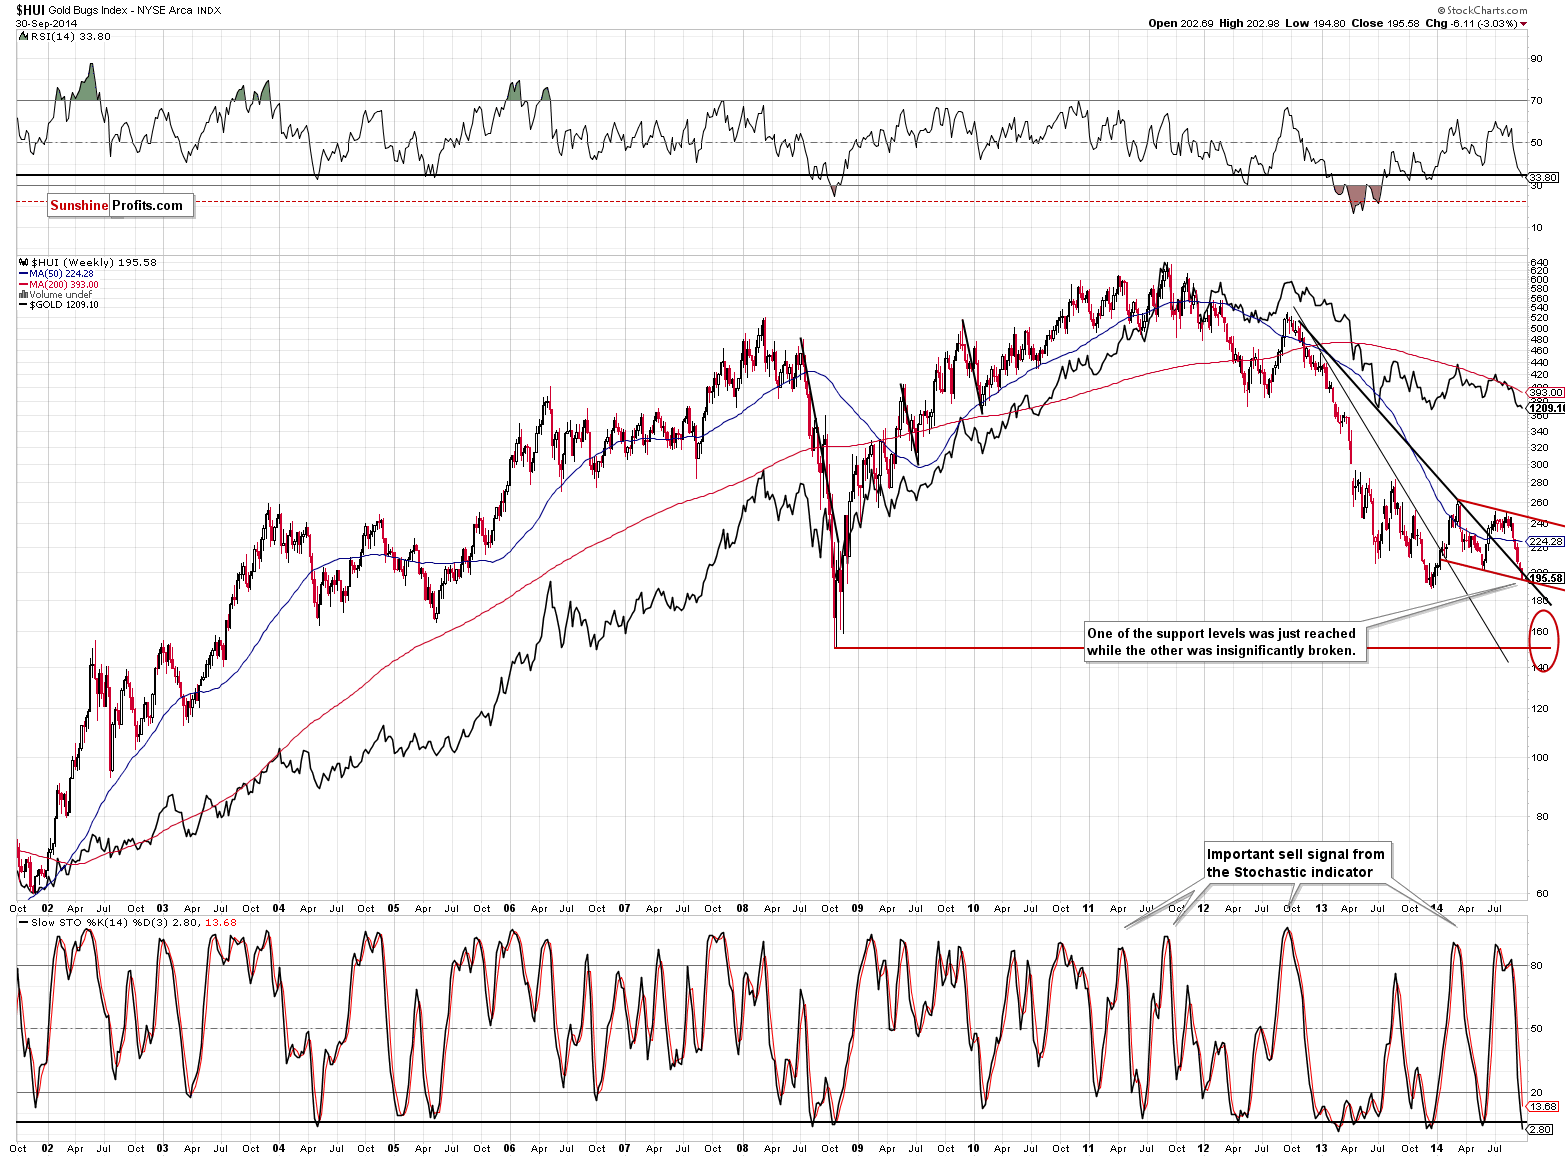
The HUI Index moved to the declining red support line, which is created as a parallel line to the declining resistance (based on this year’s highs). Gold stocks tend to form zigzags and it seems that we are seeing the final days of the big 2014 zigzag pattern. The declining black support line was insignificantly broken, but unless we see a weekly close below this level, it doesn’t seem that this breakdown should be treated as meaningful.
Moreover, the RSI indicator based on the HUI Index provides us with a similar signal as it does in the case of silver. The RSI moved to the level that corresponded to local bottoms many times in the past, including the final bottoms in 2004 and 2005. Gold stocks are quite likely to move higher at least temporarily.
Summing up, while the situation has been extremely overbought (USD) and oversold (gold, silver, mining stocks) from the short-term perspective for some time, we have now seen some important medium-term reversal signs as well. The cyclical turning point in the USD Index suggests that a turnaround is just around the corner and the RSI levels in the USD, silver and gold stocks point to a bigger corrective upswing. Additionally, gold has been showing strength in the previous several days by refusing to decline significantly even though the USD Index rallied significantly. The above is a bullish combination for the precious metals sector for the next several days or weeks, and a rally seems to be in the cards even if it doesn’t start right away.
To summarize:
Trading capital (our opinion):
It seems that having speculative long positions in gold, silver and mining stocks is a good idea:
- Gold: stop-loss: $1,187, initial target price: $1,249
- Silver: stop-loss: $16.57, initial target price: $18.07
- Mining stocks (price levels for the GDX ETF): stop-loss: $20.94, initial target price: $23.37
In case one wants to bet on higher junior mining stock ETFs, here are the stop-loss details and initial target prices:
- GDXJ stop-loss: $33.80, initial target price: $37.14
- JNUG stop-loss: $12.37, initial target price: $16.34
Long-term capital (our opinion): No positions
Insurance capital (our opinion): Full position
Please note that a full position doesn’t mean using all of the capital for a given trade. You will find details on our thoughts on gold portfolio structuring in the Key Insights section on our website.
Our preferred ways to invest in and to trade gold along with the reasoning can be found in the how to buy gold section. Additionally, our preferred ETFs and ETNs can be found in our Gold & Silver ETF Ranking.
As always, we'll keep you - our subscribers - updated should our views on the market change. We will continue to send out Gold & Silver Trading Alerts on each trading day and we will send additional Alerts whenever appropriate.
The trading position presented above is the netted version of positions based on subjective signals (opinion) from your Editor, and the automated tools (SP Indicators and the upcoming self-similarity-based tool).
As a reminder, Gold & Silver Trading Alerts are posted before or on each trading day (we usually post them before the opening bell, but we don't promise doing that each day). If there's anything urgent, we will send you an additional small alert before posting the main one.
Thank you.
Sincerely,
Przemyslaw Radomski, CFA
Founder, Editor-in-chief
Gold & Silver Trading Alerts
Forex Trading Alerts
Oil Investment Updates
Oil Trading Alerts

