
- Curious Case of Ben Bernanke
- USD and Euro Indices
- General Stock Market
- Correlation Matrix
- Gold
- Silver
- Mining Stocks
- True Seasonals
- Letters from Subscribers
- Gold to silver ratio
- CFTC attempts to limit speculation in commodities
- How to short miners?
- Summary
Curious Case of Ben Bernanke
Without a doubt, the biggest news in recent weeks has been the upcoming replacement of Fed Chairman Ben Bernanke by Janet Yellen, Vice Chair of the Board of Governors and a highly qualified economist who, many predict will continue in the Bernanke mold.
Bernanke’s story is actually quite fascinating, and can teach us how to approach future Fed nominations. Before becoming the world’s most prominent central banker, Bernanke was a university professor heavily engaged in theoretical considerations about various options of monetary policy. As an authority on the Great Depression of the 1930s, the main topic of his work centered on unusual activities of central banks related to deep recessions that the economy may suffer. His has been a lifelong study of the insidious effects of deflation and the measures that may prevent it.
It was no surprise that he was chosen to succeed Alan Greenspan. Due to the massive Greenspan bubble, significant credit expansion and the real estate mess, creative solutions had to be found and Ben Bernanke was the best man for the job. The best specialist, a sort of Mr. Wolf (from Tarantino’s Pulp Fiction) of monetary policy, economic magician ready to prepare new government bullets to back up endangered dollar system.
His tenure as Fed chairman included the biggest financial challenges faced by the U.S. since the 1930s Depression, his academic field of expertise. The remarkable fact is that if one wanted to understand this choice, if one wanted to know the kind of Fed chairman Bernanke’s would be, one just had to read his academic articles on exceptional monetary policy tools during times of significant crisis.
What special tools did Bernanke have in mind? Under normal circumstances, the central bank has a specific job: print money and hand it out to the banks. The banks then are supposed to pass that money to lenders who will invest it in businesses that will stimulate economic growth. Sometimes, however, this “monetary transmission mechanism” breaks down (as the Keynesians wrongfully call it, a “liquidity trap” which is when injections of cash into the private banking system fail to lower interest rates and fail to stimulate economic growth). People react by hoarding cash because they expect trouble up ahead. The hallmark of a liquidity trap is short-term interest rates near zero. Then the regular run-of-the-mill printing is doing only part of the job (helping the banks), but not the other part (helping some more and causing disastrous inflation).
In his academic writings Bernanke said that under special circumstances, when the monetary transmission mechanism breaks down, there are three additional tools: (1) shaping long-term expectations about interest rates, (2) expanding the balance sheet of the central bank, (3) changing the structure of expanding the balance sheet of the central bank.
It was all stated openly and clearly in Bernanke’s publications. It almost sounded like a short manual written for the central banker for times when the system is in trouble. There was no surprise then that when Bernanke became the Boss, he followed the advice to the letter. We could have used his articles as a tool to predict his moves. For press releases, for quantitative easing, so called operation “Twist”, or for other special operations performed by the Fed.
There was one thing, which was not discussed in Bernanke’s articles: Fed’s chairman’s stepping aside. However, there was something about possible central bank’s “running out of ammunition”… Is professor Bernanke being fired, or is there perhaps another reason behind his leaving? Isn’t it the case that the chairman has in fact no ammunition left, and does not believe in possible success of his actions – perhaps even viewing the massive money printing as unsustainable and leading to runaway inflation? Impossible to know, but we can’t rule out such scenario – the one in which even Bernanke might view gold as a great investment.
The above is based on the November Market Overview report. Let’s move to charts to see what’s likely to happen in the medium- and short term (charts courtesy of http://stockcharts.com.)
USD and Euro Indices
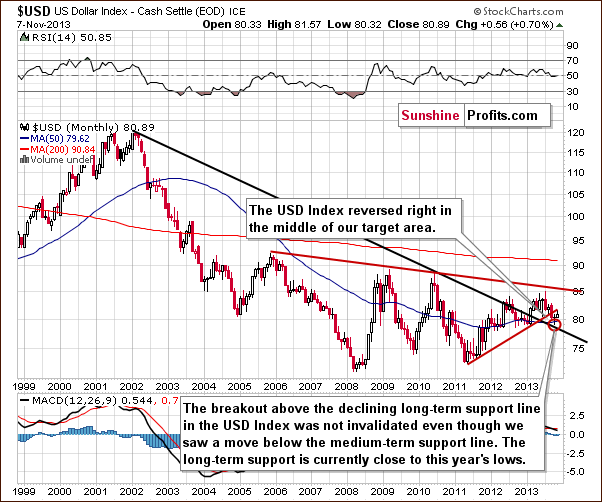
On the above chart we see that the long-term breakout above the declining long-term support line was not invalidated. Additionally, the USD Index reversed right in the middle of our target area. Therefore, from this perspective, it seems that the downward move – if it’s not already over – will be quite limited because the long-term support line will likely stop any further declines.
Now, let’s examine the weekly chart.
Looking at the above chart we clearly see that the situation has improved.
As we wrote in our previous Premium Update:
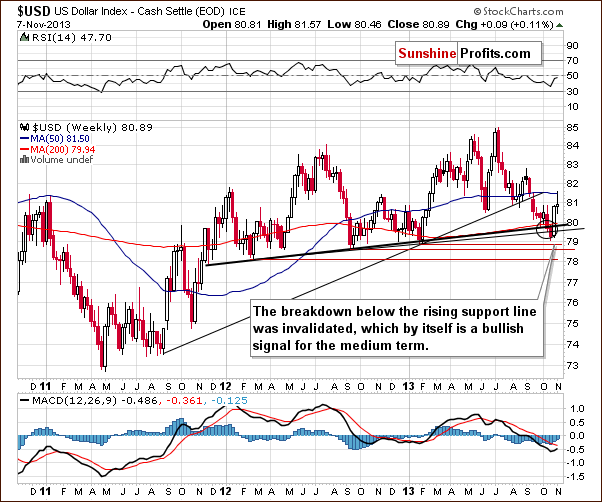
(…) the USD Index moved higher this week and the move below the lower support line was already invalidated. The invalidation by itself is a bullish signal. If we see a bold move back above the 80 level, the breakdown will be fully invalidated and the implications will be clearly bullish for the coming weeks.
On the above chart we see that the U.S. dollar extended gains in the previous week (and earlier this week), which was in perfect tune with the above. In this way, the breakdown below the medium-term support line based on the February 2012, September 2012 and January 2013 lows (a bold black line) was also invalidated, which is a bullish signal for the medium term.
Let’s check the short-term outlook.
Quoting our previous Premium Update:
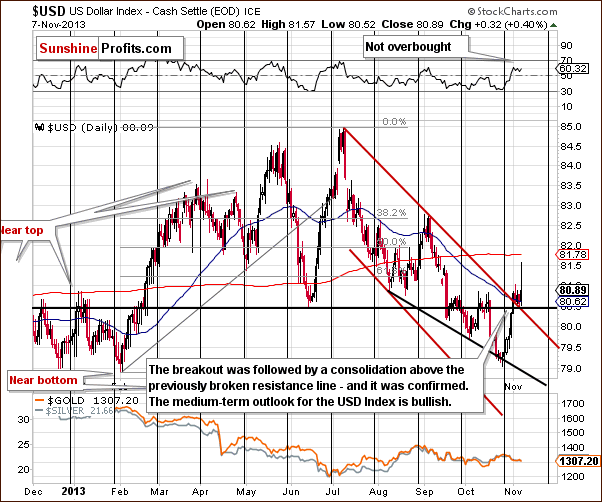
(…) the price bounced off the 2013 low which we saw in early February. Those who have been following our analyses for longer are probably not surprised to see that the turnaround happened at the cyclical turning point.
On the daily chart, we see that USD Index rallied in the previous week and moved above the previously-broken resistance line based on the June low. Additionally, earlier this week, the U.S. dollar broke above the short-term resistance line based on the July and September highs. Looking at the above chart we see that both breakouts were confirmed.
From this point of view the outlook for the USD Index is bullish.
Let’s now take a look at the Euro Index.
Looking at the above chart we see that the long-term downtrend remains in place. Additionally, it seems that the short-term uptrend might already be over.
Quoting our previous Premium Update:
(…) the Euro Index moved very close to the strong resistance created by the declining resistance line and if it was the case that many traders were planning to bet on the turnaround in the index, it could be the case that the price will not reach the resistance line at all.
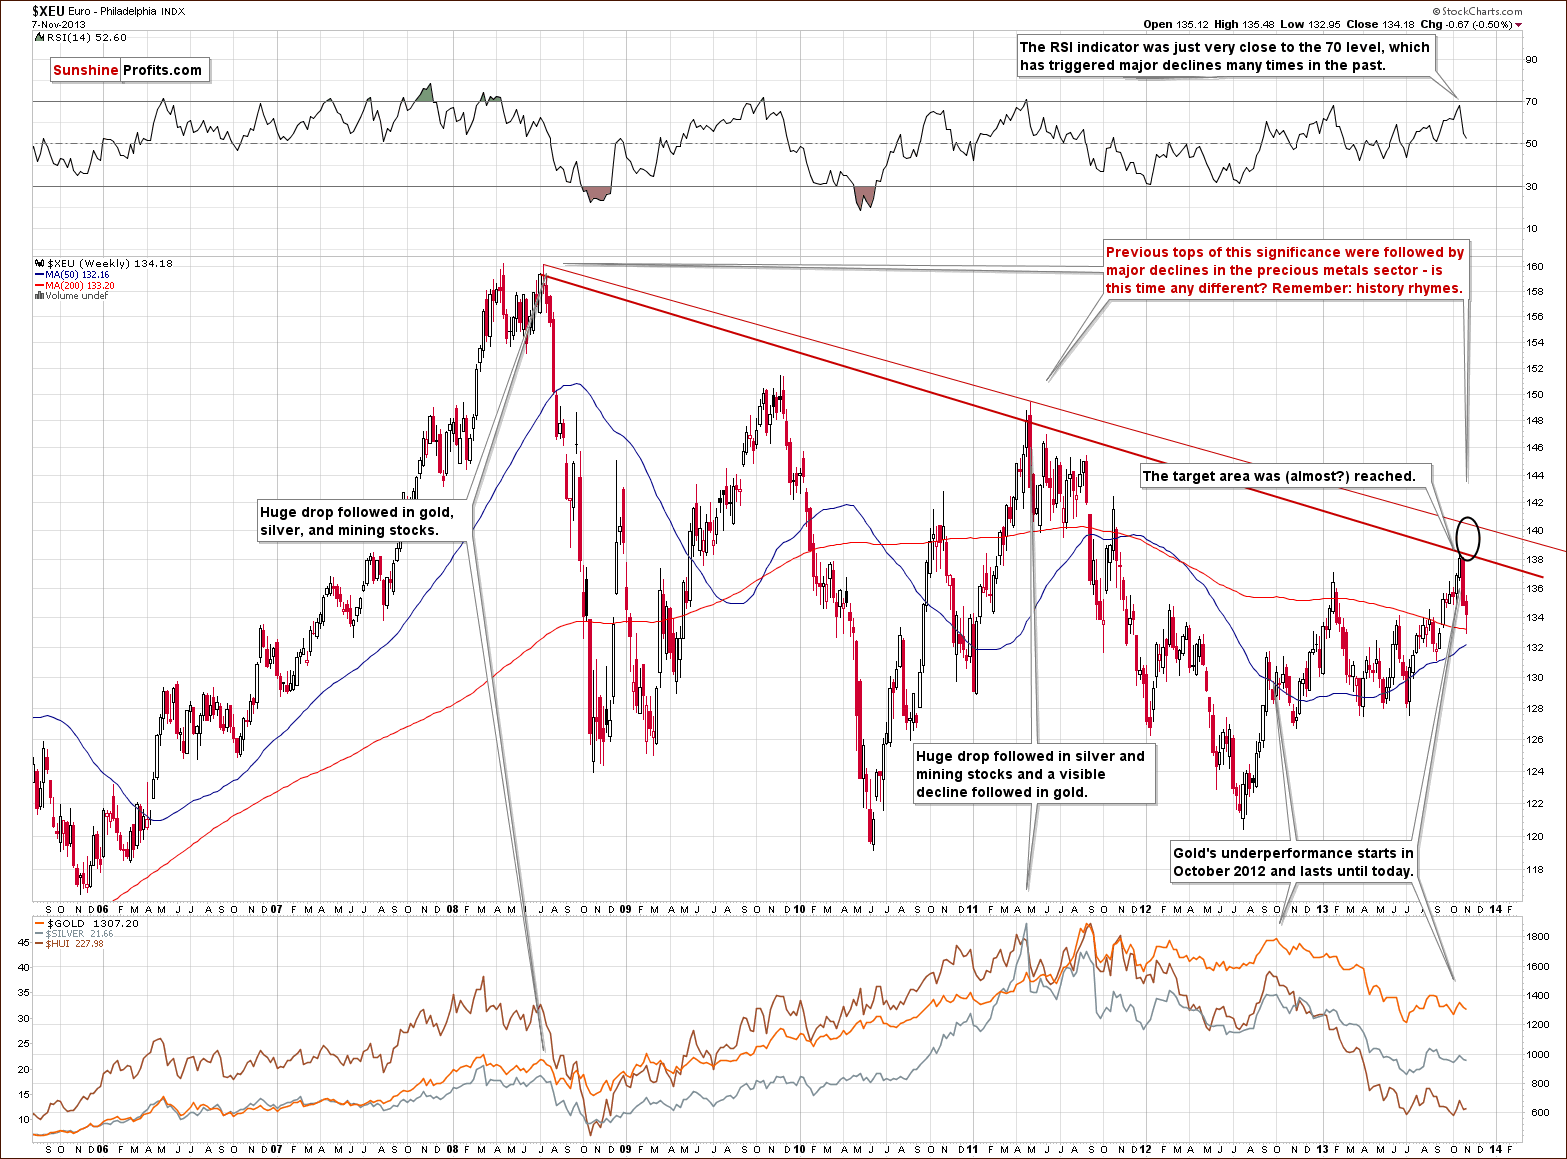
As you see on the above chart we actually saw such a price action in the previous week. Although the euro moved very close to the declining resistance line it didn’t break above it. Additionally, at the same time the RSI bounced off the 70 level (it was not reached, important tops used to form also when the RSI was close to this level), which was a bearish sign. This show of weakness in combination with the position of the RSI triggered a heavy decline and the European currency dropped below the 135 level. Earlier this week, the euro extended declines and it seems that the downward move is not limited at the moment.
At this point, we would like to emphasize one important fact: the previous tops (in 2008 and then in 2011) were followed by major declines in the precious metals sector. If history repeats itself we may see similar price action in this situation.
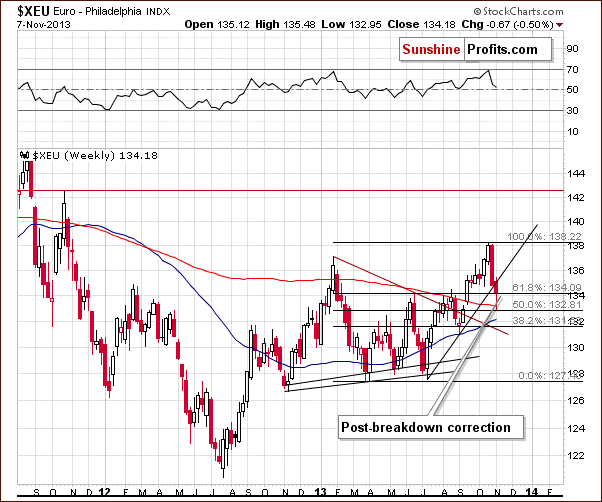
From the short-term point of view, the situation is a mirror image of what we saw on the short-term USD Index chart. The euro moved below its rising support line and corrected after that without invalidating the breakdown. Please note that the Euro Index corrected 50% of its entire July – October rally, which means that it could pause before the rally continues. It fact, it already has by correcting to the upper Fibonacci retracement level and closing there on Thursday. When we’ll see a move below the lowest of the marked Fibonacci retracement levels, we’ll have a much more bearish situation. It is bearish at this time as well, but the implications will be stronger if a move below 131.56 is seen.
Summing up, we could see further deterioration in the Euro Index and strength in the USD Index not only on a short-term basis, but also in the medium term. It seems that the downward move in the euro is not limited at the moment, therefore, the implications for the precious metal market are bearish. We will discuss this once again in the Correlations section.
General Stock Market
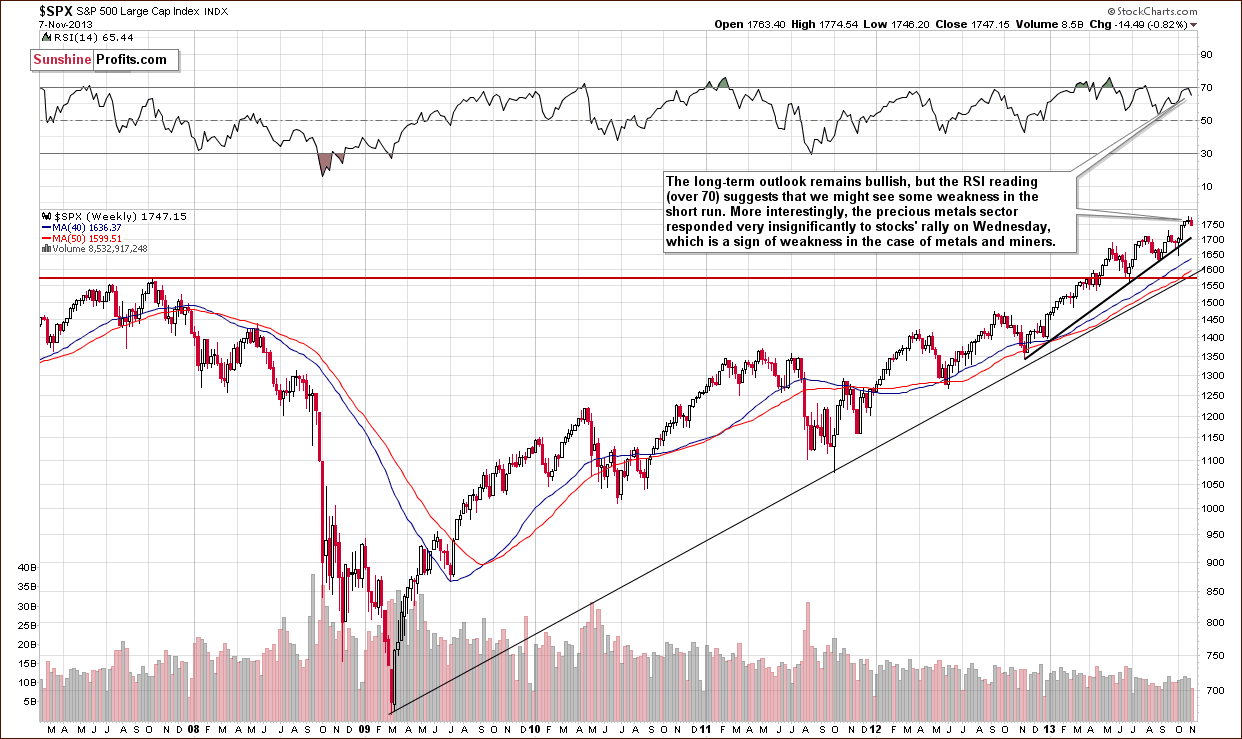
On the above chart we see that the S&P500 Index moved higher in recent days and almost touched the October top on Wednesday. From this point of view, the long-term outlook remains bullish. However, the RSI reading (over 70) suggests that we might see some weakness in the short term.
As we wrote in our previous Premium Update:
(…) it’s not a crystal-clear signal, though. There were times when stocks managed to rally despite overbought RSI readings. It seems to us that it’s likely a short-term sell signal after all. The reason is that the currency markets (USD and Euro Indices) reached their major turning points (not only the short-term ones) and this can change things temporarily on the US stock market as well.
Before we moved to the section about gold & silver correlations we would like to focus for a moment on an upward move that we saw on Wednesday. Back then the precious metals sector responded very insignificantly to stocks’ rally, which is a sign of weakness in the case of metals and miners. As you will see in the Correlation Matrix below the medium-term implications for gold, silver and mining stocks are bearish.
Gold & Silver Correlations
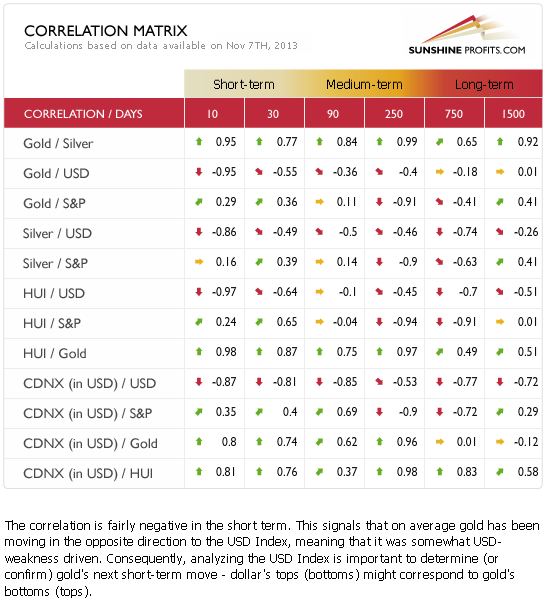
Last week we wrote that the values in the above table are getting back to their normal values, but that it was not clear if this is really the case, or was that just short-term price noise.
Based on the most recent data, it seems that the negative correlation is back in case of the USD Index and the precious metals market. Consequently, the implications of the situation in the USD Index are not only bearish in the medium term, but also in case of the short term.
Gold
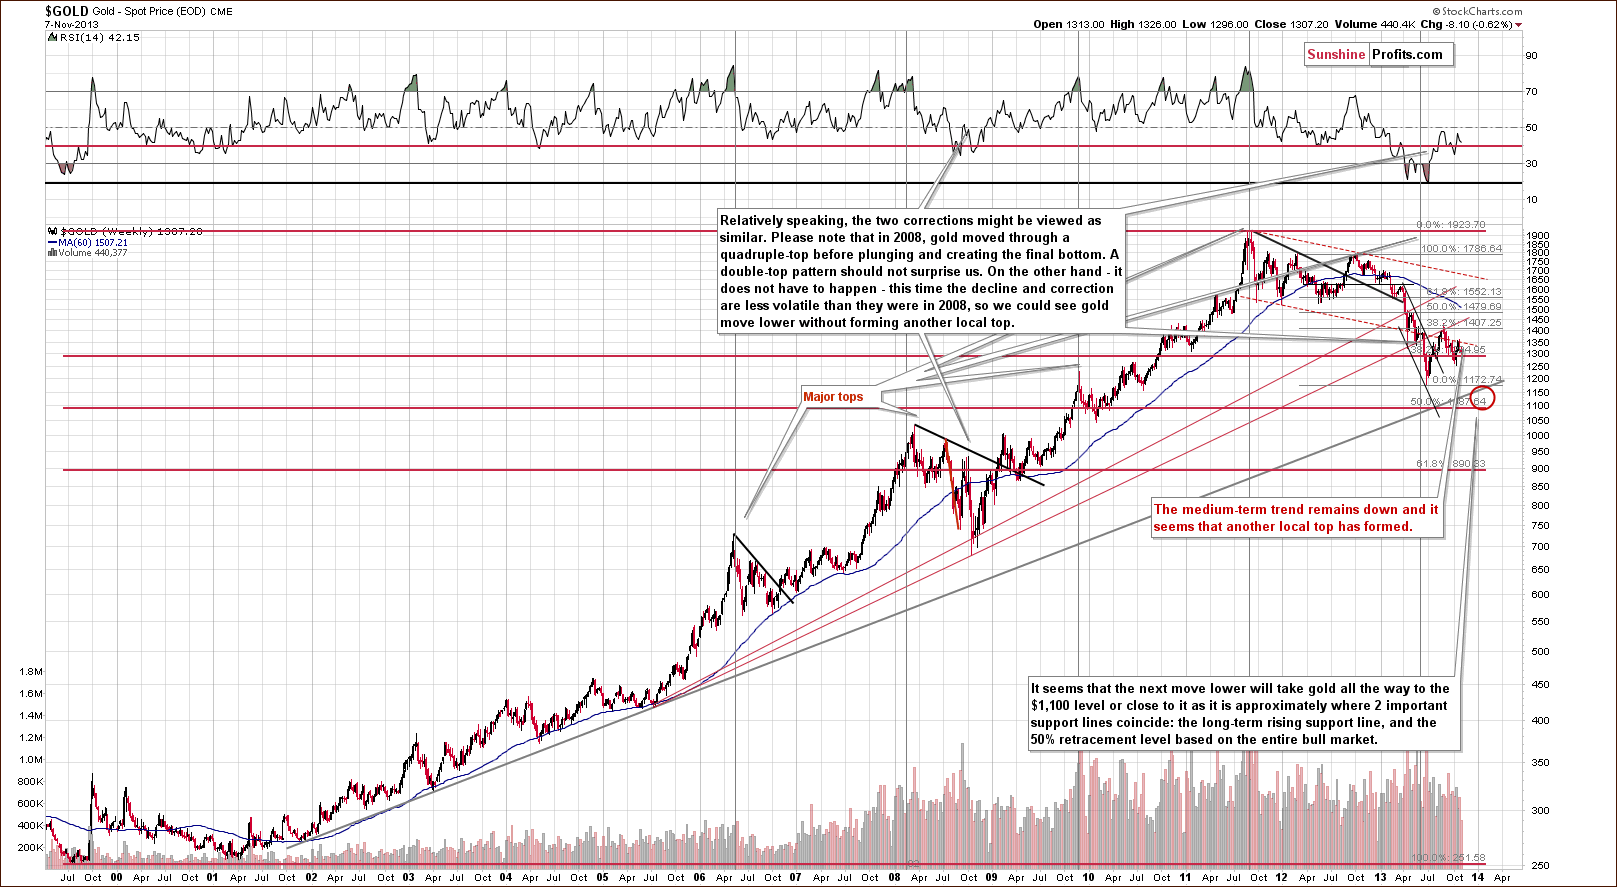
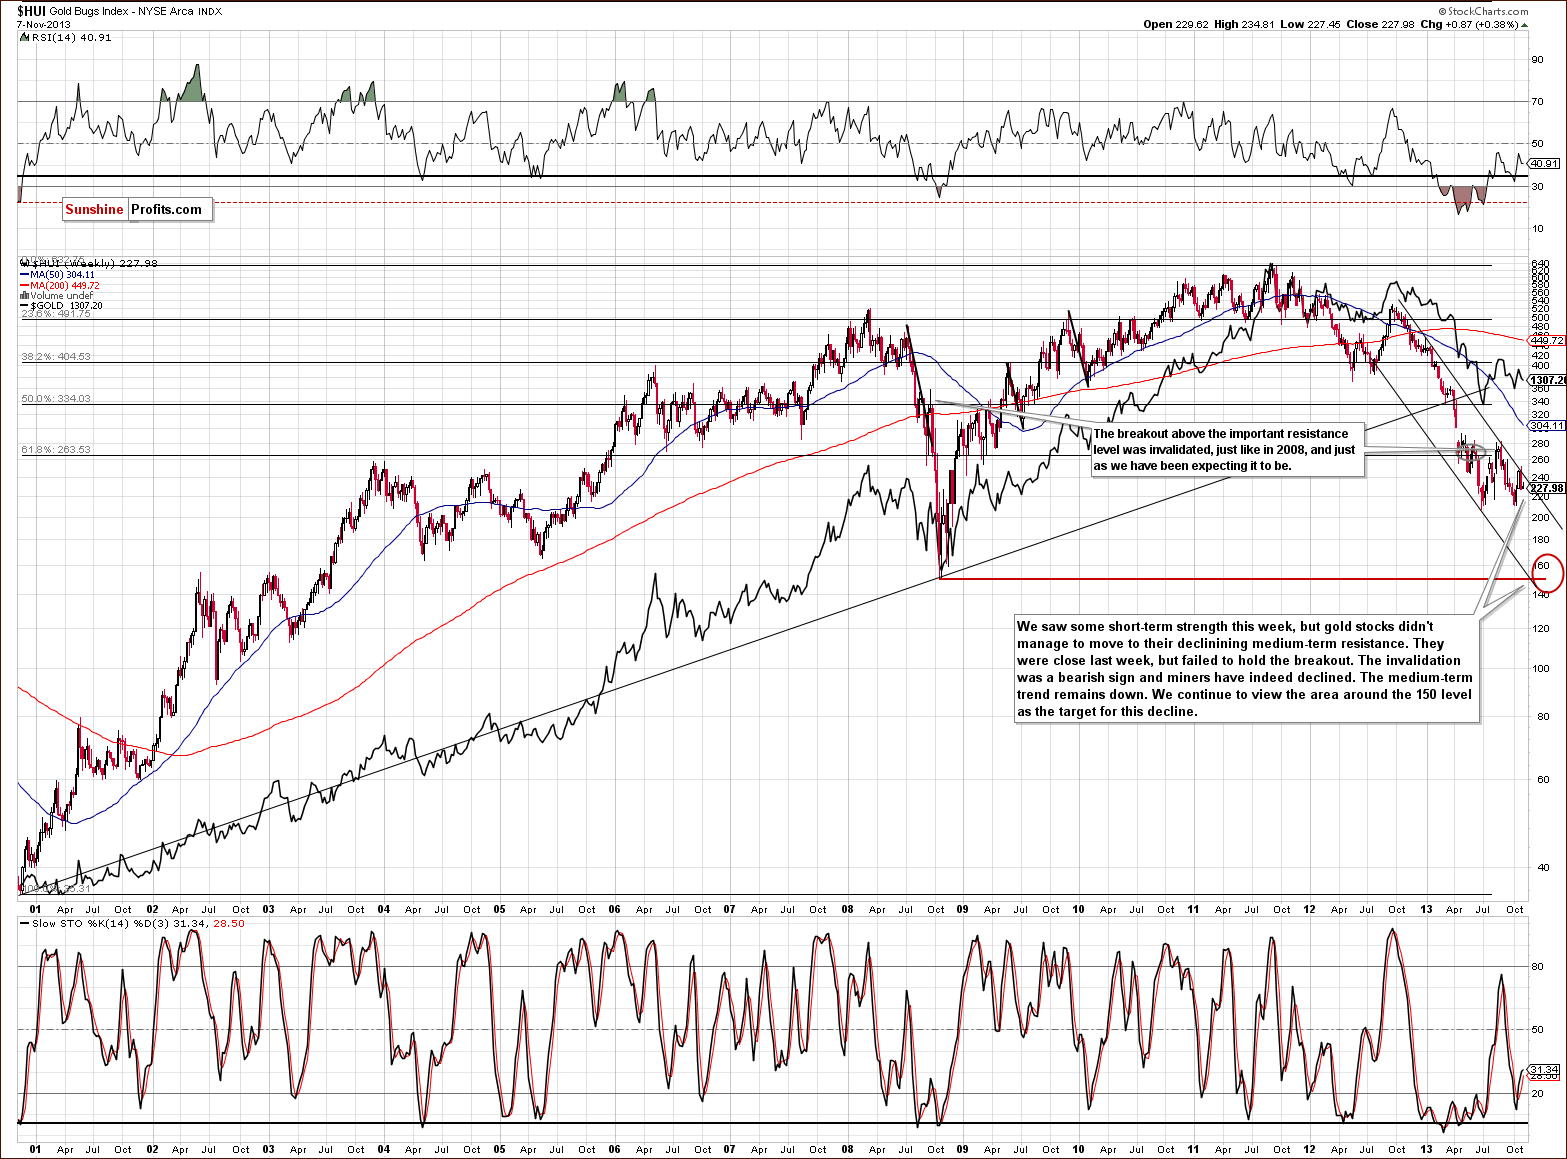
Looking at the above chart we see that the situation hasn’t changed much from the long-term perspective. The medium-term outlook was bearish as gold had already broken below the long-term rising support line and last week’s decline naturally hasn’t made the situation look bullish.
The medium-term trend remains down and from this perspective it seems that another local top has formed. Therefore, further deterioration is quite likely, if not immediately, then at least soon.
Let’s move on to the short-term chart to see the recent price moves more clearly and estimate the short-term outlook.
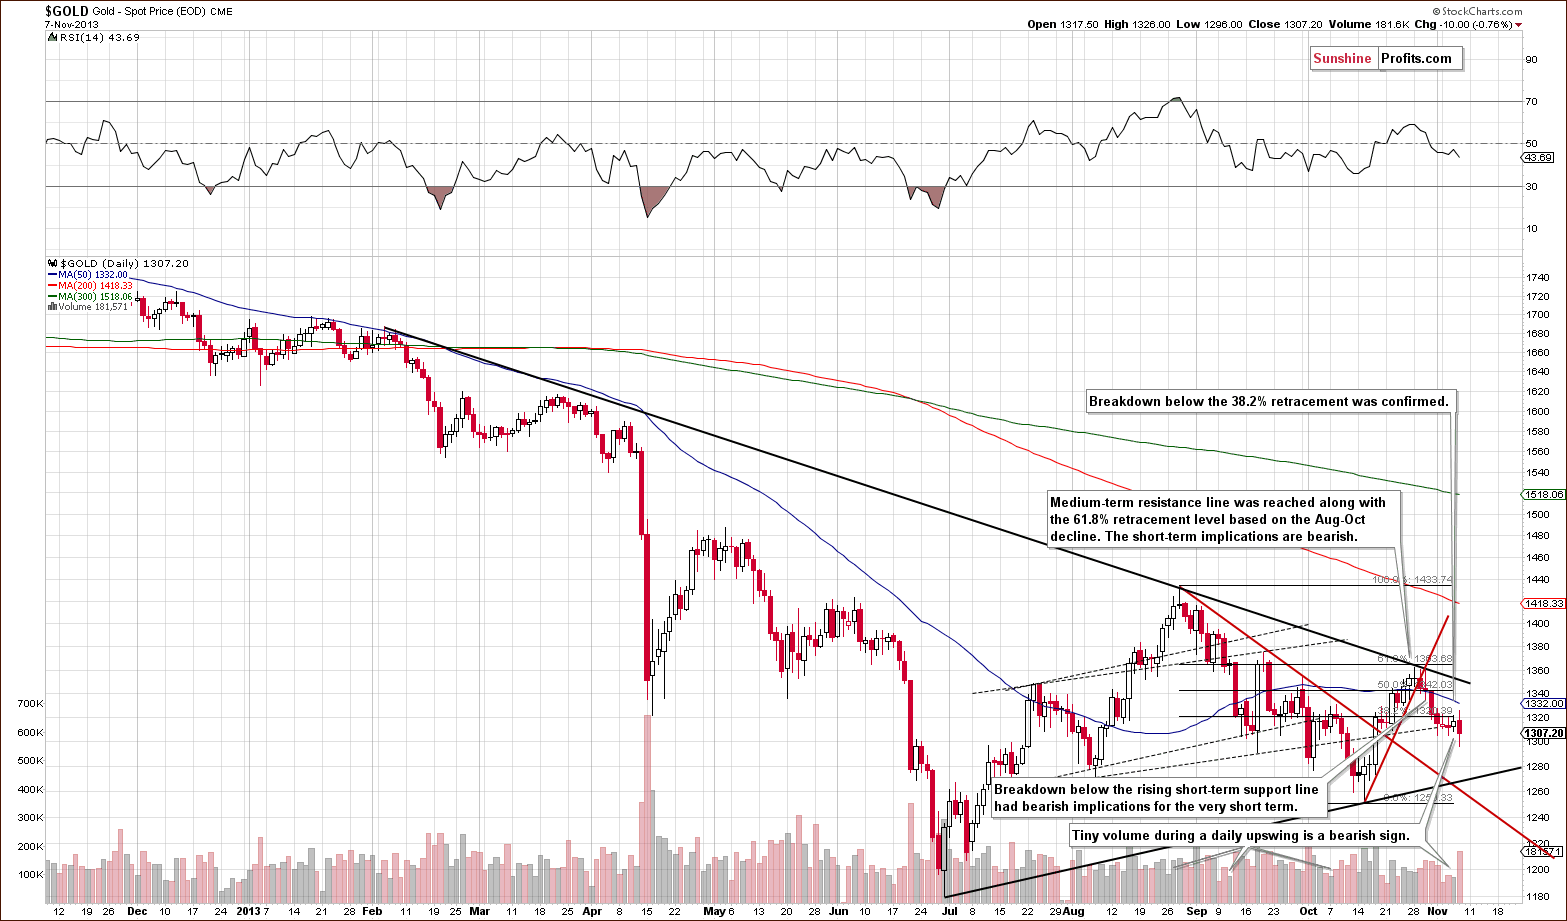
On the above chart we see that the situation has deteriorated since our previous Premium Update was published.
Although the yellow metal reached the declining resistance line in the previous week it didn’t manage to break above it, which had bearish short-term implications. After three unsuccessful attempts to move above the 61.8% Fibonacci retracement level based on the August-October decline and the breakdown below the short-term rising support line (marked with red on the above chart) gold continued its decline until the end of the previous week. With this downward move the yellow metal almost reached an important support level at $1,300.
At this point, it’s worth noting that gold dropped below the 38.2% Fibonacci retracement level based on the August-October decline and the breakdown was confirmed, which has bearish implications for the very short-term.
Looking at the daily chart we see that the recent days have formed a consolidation and the yellow metal is trading in the narrow range. Although we saw an upswing on Wednesday it materialized on a tiny volume, which was (and still is) a bearish sign. Therefore, if the price of gold drops below $1,305, and the breakdown is confirmed we may see further deterioration. This seems quite likely, i.e. based on USD Index’s breakout.
From the short-term the outlook remains bearish as well.
Let’s take a look at the chart featuring gold’s price from the non-USD perspective.
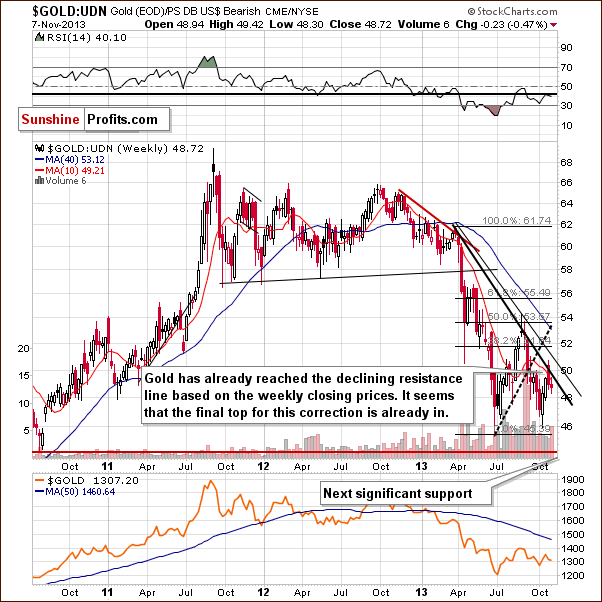
Looking at the above chart, we see that although the non-USD gold price moved above its declining resistance line (an intra-day move) in the previous week, this improvement was only temporary. Earlier this week we saw a drop below this line and the breakout was invalidated, which by itself is a bearish signal for the short and medium term.
From this perspective, it seems that the recent correction was nothing more than a confirmation of a breakdown that we saw begin in mid-September. Therefore, the medium-term outlook remains bearish.
Summing up, the medium-term outlook for gold remains bearish, and at this time the short-term outlook is bearish as well.
Silver
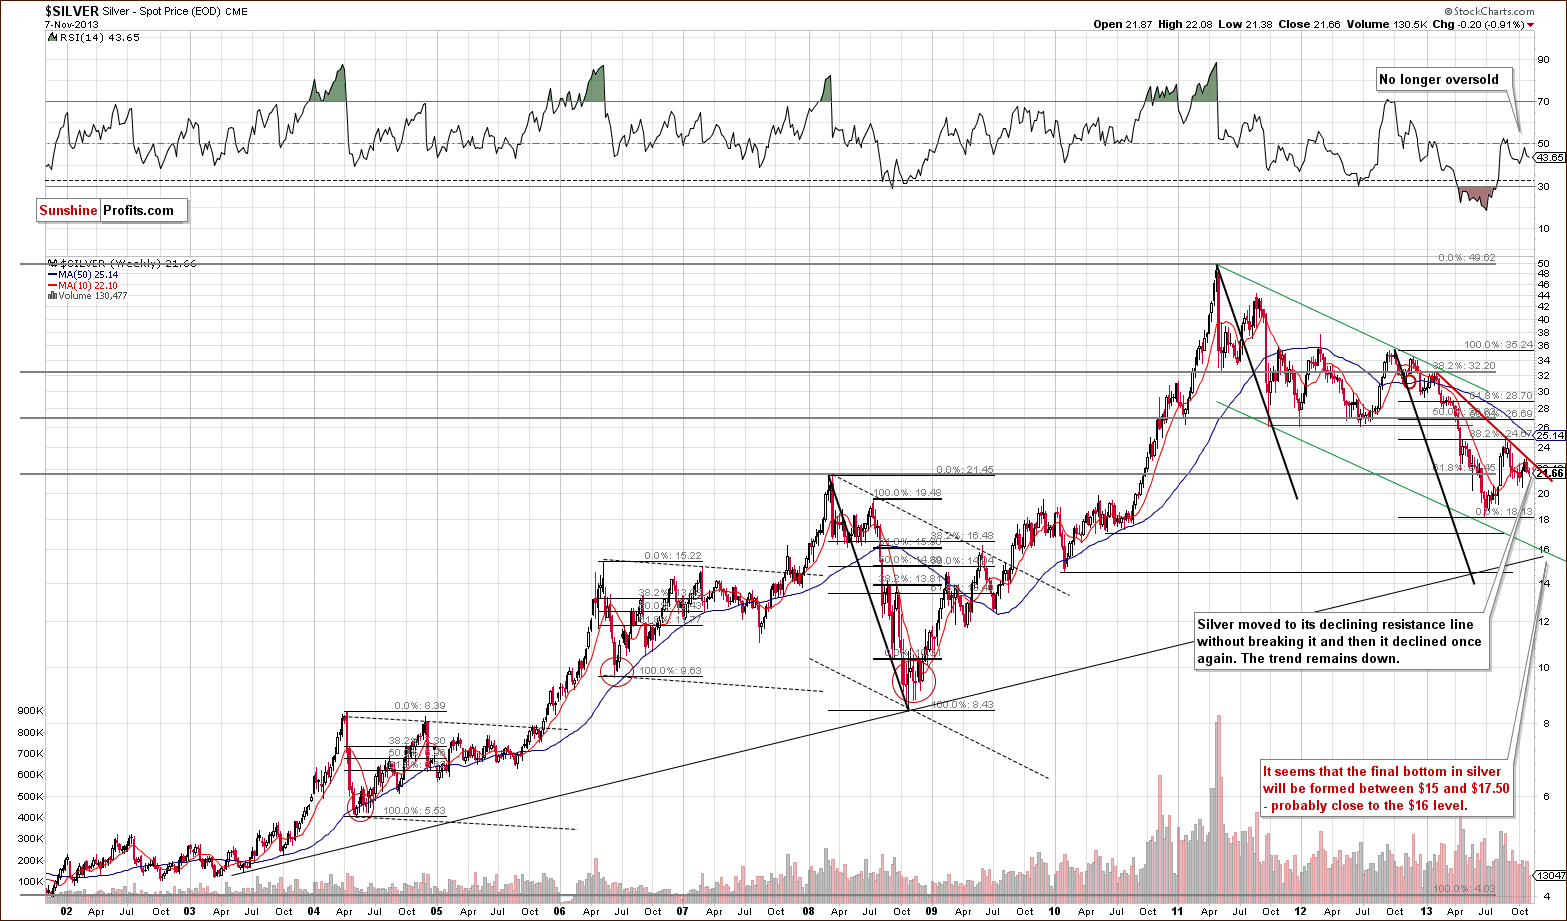
In the previous week silver climbed to its medium-term declining resistance line based on the February and August highs. However, there was no breakout above this line. This show of weakness triggered a decline, which pushed the white metal below $22. With this downswing silver almost reached the 2008 top, which seems to have served as an additional support.
Nevertheless, if we see further growth in the USD Index we may see a breakdown below this level and the current decline will be likely to accelerate.
At this point it’s worth mentioning the position of the RSI. Quoting our previous Premium Update:
(…) although the indicator was heavily oversold in April, silver declines accelerated and reached the 2013 low in June. Therefore, it seems that bigger declines can be seen in the white metal in the near future, even though the RSI remains in the middle of the trading range – especially when we take into account the proximity of the above-mentioned medium-term declining resistance line.
All in all, it seems that the white metal still remains in a medium-term downtrend.
Now, let’s move to the short-term chart to see the very recent price moves more clearly.
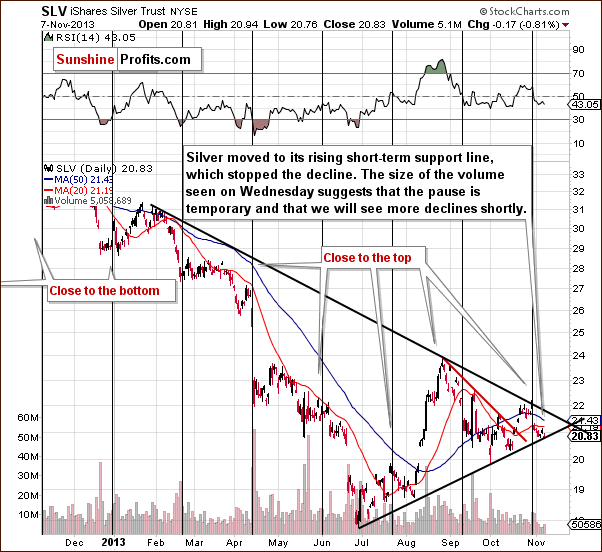
Looking at the above chart we see that the medium-term declining resistance line stopped further growth in the previous week. Although there was a breakout above this line on an intra-day basis, silver didn’t manage to hold these gains. This negative event triggered a decline, which took the SLV ETF to the rising short-term support line based on the June and October lows.
Please note that the size of the volume seen on Wednesday suggests that the pause is only temporary and we will likely see further declines in the near future – especially when we take into account the situation in the USD Index. Again, as it is the case with support created by the 2008 high, it seems that once this level is broken, we will see an acceleration in the decline.
Summing up, after an upward move to the medium-term declining resistance line and its cyclical turning point, silver gave up the gains and declined in the following days. The outlook for silver is currently bearish for the medium and short term. Even if we saw some strength, it doesn’t seem likely that the white metal would move above the declining resistance line visible on the above SLV chart.
Gold & Silver Mining Stocks
From the long-term point of view, nothing changed. The trend was down last week and the same is the case right now. We haven’t seen any breakout above the declining resistance line and we can expect big moves to the downside in the days or weeks ahead.
Last week we mentioned that there were some bullish indications on the chart featuring junior mining stocks.
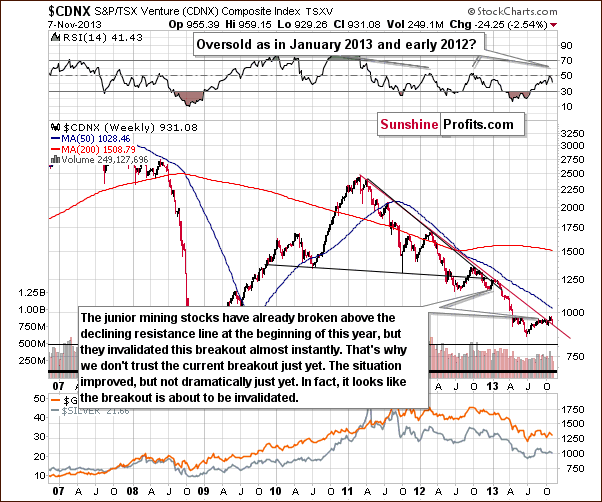
In our previous Premium Update we commented on the above chart in the following way:
Although the juniors sector moved above the declining resistance line, we think that it’s still too early to say that the breakout has been truly confirmed – especially when we take into account the position of the RSI.
Please note that the last two times when the indicator reached these levels, major medium-term tops were formed. Therefore, we would need to see a verification of the breakout first to view it as an important medium-term signal. This would be the case in any other breakout as well, but in case of the above chart, waiting for a verification seems particularly justified because we have already seen a false breakout at the beginning of this year – one which was followed by a significant decline in the entire precious metals sector.
Since that time, juniors have declined and they look like they are about to invalidate the previous breakout, which would – naturally – have bearish medium-term consequences.
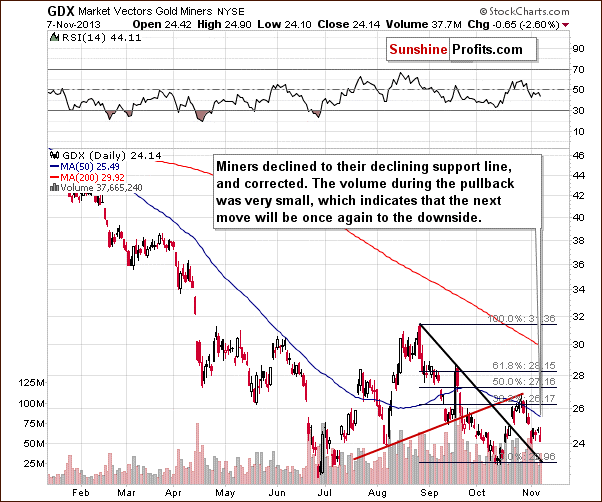
From the short-term point of view, it seems that we just saw or are still seeing a pause within a short-term decline (which could become a medium-term decline). The last time when miners rallied was on Wednesday and that move materialized on low volume, which was a bearish indication. Thursday’s decline took place on higher volume, which suggests that this is the real direction in which the market is heading.
One might ask if the consolidation is a sign of strength of the precious metals sector. To estimate that, let’s see what would be likely to happen if there were no strong trends present. This is where True Seasonal patterns come into play.
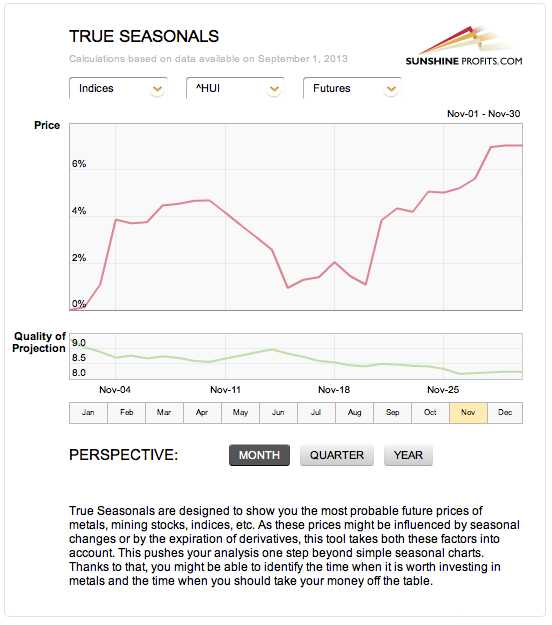
It turns out that miners “should have” rallied in the very first part of November, and all they managed to do was to pause after a decline. The most recent consolidation that we have seen on the GDX ET chart above is therefore a sign of weakness, not strength. Furthermore, it seems that the decline may continue shortly as according to November True Seasonals, we are likely to see a decline in a few days. On a side note, the True Seasonals tool had just correctly predicted the rally in the beginning of the month on the stock market and the local top that has (most likely) just been formed. You can read more here.
Finally, we would like to discuss the current situation on the gold stocks to gold ratio.
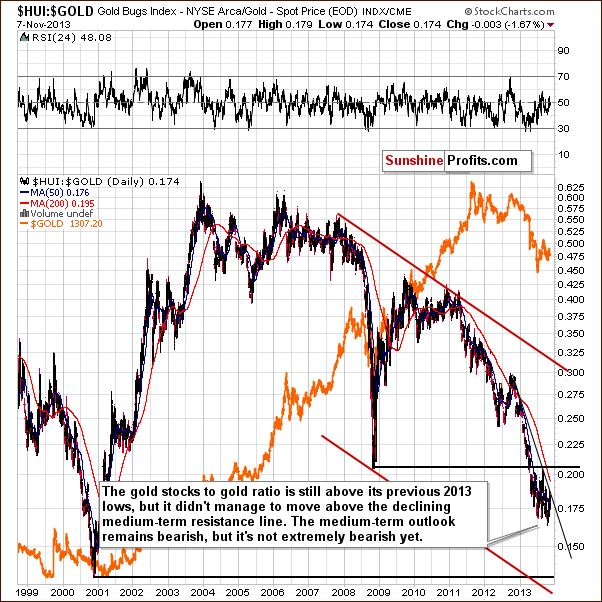
In Wednesday’s Market Alert we wrote the following:
In short, we think it is enough to justify taking an extra speculative short position (meaning a normal one, as we had previously opened just a small one), but it's not enough to suggest selling/hedging long-term investments.
The reason for the latter lies in one of the most important factors that convinced us that the medium-term trend is down: the gold-stocks-to-gold ratio. As long as this ratio stays above its previous 2013 lows, we will most likely not consider the outlook to be bearish enough to justify selling/hedging the long-term investments. Most likely – because we could indeed see a very bearish combination of other factors that would make us suggest selling/hedging the long-term investments, but that is not the case right now.
The medium-term trend in the gold stocks to gold ratio remains down, but we haven’t seen a breakdown below the previous 2013 lows, so the situation is not extremely bearish just yet.
Summing up, the outlook for the mining stocks is similar to the outlook for gold and silver – it remains bearish for the short and medium term. We can’t rule out a few days of strength, but it doesn’t seem that a rally would be sustainable development.
Letters from Subscribers
Q: I understand that JP Morgan has a very large “Short” on silver that’s been keeping the price down, away from the ratio of silver to gold which I believe is either 12 to 1, or 15 to 1, which would make silver $203-$210 dollars per ounce. It used to follow these ratio years ago and as a matter of fact, the Romans set the ratio in 460AD of Silver to Gold. If this is true information about JP Morgan they stand to make a fortune when our economy wakes up from this dream and realizes how broke every country really is…not even counting the QE being pumped into the system every day! Wait until that money stops being printed, fixed income and the dollar is going to fall at the rate of gravity…32 feet per second per second!! Panic sellers will all be going back into the metals and the big boys have already pulled out and are prepared for the market crash.
A: The possibility or even likelihood of a major impact that entities such as JP Morgan can have on the silver market is not what's behind each and every price move - there are also other factors. Yes, there is a visible impact on a short-term basis and actually our findings led us to create the True Seasonals tool that takes this impact into account.
The ratio is - as you stated - way above its historical averages and this factor alone makes the outlook for silver price bullish over the very long term. The massive money creation does indeed make the picture very bullish for silver (and gold) as it poses a long-term risk to the entire financial system.
Over the short and medium term, we can see some more weakness based on the markets' / investors' / traders' emotionality.
Q: Can you comment on the attempts to limit speculation in commodities?
A: In the past, we made several comments on similar news. For instance, in the June 21, 2013 Market Alert we wrote:
The CME has decided to increase margins for gold and platinum. The immediate question that you're probably asking yourself now is "wait, isn't that something that used to lead to declines in the past and that was something that we saw after gold actually rallied substantially?" The answer is yes. In fact, it's the thing that triggered the sell-off when silver moved close to $50 two years ago. Last time the margins were raised was on April 16, 2013, right after the big drop.
(…)
Why did they do it this time? Officially - to lower the volatility, again. Higher margins mean that speculation is less attractive as the leverage decreases. Some might say that it shouldn't make a difference because the futures market is a zero-sum game meaning that for every long there is a short, so the overall effect will be null as well. However, the truth is that the markets need new buyers entering the market in order for the prices to keep rising. Without that, prices fall. Consequently, lower interest in a given market should be bearish for prices.
(…)
The most important implications are that the impact of a margin hike is indeed bearish for the short term (1 week - 1 month).
Consequently, we have a non-technical reason for which we can expect lower precious metals values shortly. We are already prepared for it, so it doesn't cause any changes in our suggestions for you.
The topic of margin hikes has been part of our research for some time now and we encourage you to read (or just examine the charts if you're short on time) our report on margin requirement changes for gold and silver.
The general implications remain as mentioned in the discussed Market Alert and report – an introduction of position limits might be considered similar to margin changes and bearish news for precious metals. For a more detailed description of the possible effects, please refer to the report.
Q. When you recommend shorting miners, what vehicle should one be using? I currently am using DUST but there is 3X leverage. The stockpicker only gives longs.
A. The DUST ETN is one of our preferred ways of shorting the mining stock sector, especially for less experienced traders. It's main advantage is the combination of leverage and the fact that it's easy to use - simply purchase shares of the ETN and that's it. More advanced traders might want to focus on options and futures and they offer additional advantages - the most important of which is the ability for traders to customize the leverage to better suit their needs - i.e. to bet exactly on what they are willing to bet on (for instance short-term options to bet on short-term price moves).
Speaking of different ways of purchasing / trading gold, please note that we have 2 section on our website that are dedicated to this issue: and the ETF / ETN Ranking. Both have separate rankings for traders and investors.
Summary
The biggest news this week was the confirmation of the breakout above the declining medium-term resistance line in the USD Index. It seems very probable that the next big move in the USD Index will be to the upside, even if we see a pause in the next few days. This makes the previously bearish outlook for the precious metals market even more bearish.
This week gold, silver, and mining stocks paused and the move up materialized on rather insignificant volume. This is a suggestion that this is just a correction/consolidation and not a beginning of another big move up. After examining the True Seasonal patterns for November, it seems that the pause was not a sign of strength, but a sign of weakness, as this is the time of the month, when mining stocks should be particularly strong – and all they managed to do was to pause and to move slightly higher on small volume.
The short and medium term trend seems to be down even though we can’t rule out a few days of (probably insignificant) strength. Still, at this time we don’t view the situation as bearish enough to justify hedging/selling one’s long-term precious metals investments.
Trading – PR: Short position in gold, silver and mining stocks.
Trading – SP Indicators: No positions: SP Indicators suggest long positions, but the new self-similarity-based tool suggests short ones for the precious metals sector. We think that overall they cancel each other out.
Long-term investments: A half position in gold, silver, platinum and mining stocks. As far as long-term mining stock selection is concerned, we suggest using our tools before making purchases: the Golden StockPicker and the Silver StockPicker
| Portfolio's Part | Position | Stop-loss / Expiry Date |
|---|---|---|
| Trading: Mining stocks | Short | HUI: 268, GDX: $28.60 |
| Trading: Gold | Short | $1,392 |
| Trading: Silver | Short | $23.90 |
| Long-term investments: Gold | Long - half | - |
| Long-term investments: Silver | Long - half | - |
| Long-term investments: Platinum | Long - half | - |
| Long-term investments: Mining Stocks | Long - half | - |
This completes this week’s Premium Update. Our next Premium Update is scheduled for Friday, Nov 15, 2013. We will continue to send out Market Alerts on a daily basis (except for when Premium Updates are posted) and we will send additional Market Alerts whenever appropriate.
Thank you for using the Premium Service
Sincerely
Przemyslaw Radomski, CFA

