
The crucial story for gold investors is not the pure inflation rate of the dollar, but something much deeper. When you focus on gold, you should sharpen the focus of your lens on the dollar system. As history confirms, gold can both increase and decrease under inflationary circumstances. It is also the case when considering the opposite scenario, which is deflation. It all depends on how well the dollar system is performing (how well is both dollar as a currency and dollar understood as dollar denominated assets; bonds, stocks, derivatives, credits etc.).
The easiest way to look at the dollar is to compare it as a currency against all the other currencies. This, in fact, was the best way to assess the dollar from 2002-3, when it started to lose its value against other currencies and gold began its long and spectacular upward climb. This took place while a bubble formed in dollar denominated assets, especially real estate.
In 2008 there was a radical shift. Shortage of liquidity in the financial markets lead to massive selloffs of assets in all markets, with emerging markets being hit the most. That’s when the dollar got a gust of air in its sails, and increased significantly in value. Under current circumstances, the dollar – as a currency – does not appear to look that bad. Even when compared to other strong currencies the dollar looks firm. The central bankers who print the British pound and the Japanese yen seem to be devaluation devotees and the euro is still recoiling from the turmoil of numerous internal problems.
Therefore, when looking purely at the currency markets, the dollar does not appear as endangered as it may seem. However, as we hinted at the beginning, this is not the whole story. We have to assess not only the dollar against other currencies, but the entire dollar system, that is dollar denominated assets. The dollar may be a better investment than the British pound, but the big question is whether gold may be an even better investment than the dollar even when it outperforms the pound.
So how is the dollar system performing internally? One of many possible things to focus on is the interventionist policy of the government, especially the central bank. This can tell us how firmly the economy stands.
In the recent years we witnessed tremendous expansion in the Fed’s activity. Since it all comes down to money creation (supplied for financial papers and bonds), this influence is rather negative for the whole dollar system. This means that the economy is not "strong on its own". It means that the growth that we saw is rather artificial. This means that from the economic point of view, the outlook for gold is quite favorable for the coming years. The above is a part of the October Market Overview report.
Is it favorable also for the coming days and weeks? Let’s take a look at charts (charts courtesy by http://stockcharts.com) and find out. As we usually do, we’ll start with the USD Index.
USD Index
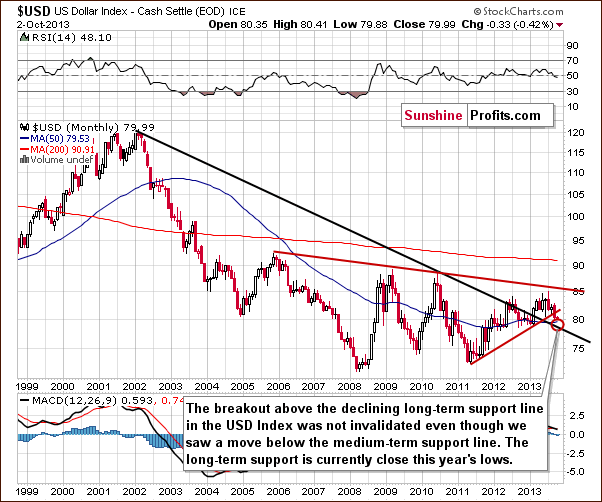
The situation in the long-term chart hasn’t changed much recently and all of what we wrote in our previous Premium Update is still up-to-date today.
The long-term breakout above the declining long-term support line was not invalidated. (…) However, since the medium-term breakdown (below the support line marked with red) is visible also from this perspective, we could see some short-term weakness anyway. It seems that the long-term support line will stop the decline – that is, if the USD Index gets that low. Therefore, from the long-term perspective, it seems that the downside is still quite limited.
Now, let’s examine the weekly chart.
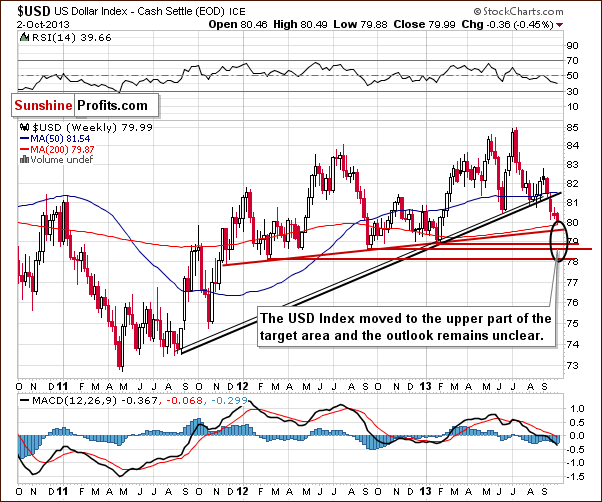
On the above chart, we see that the USD Index reached the upper edge of the target area (marked with a black ellipse), so the bottom might be in. However, the situation is unclear, because even if the dollar moves three index points lower, it still will be in the target area.
The breakdown below the rising, medium-term support line is still not confirmed (weekly closing price this week will confirm the breakdown if it is seen below the rising support line), but it seems likely that it will be confirmed. The above will then make the picture more bearish. However, as you can see on the short-term chart, it’s not that important from the precious metals investors’ point of view.
Let’s check the short-term outlook.
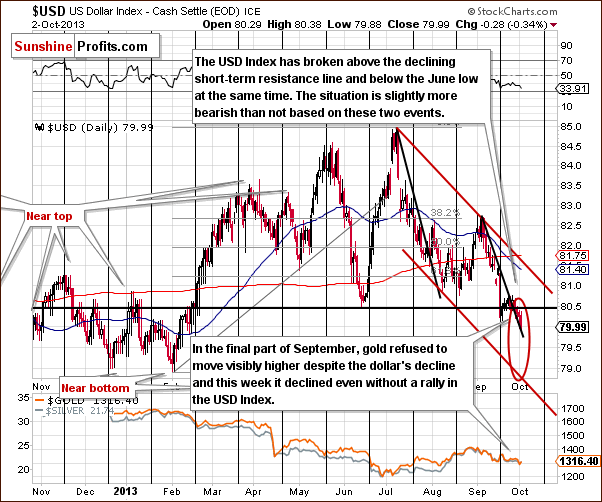
Before moving to the main point, let’s focus on a different interesting situation. At the same time, the USD Index has broken above the short-term declining resistance line and below the June low. In our opinion, the breakdown below the June low is more important, because it is of a more long-term nature. When two technical factors are in conflict, the stronger – more long-term / more significant one – usually prevails.
As mentioned earlier, it is not the most important thing that we can see on the daily chart. The most important thing is gold’s clear underperformance compared to the USD Index, something that used to herald declines on the precious metal market in the past months.
If we compare the dollar’s performance and gold’s in the last few weeks, we will see that gold has been underperforming the USD Index more and more significantly. In the final part of September, gold didn’t move visibly higher even though the USD Index started to decline, and this was proved this week on Tuesday when gold plunged without any signal from the dollar. Gold corrected on Wednesday, and so did the USD Index, but overall, both declined in the past 2 days.
Again, this underperformance is the key thing to keep in mind at this time because it means the lack of clarity of the USD Index is not so important. Gold can decline even without a signal (namely: without a rally) from the US Dollar Index.
Summing up, the situation on the USD Index is unclear, but it is not so important, because it seems that gold can decline even without the dollar’s rally.
General Stock Market
When we described the situation in the USD Index, we emphasized gold’s underperformance relative to the dollar; however, it is not the only thing that gold was underperforming. The yellow metal has been weak also relative to the general stock market.
This is not the only similarity between the general stock market and the US Dollar Index. The second similar thing is the lack of clarity as far as the outlook for the next few weeks is considered.
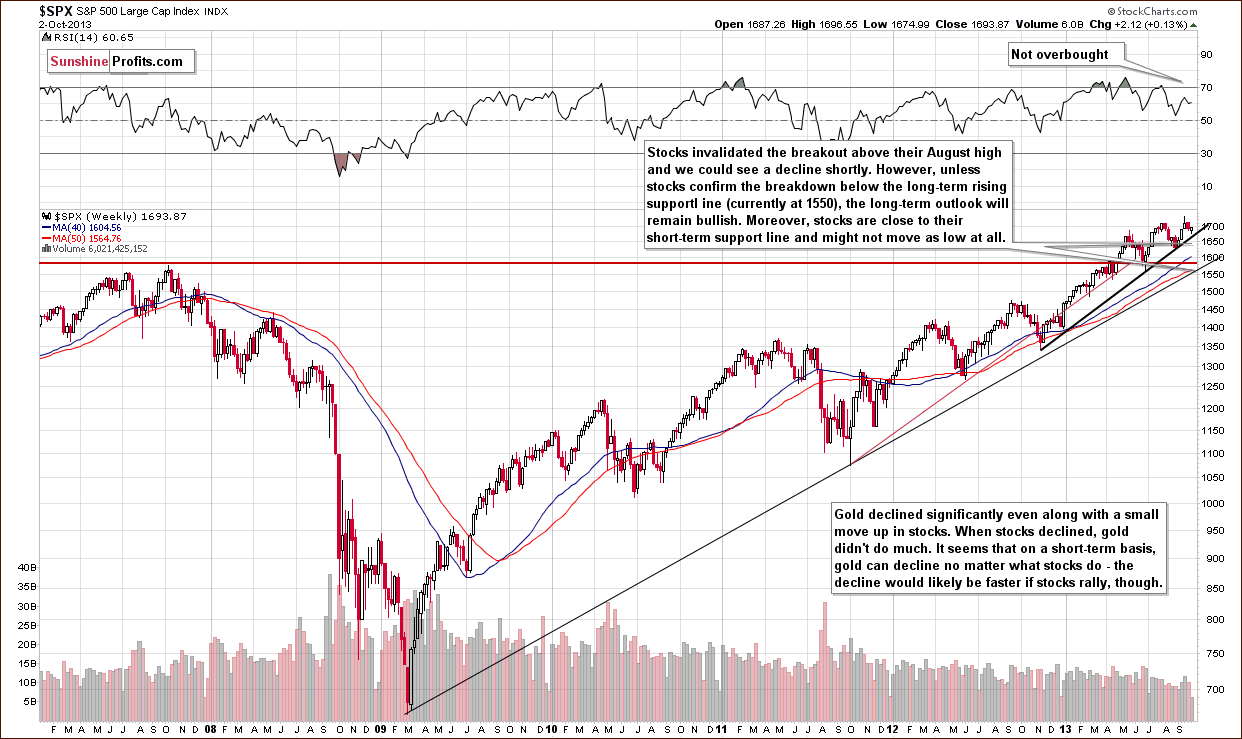
As we see on the above chart, stocks moved close to their short-term support line, which might be enough to stop the decline. On the other hand, we had an invalidation of the breakout above the previous high, so further declines are also possible.
Since gold has been underperforming the general stock market, it seems that the yellow metal could decline no matter what stocks do in the short term. We can see this in the Correlation Matrix, so let’s jump right to it.
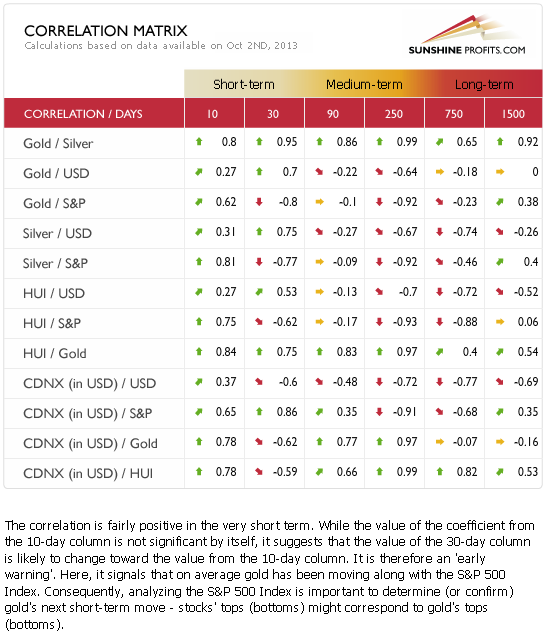
This week when analyzing the Correlation Matrix, we would like you to focus on the very short-term column. Correlation coefficients from the 10-day column are not significant by themselves, because 10 days is not enough data for the coefficients to be statistically reliable. We provide them because they are good at indicating in which way the 30-day short-term column will likely change.
Please take a look at the value from the 10-day column in the case of gold and the S&P500. It is positive, which means that taking only the last two weeks into account, these two markets moved – to a reasonable extent – in tune with each other. This is even more visible in case of silver and mining stocks.
What’s particularly interesting about the above is that it was during the same 2 weeks when stocks declined. Consequently, perhaps it is not that gold is not reacting to what the stock market is doing (note that the 30-day column shows negative values, which means that gold “should” have rallied along with declining stocks), but it’s not reacting to stocks’ declines. This is yet another sign of weakness on the precious metals market and a bearish indication.
Summing up, although the next few weeks for the general stock market seem unclear, it doesn’t change the outlook for the precious metals sector, which was already bearish on a medium-term basis. In fact, since gold responds negatively to stocks’ rallies, and it doesn’t respond to stocks' declines, then we simply have another bearish confirmation and a sign of weakness in the gold market.
Gold
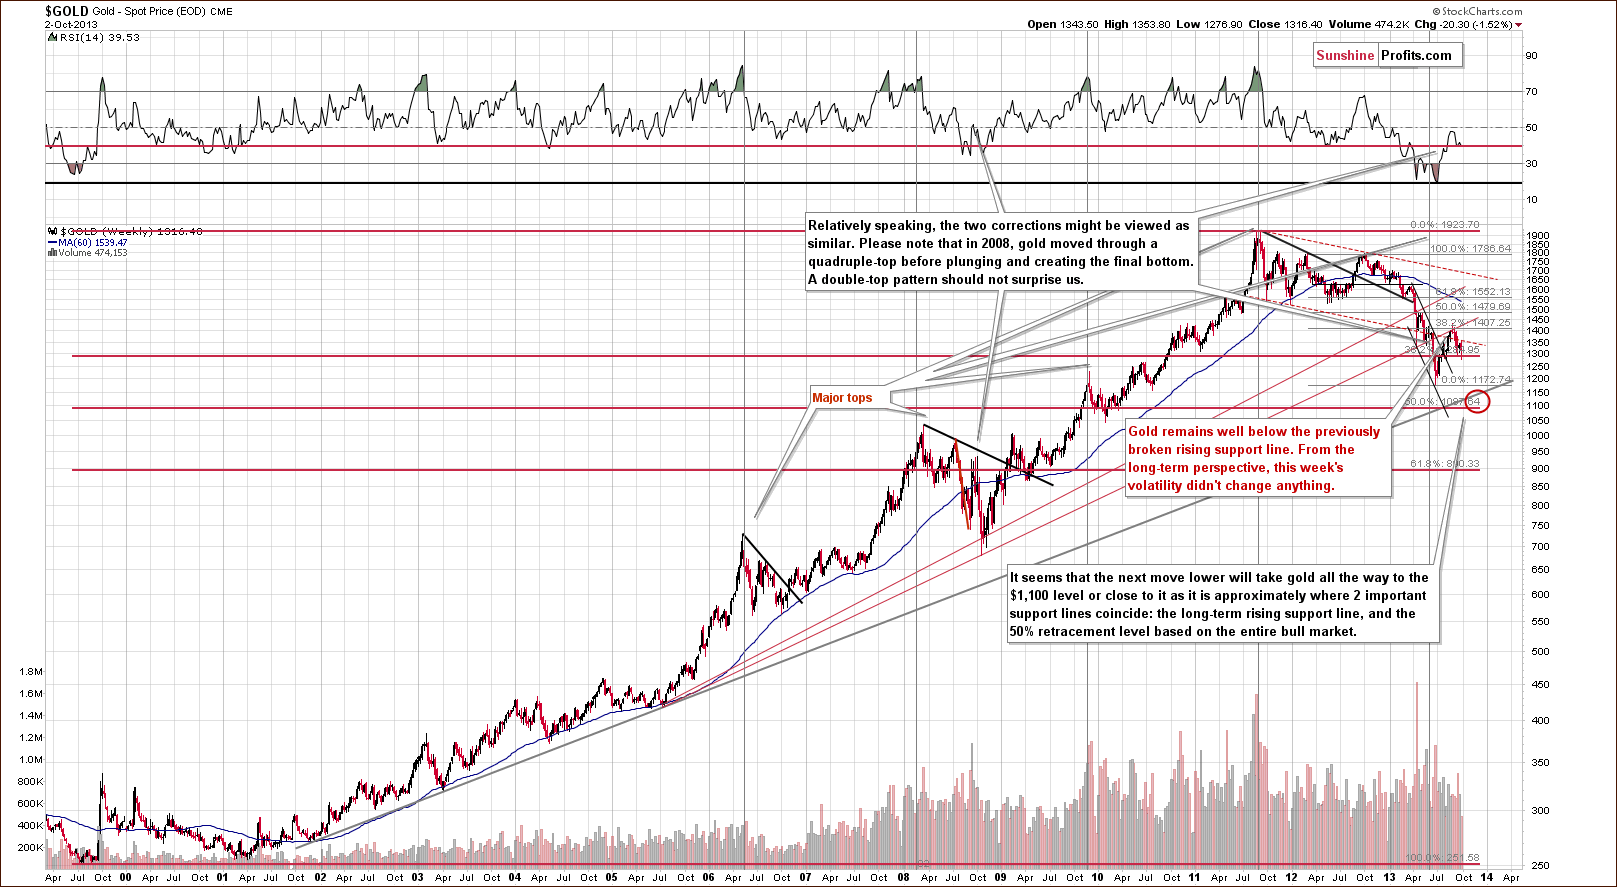
On the long-term gold chart, we see that the situation hasn’t changed much in the past week.
From this perspective, this week’s significant (on a day-to-day basis) price moves didn’t change anything. There was no long-term breakout nor breakdown and gold remains above the 38.2% Fibonacci retracement level based on the entire bull market.
Please note that the breakdown below the rising long-term support line is the thing that we should be focusing on when estimating the medium-term trends – it seems to us that it’s more important than the above-mentioned retracement (subjective judgment based on our experience). The breakdown below this level is clear and it was verified. You can also see the same from other perspectives.
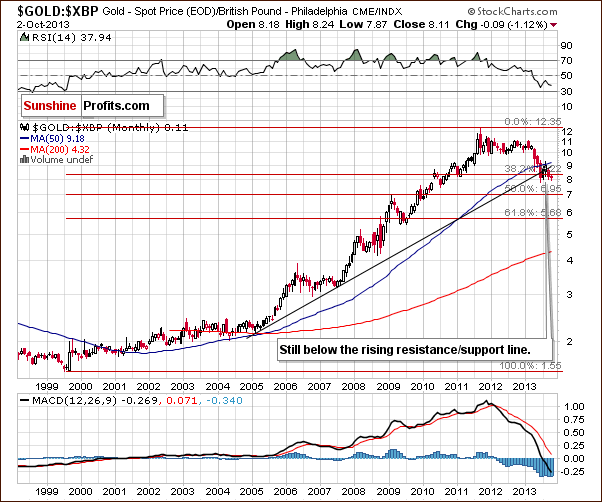
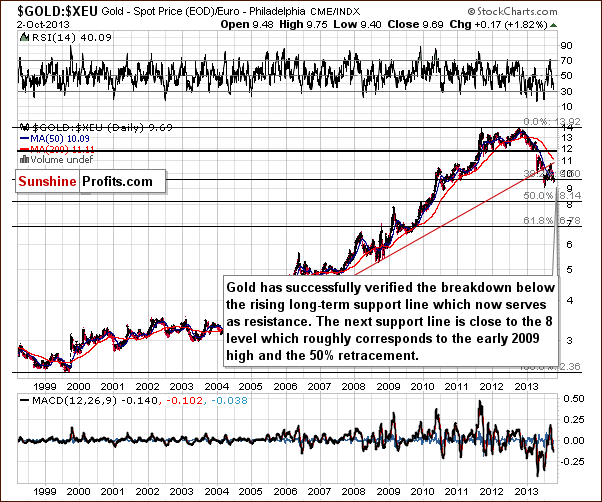
From both the British pound and euro perspectives we see a continuation of the downtrend after the verification of the major breakdown and a sizable correction. Both charts emphasize that the medium-term trend is down.
Now, let’s move on to the chart of gold priced in Australian dollars – it looks a bit different from the previous ones.
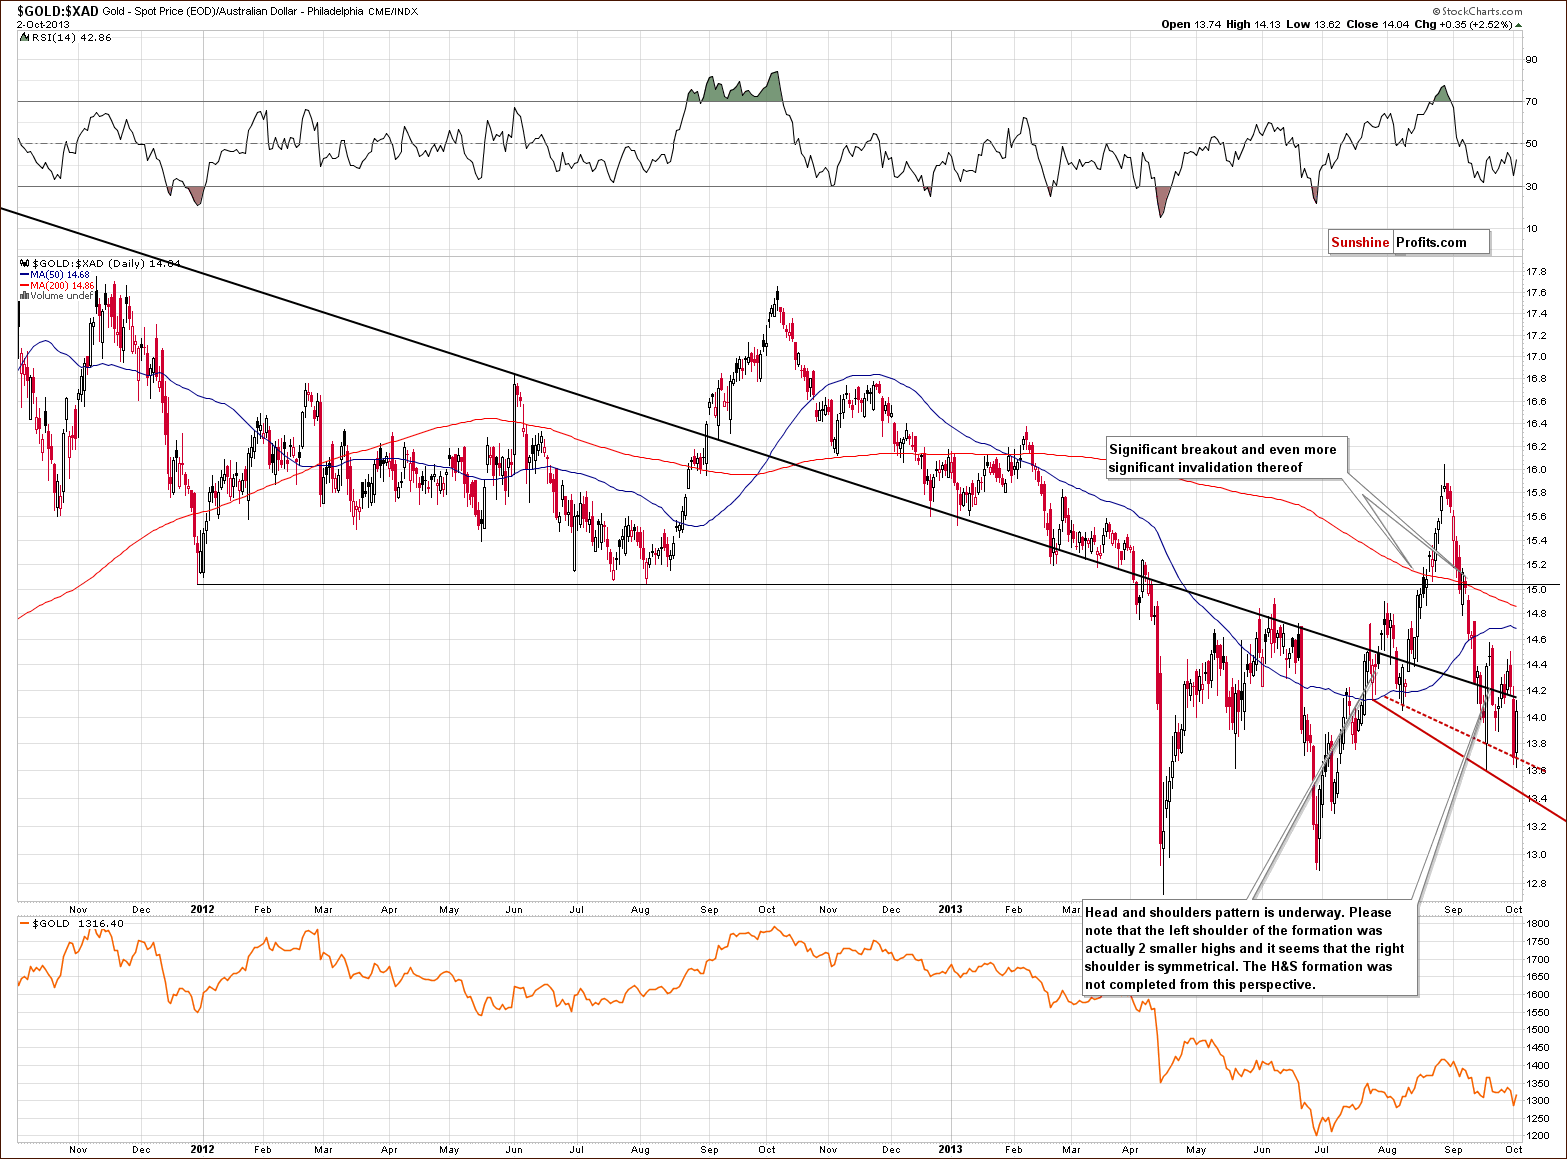
Quoting our previous Premium Update:
(…) there is a bearish head and shoulders formation underway, which may result in further declines in the near future. In this case, we could see a strong corrective move, one which would likely push gold’s price all the way back down to the April bottom area. Actually, we could even see a move below the April lows, because gold seen from this perspective is actually no longer strong versus gold priced in the US dollar.
As we can see on the above chart, the head and shoulders pattern was not completed yet. Consequently, there are no bearish implications based on it. However, gold priced in Australian dollars moved below the long-term declining support/resistance line (marked with black on the above chart). Therefore, from this perspective, the situation has deteriorated.
Let’s take a look at the chart featuring gold’s price from the non-USD perspective – a rough approximation of the average from the 3 previous charts.
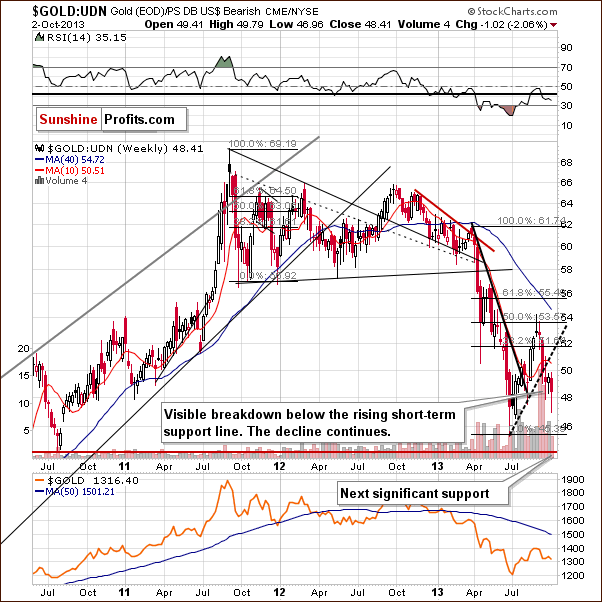
On the non-USD gold chart, we see that the situation has deteriorated slightly in recent days, and the breakdown below the rising support/resistance line based on the June and August bottoms is now even more than confirmed.
Therefore, from this perspective, the implications are clearly bearish for the medium term and – more importantly – they will stay bearish even if we see an additional small rally in the coming days/weeks.
And what happened on the gold market from the medium-term perspective? Let’s take a look at the chart below to see more details.
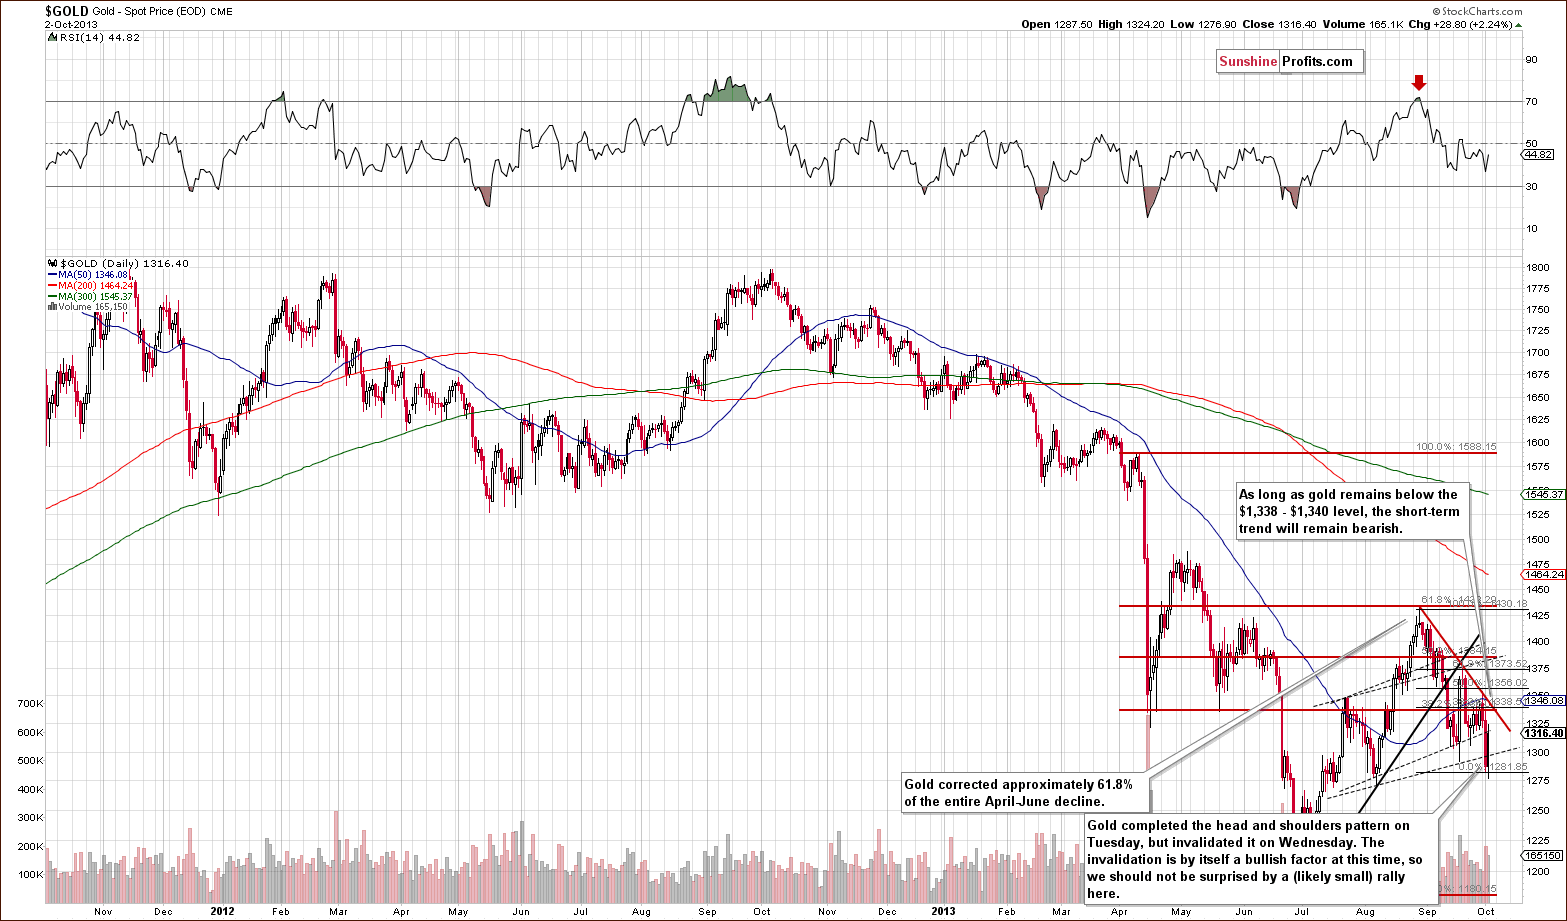
On the above chart, we see that two important things happened this week.
The first is the completion of the head and shoulders pattern and the breakdown below the neck level. The second thing is the invalidation of this breakdown. The invalidation by itself is a bullish signal, so further strength in the short term should not surprise us.
Please note that there is a short-term declining resistance line based on the August and the September 19 highs, which intersects with the 38.2% Fibonacci retracement level based on the August-October decline and serves as resistance. If this resistance is broken and we see a breakout, we could also see another significant rally, perhaps above the $1,400 level. However, please remember that this is just a possibility, because this time, the medium- and short-term trends remain down.
Summing up, the medium-term outlook for gold remains bearish and the downward trend is not threatened at the moment, even though we could see some strength on a short-term basis. The latter might provide us with another opportunity to enter short positions (traders should generally focus on trades that are in tune with the more important trend – and in this case the medium-term trend is down).
Silver
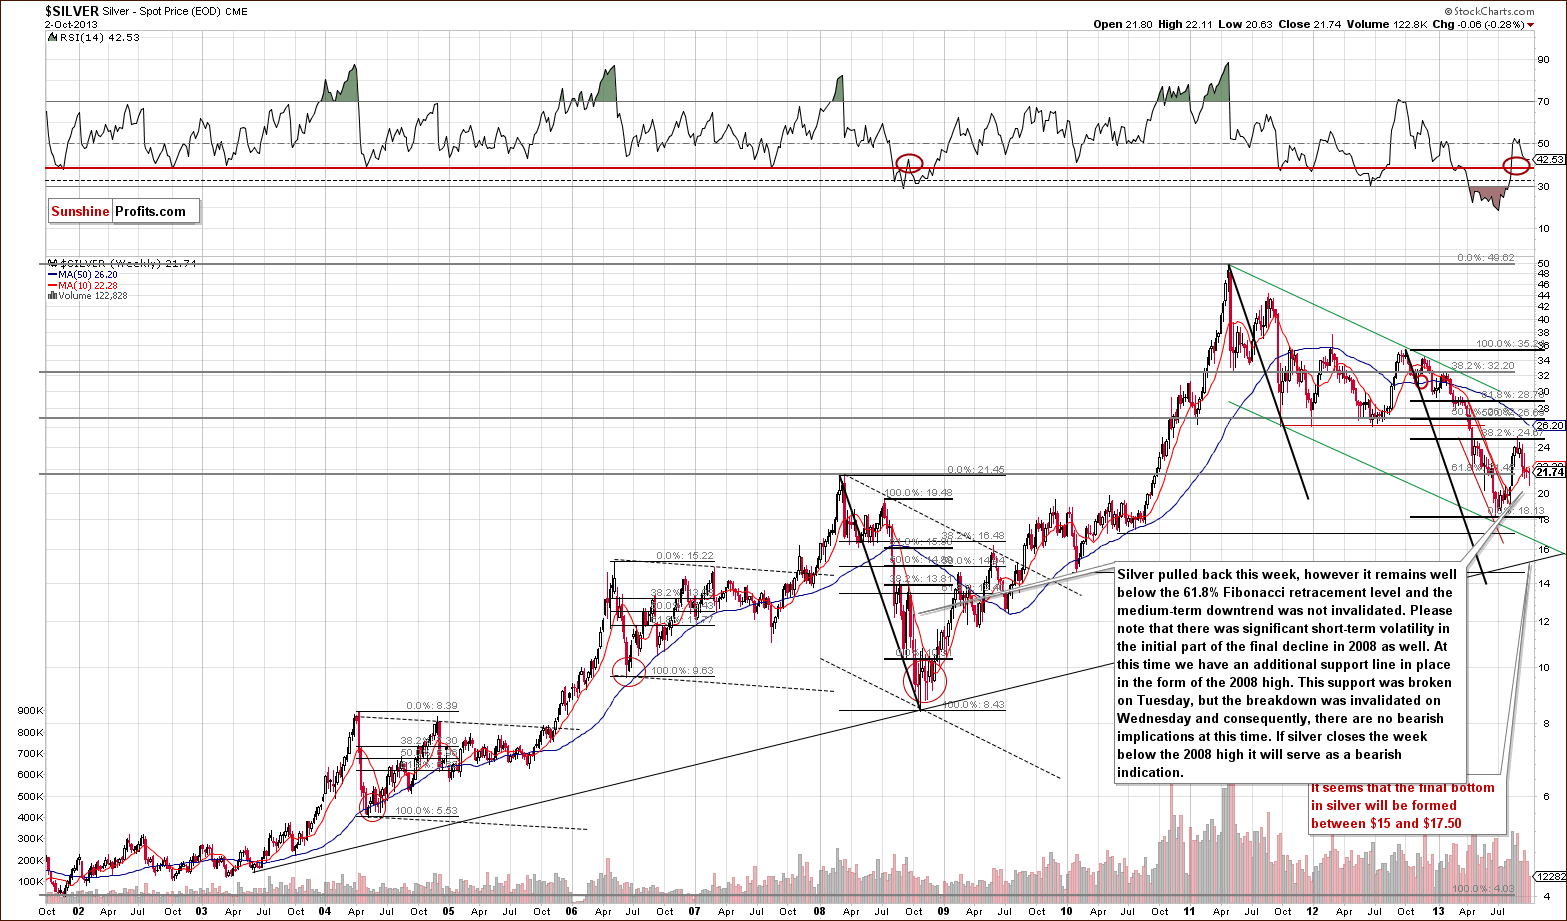
Although, a lot happened this week, really not much changed, as silver remains above the 2008 high. It will be important to check where silver closes this week. At this time, it is unclear whether we saw a true move below this important support level (and Wednesday’s rally was a correction) or was it just a temporary price slide? If so, we probably shouldn’t view Tuesday’s decline below this level as significant.
Please note that the 2008 high corresponds to the 61.8% Fibonacci retracement level based on the entire bull market, which makes this level particularly important.
Now, let’s move to the short-term chart to see the recent price moves more clearly.
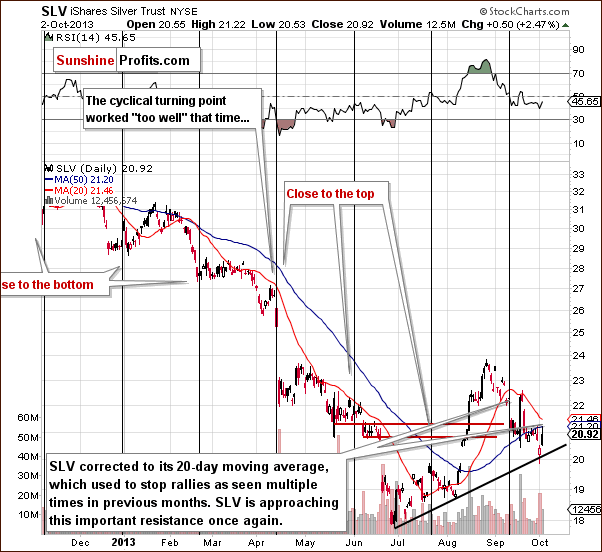
On the above chart, we see that silver moved close to the short-term rising support line (based on the June and the August lows) and bounced after reaching it. However, it has now moved quite close to its 20-day moving average, which has been seen stopping rallies multiple times in previous months.
Taking this fact into account, it seems that it will likely stop this short-term upward move once again. Similar to what we have seen on the gold market, if we see a breakout above this resistance line, we could see a more powerful upswing even to the August highs. Again, as is the case with the gold market, that’s just a possibility, not something that is probable at this time since there has been no breakout just yet.
We would like to remind you about an important long-term factor, which is likely to affect the precious metal market in the coming months.
As we wrote in our Premium Update on September 4:
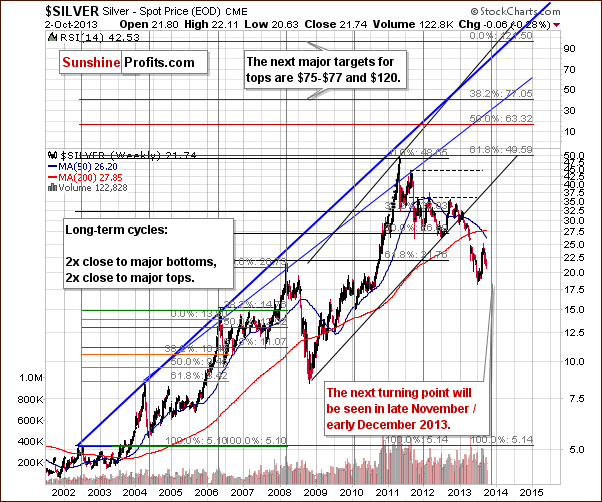
(...) There were two major bottoms and two major tops in the case of this major, long-term cycle. As you can see on the above chart, the next cyclical turning point will be seen in late November or early December this year. This may be where the next major bottom in silver materializes.
Since the entire precious metal sector tends to move together during major price swings, the above has bearish implications for gold and mining stocks in the medium term.
Please note that we saw extreme volatility right before the long-term cyclical turning point in all previous cases. Therefore, it’s quite likely that silver will be volatile soon.
Summing up, the outlook for the white metal remains bearish for the medium term, though the short-term is rather unclear. Taking long-term cyclical turning points into account, we should be particularly prepared to enter new trading positions and/or adjust the long-term investment ones in the next several weeks and months.
Gold and Silver Mining Stocks
In this week’s very long-term HUI index chart (a proxy for the gold stocks), the situation hasn’t changed much during the past week.
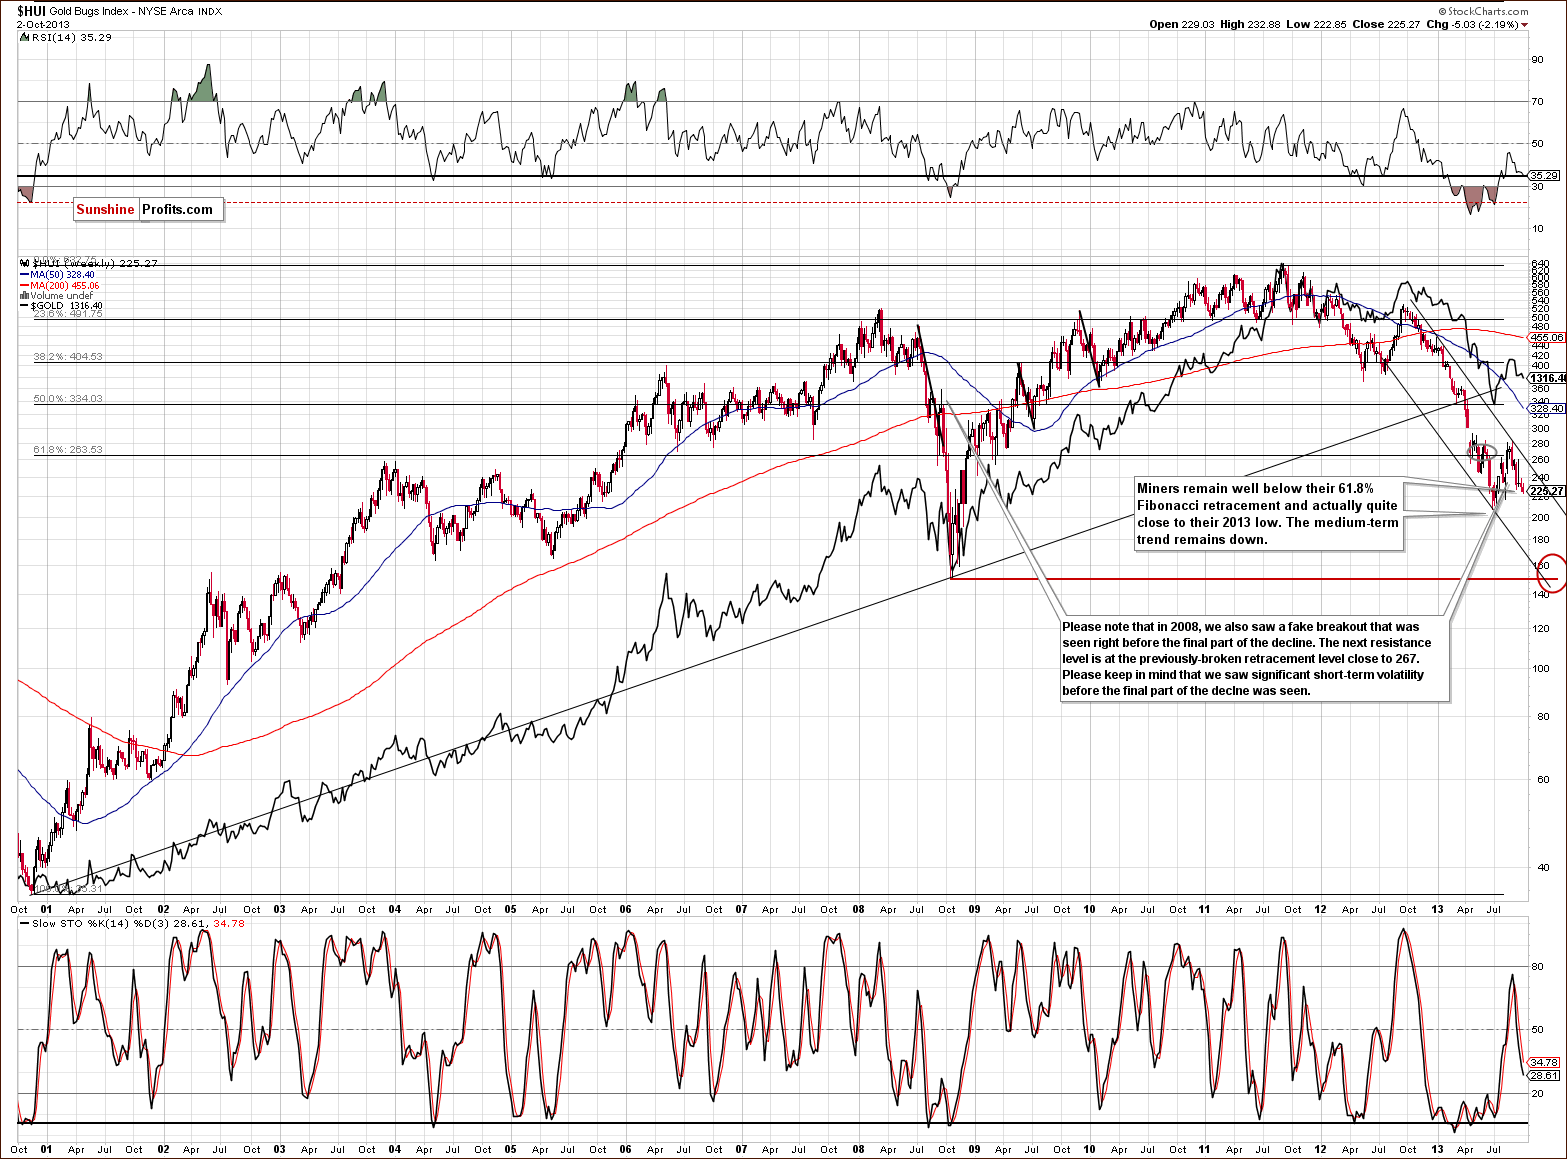
As you can see on the above chart, in the past weeks and months, there were several unsuccessful attempts to move above the 61.8% Fibonacci retracement level based on the entire bull market. The last attempt we saw in mid-September also failed, just like the previous ones. In this way, mining stocks returned to below the above-mentioned retracement level (at approximately 267), and still remain below it.
From today’s point of view, we clearly see that the situation hasn’t changed. From the long-term perspective, the implications are therefore bearish, and the trend remains down.
Please note that this year’s decline and the summer pullback were quite similar to what we saw in 2008. However, this time, both moves (the downswing and the upswing) simply took more time. Despite this fact, we still expect that the HUI Index will eventually move to 150 level or very close to it.
Let’s take a look at the juniors‘ performance.
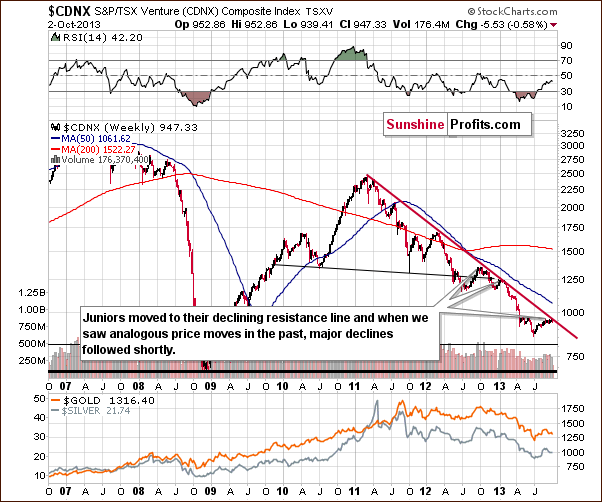
Looking at the above chart, we see that there was no breakout above the long-term declining resistance line this week. Therefore, the situation hasn’t changed and remains bearish.
As we wrote in our previous Premium Update:
(...) after several weeks of sideways trading, juniors moved to the declining resistance line based on the March 2011, March 2012 and January 2013 highs. It’s worth mentioning that in the past when we saw analogous price moves, they all resulted in major declines.
If we see similar price action here, it will probably lead to a continuation of the downward move – and this seems very likely.
Having said that, let’s move on to the gold stocks to gold ratio. Was there any improvement?
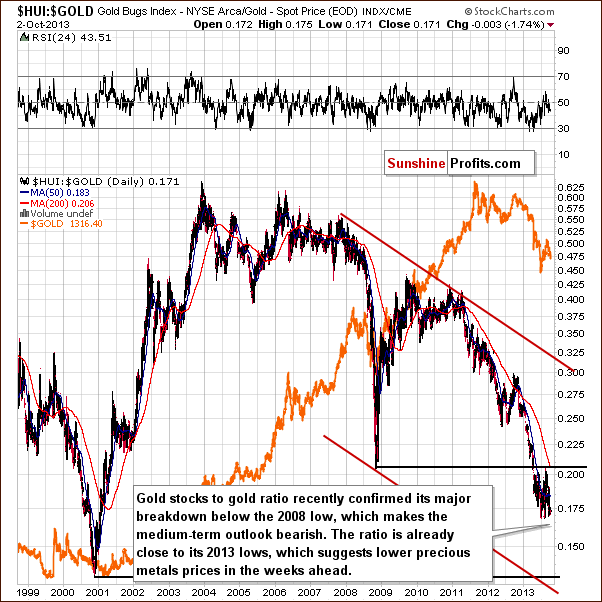
None at all. The breakdown below the ratio’s 2008 low was verified last month, and the trend is down. Gold stocks remain weak relative to gold, which is a bearish medium-term factor. The gold stocks to gold ratio is close to its 2013 lows, and it looks like it’s about to move even lower. The next strong support is at its late 2000 low – visibly below the current value.
Before we summarize, let’s examine the GDX ETF chart.
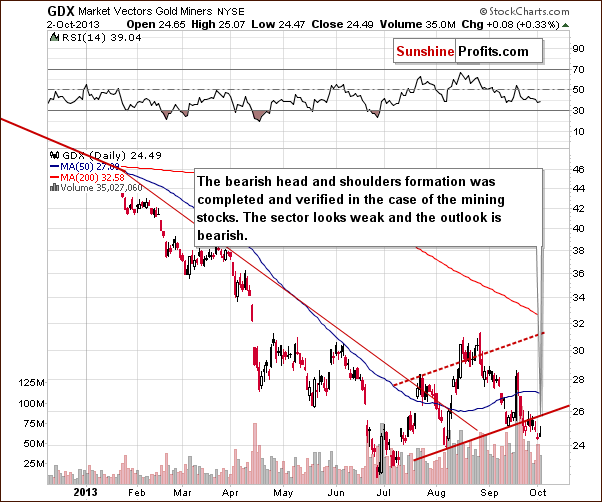
This is the most bearish chart that we have for you this week. From this perspective, the head and shoulders pattern was verified, and mining stocks would need to move much higher to invalidate this formation. Miners’ underperformance relative to gold (which we can see based on how both markets performed after the H&S formation was completed) is a bearish indication on its own. The medium-term trend remains down.
Summing up, the outlook for the mining stocks remains bearish, and the trend is still down. The long-term tendencies seem to be most important at this time, even for short-term price moves. Miners still remain below the 61.8% Fibonacci retracement level, and the head and shoulders pattern has already been verified. It looks like mining stocks will be our best shorting candidate quite soon.
Summary
The outlook for the USD Index and the general stock market is rather unclear as far as the next few weeks are concerned, but it doesn’t translate into an unclear outlook for the precious metals sector. The medium-term trend for gold, silver and mining stocks is down, and it seems that only the very short-term outlook is unclear.
There are short-term resistance levels in gold, silver and mining stocks, relatively close to where these sectors closed on Wednesday, so it seems that any additional rallies will be stopped relatively soon. If not – we might have an opportunity to go long before going short once again, which is even better, from a speculative point of view (an additional trade). “Might” because a long position now would be a bet against the medium-term trend, which makes it particularly risky, so we will need to take many factors into account before making such a suggestion.
The long-term cyclical turning points present on the silver market tell us that we are quite likely headed for some volatile times – we’ll keep our eyes open and report to you accordingly.
Trading – PR: No positions.
Trading – SP Indicators: No positions: SP Indicators suggest long positions, but the new self-similarity-based tool suggests short ones for the precious metals sector. We think that overall they cancel each other out.
Long-term investments: A half position in gold, silver, platinum and mining stocks. As far as long-term mining stock selection is concerned, we suggest using our tools before making purchases: the Golden StockPicker and the Silver StockPicker
| Portfolio's Part | Position | Stop-loss / Expiry Date |
|---|---|---|
| Trading: Mining stocks | No positions | - |
| Trading: Gold | No positions | - |
| Trading: Silver | No positions | - |
| Long-term investments: Gold | Long - half | - |
| Long-term investments: Silver | Long - half | - |
| Long-term investments: Platinum | Long - half | - |
| Long-term investments: Mining Stocks | Long - half | - |
This completes this week’s Premium Update. Our next Premium Update is scheduled for Friday, Oct 11, 2013. Please note that there will be most likely be no Market Alert tomorrow due to the annual meeting of the Sunshine Profits Team. If you have any comments, suggestions, requests regarding anything that we are doing, please let us know - that is the perfect time for it, as we will immediately discuss it in our meeting. We will continue to send out Market Alerts on a daily basis (except for when Premium Updates are posted and Oct 4) at least until the end of October, 2013, and we will send additional Market Alerts whenever appropriate.
Thank you for using the Premium Service.
Sincerely,
Przemyslaw Radomski, CFA

