
We ended the Friday’s Premium Update with the following paragraph:
Our next Premium Update is scheduled for April 25 (Thursday), 2013. This means that there will be no Premium Update next week and that the update in the following week will be posted a day ahead of the schedule. However, we will keep you updated on a daily basis anyway, through Market Alerts, and we will include replies to your questions in them (so that you don’t have to wait for the next update to get a reply) and charts, if necessary.
In today’s Market Alert, or Mid-week Update, we will provide charts and reply to some of the questions that we have received recently. The charts below (gold charts, silver charts and the self-similarity-tool screenshot) should put much of what we write / will write in the coming Market Alerts, into proper perspective.
Let’s start with gold (charts courtesy of stockcharts.com).
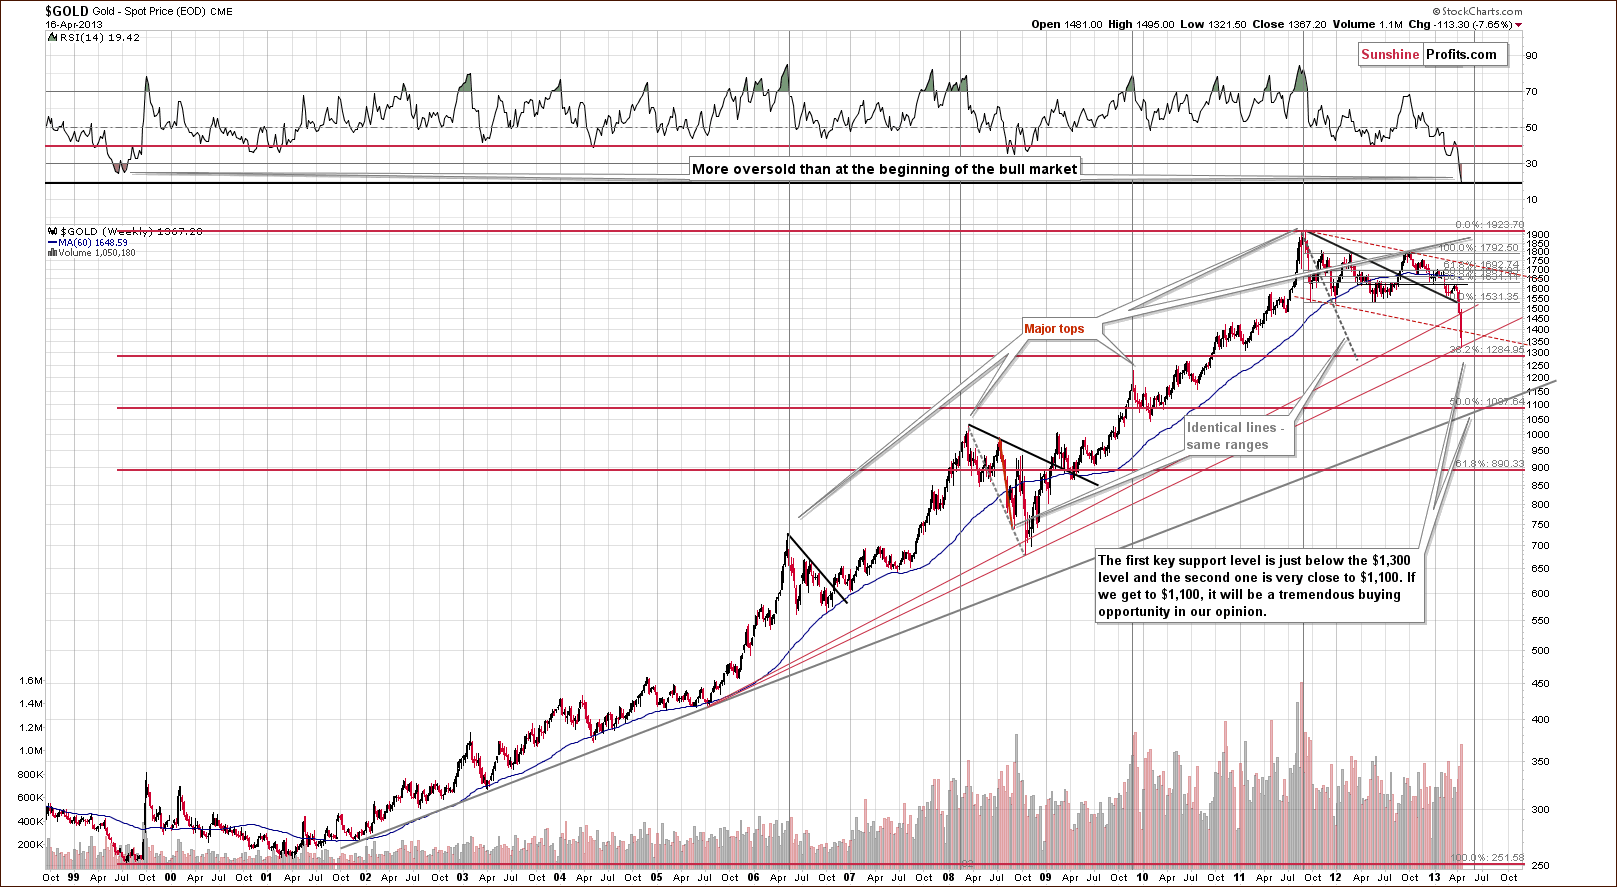
Gold has moved to the rising support line and it hasn’t moved to the first Fibonacci retracement level yet. It can – and likely will – do so, especially since the major cyclical turning point is still ahead – about a month from now.
More importantly, if this level is broken, the next support is at the $1,100 level. If we get to this level – especially quickly – we will quite likely suggest not only going long but also increasing the size of the position to 2 or more times the regular amount.
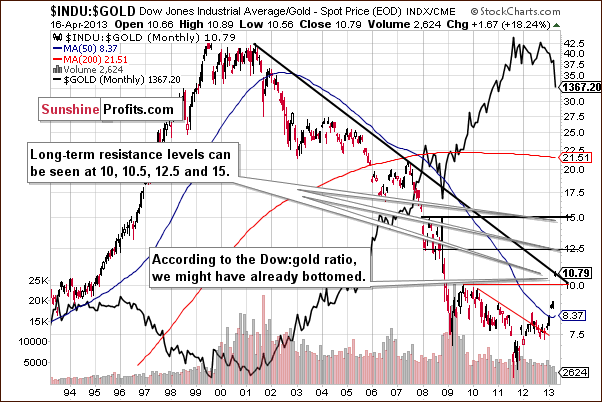
The Dow to gold ratio suggests that the bottom might be already in as the long-term resistance line has already been reached.
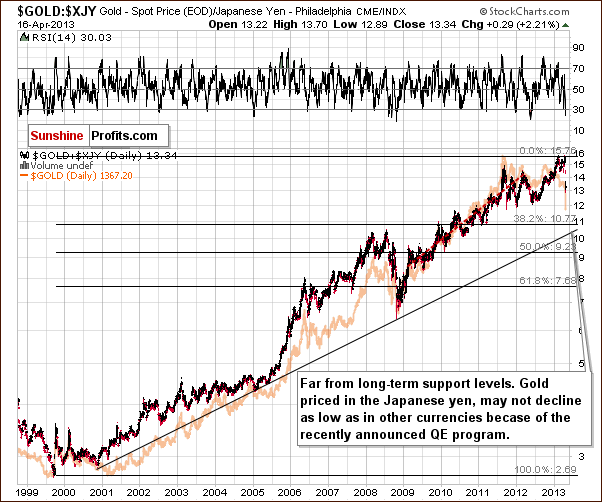
Gold priced in the Japanese yen doesn’t provide us with important clues. The price of gold is far from the key long-term support levels, and at the same time we realize that these levels may not be reached at all because of the recent quantitative easing.
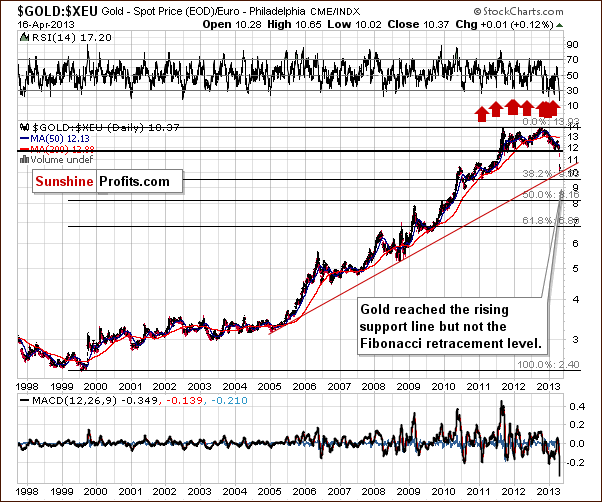
The chart of gold priced in the euro is similar to the one featuring gold in USD – we have seen a decline to the rising support line but not to the Fibonacci retracement level.
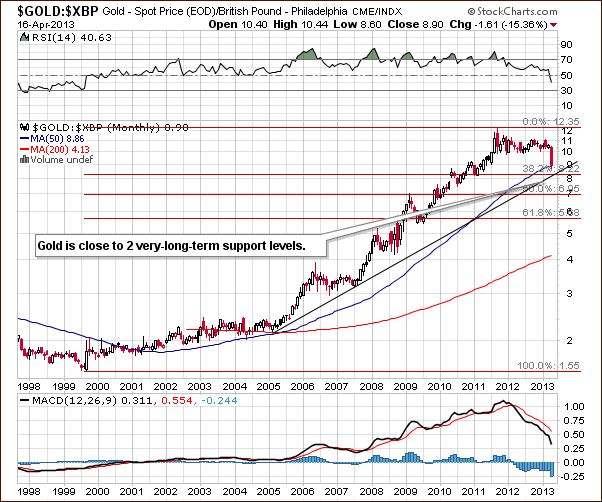
In case of gold priced in the British pound we have gold above both support levels, suggesting that it should move higher before the bottom is reached.
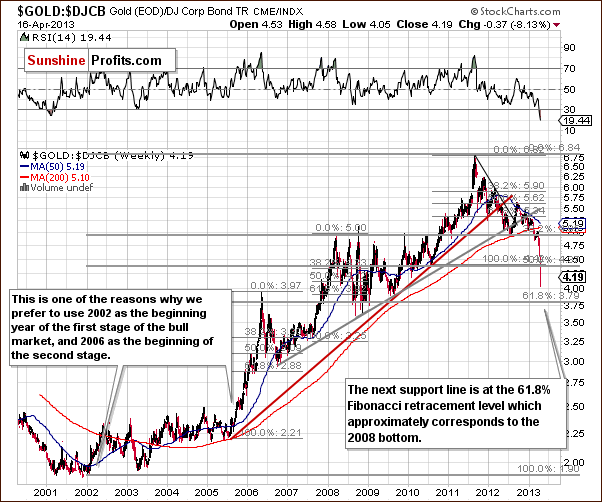
We have a different situation in the chart featuring the gold to bonds ratio, but the implications are as above. The support level is relatively close, but has not been reached so far and thus more declines can be seen shortly.
Finally, here’s the latest screenshot from our soon-to-be-released tool. It tells you two main things – that most of the decline is already behind us and that it’s most likely not over yet.
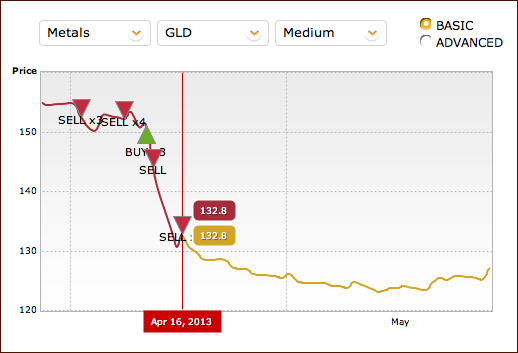
Yes, these are GLD ETF prices, not spot gold. You can get approximate spot gold values by multiplying GLD prices by 10.33.
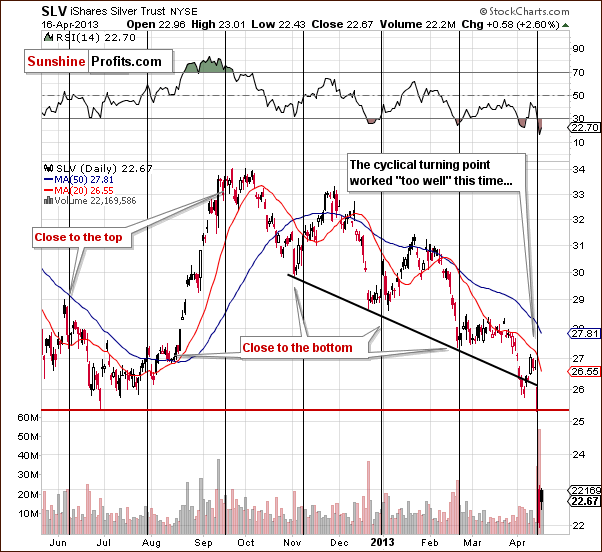
Let’s take a look at the silver market.
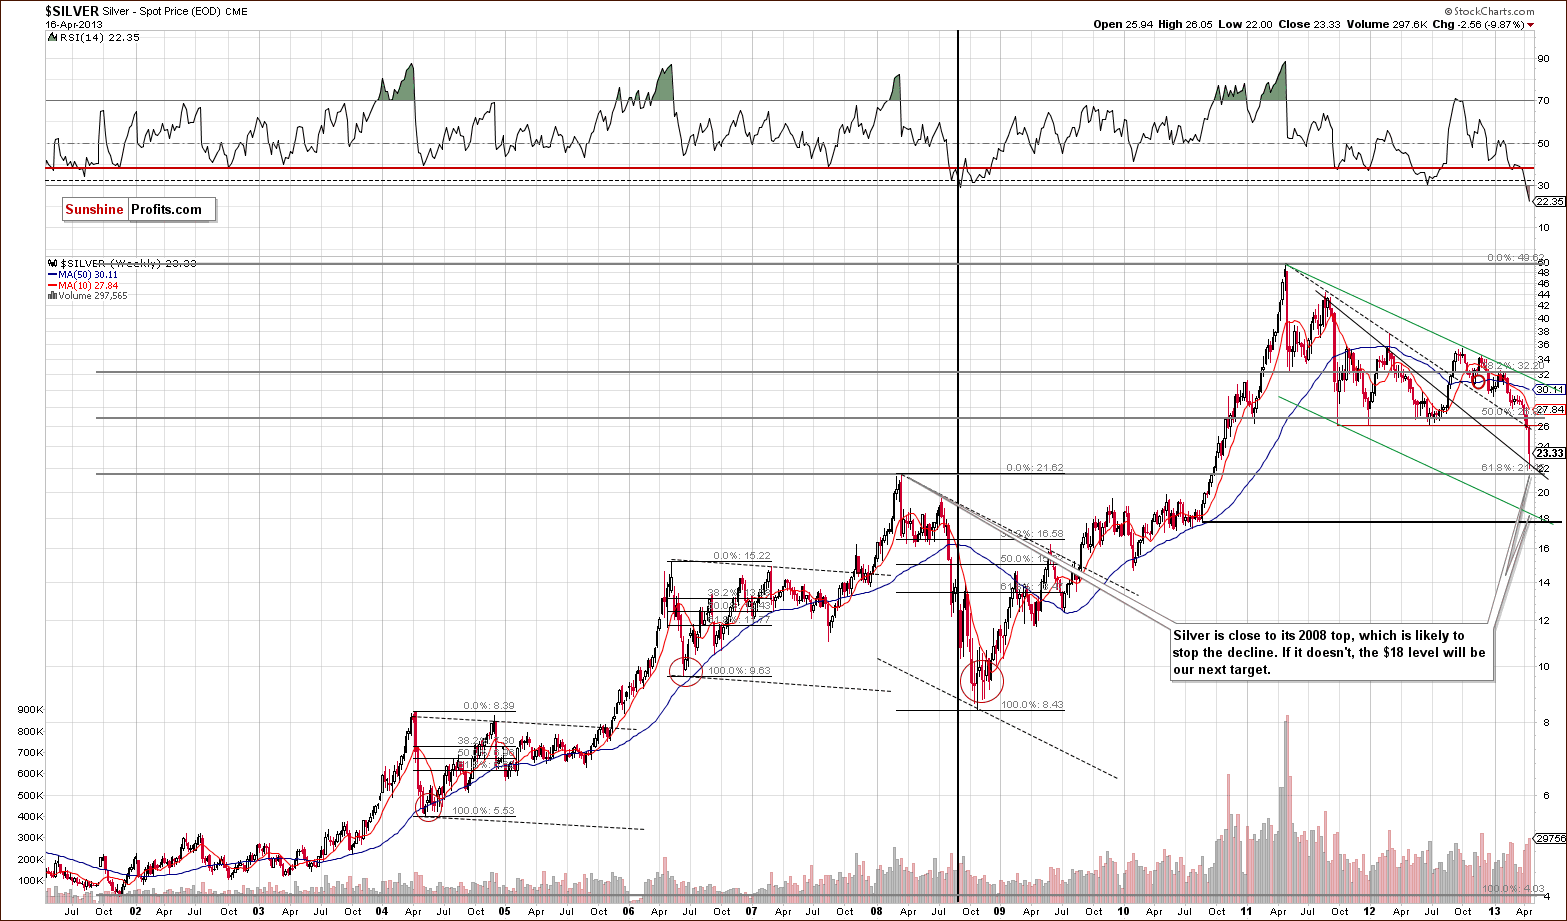
Generally, silver’s and gold’s situations are quite similar. Close to a major support but not yet at it. In case of silver, it’s the 2008 high that we expect to stop the current decline.
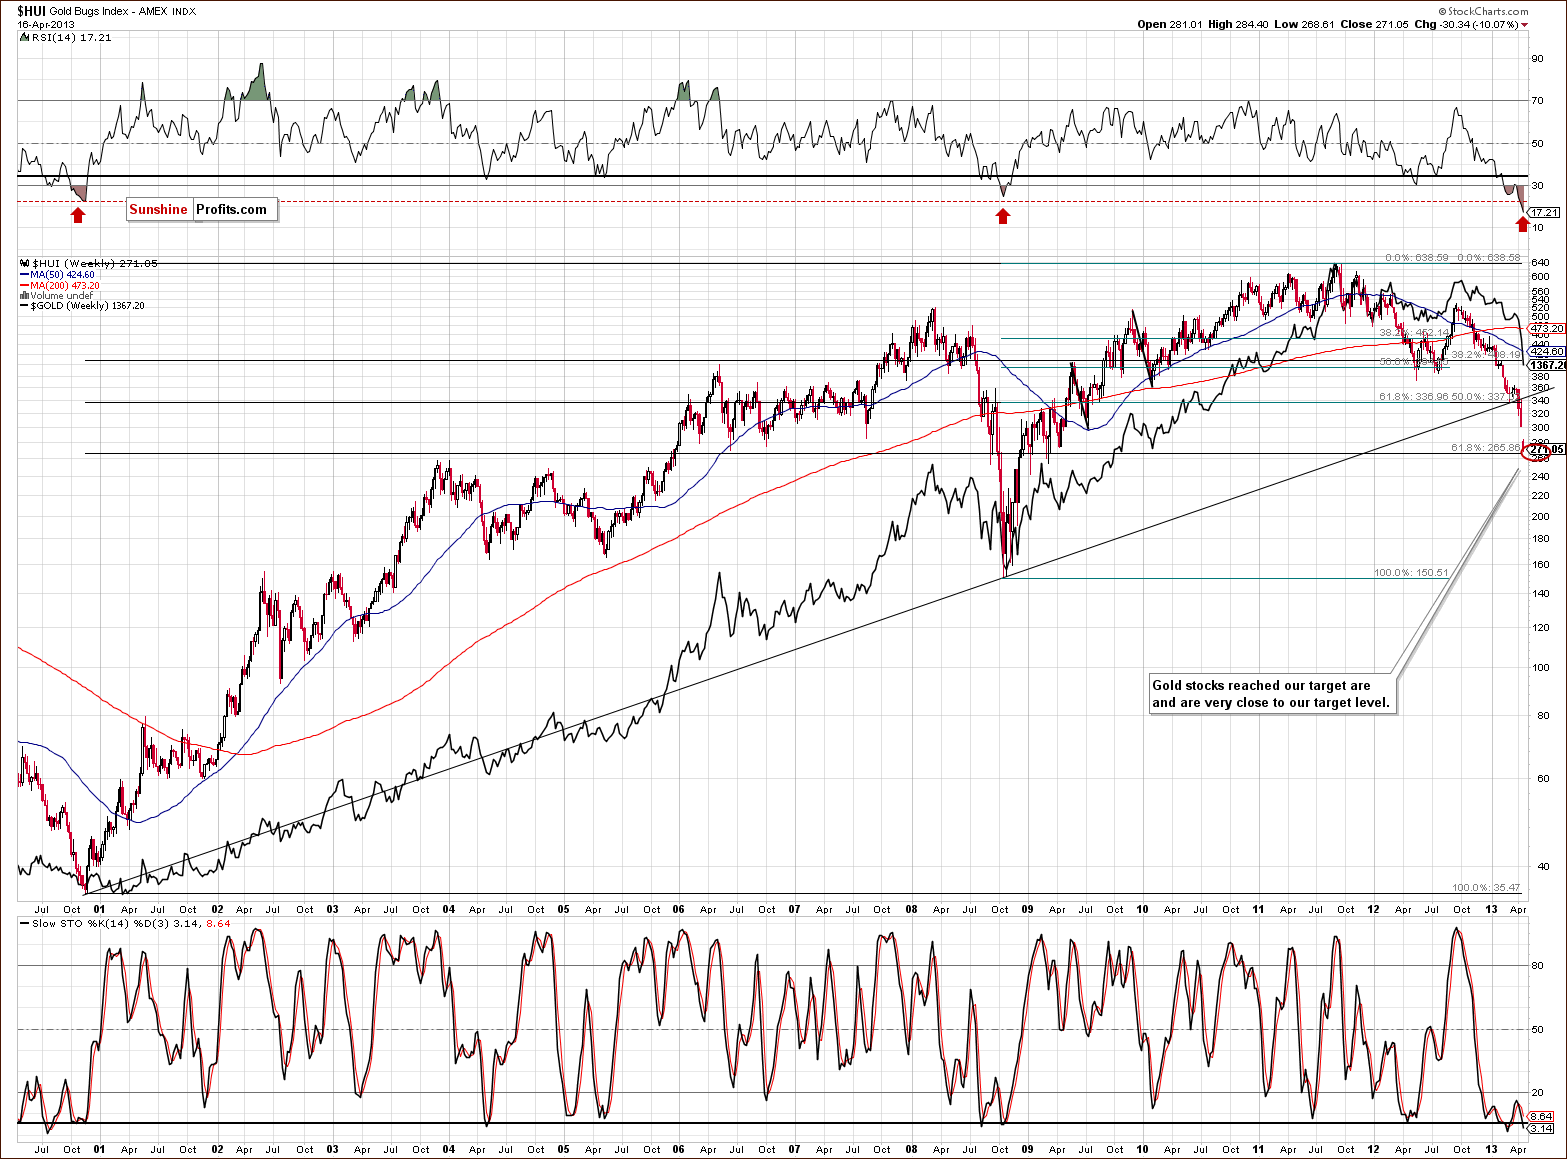
Gold stocks are almost right at their key support level, so we should be considering getting back on the long side of the market. And we are, however, if gold moves $100 lower, to dip slightly below $1,300, mining stock prices could tumble anyway. Please note that during Tuesday’s session miners declined even though gold and silver moved $15 and $0.67 higher, respectively. Miners’ underperformance is not a good sign and something that makes us expect further weakness in the short term.
Summing up, it seems that the precious metals market is close to the bottom, but hasn’t reached it yet.
Replies to questions – we have received many of them and have already answered some of them above (and below – in the table with stop-loss details). There are two more that we will reply to today and we will leave the rest for the following alerts/updates in order to publish this analysis in a timely manner.
Q: Hi, have about 15% in gold and silver coins for investment purposes. Please recommend what to do at this point. Worried that gold will fall towards the $1000 mark. Sell all or 1/2?
A: Is that you entire precious metals position? If so, then it's likely the "insurance" category (see our gold portfolio report for details) - and in this case we would wait it out instead of selling. In case of coins, it might take a while to sell them and the sale along with the buying them back (possibly quickly) might mean rather high transaction costs. In this case we would rather suggest selling only if gold moves below $1,280 and $1,100 becomes the likely target.
Q: What to do if 'in margin' and still considerable positions at 40000 Euro (goldbullion) a kilo and half at 33000 (fyscial). If I sould sell with considerable loss, then only there will be a chance to buy gold at a lower rate, but would this be a wise thing to do now? When already considerable loss, people would rather recommend to wait and 'sit it out'. What could 'sit it out' mean in terms of years? I also wonder if I should tell you this because of couorse... as long as I don't sell with considerable loss, I am not someone to buy soon from you. Unless you can give me the GOOD advbice to waot and sit it out which will probably turn me into a goldbug anyway... Wit having to take the loss I wonder if I would immediately buy again.. This would feel stupid and incompetent. Sell when low and buy when going higher again. Thanks for your advice, I am a woman alone and yes... co not have any property yet (just 'believed' in gold but manipulation unfortunately seems to be not underestimable)
A: It’s not investment advice (neither is the reply to the previous question), but our reply here is the same and for the same reasons. The additional reason is that based on what you wrote it seems that if you had to buy back at slightly higher prices, you would likely hesitate and wait for… even higher prices (we apologize for being so straightforward, but taking this into account could save you a lot of nerves and money). Consequently, it seems best for you to wait out the bottom around $1,300 and close the position only if gold goes below it – in order not to participate in the most of the decline to $1,100.
Trading – PR: Short gold, silver and mining stocks.
Trading – SP Indicators: No positions: SP Indicators suggest long positions but the new self-similarity-based tool suggests short ones so they cancel each other out.
Long-term investments: No positions.
Two days ago we suggested closing the speculative short position in silver if it moved to $22.10 and going long. Silver moved to $22, so the orders (closing short, opening long) should have been triggered. Since it doesn’t seem that the decline is completely over, we suggest closing this long position (silver is at $23.57 at the moment of writing these words) and opening a short position once again.
Here’s the up-to-date trading strategy:
1. When gold moves to $1,305 close the short speculative position in gold and open a long one.
2. When silver moves to $21.7 close the short speculative position in silver and open a long one.
3. (we don’t have a clear strategy for mining stocks yet, they are not reacting in tune with gold and silver and its unclear how low they can go temporarily if gold declines $100)
| Portfolio's Part | Position | Stop-loss / Expiry Date |
|---|---|---|
| Trading: Mining stocks | Short (half) | $291 |
| Trading: Gold | Short (half) | $1,422 |
| Trading: Silver | Short (half) | $24.2 |
| Long-term investments: Gold | No position | - |
| Long-term investments: Silver | No position | - |
| Long-term investments: Mining Stocks | No position | - |
Thank you.
Przemyslaw Radomski, CFA

