
- Euro & USD Indices
- General Stock Market
- Correlation Matrix
- Gold
- Silver
- Mining Stocks
- Letters from Subscribers
- Gold vs gold mining stocks performance
- What if the Dow and the S&P start correcting
- Bitcoin to gold ratio
- Gold stocks are one of the most hated sectors in the market
- Summary
The gold naysayers are still out there in droves, other than Lady Gaga who is ensconced after surgery in a custom-designed, 24-carat gold plated wheel chair.
There is no denying that gold is off to its worst yearly start in a quarter century and that just in February investors sold 106 metric tons of gold from gold ETFs. (Even so, this is just a small portion of the fund’s holding and gold has gone up since then, a bullish sign) The newspapers headlines are full of eulogies for the gold bull market saying it’s finished, washed up, over.
This sort of stuff gets us, contrarians, excited. The best time to buy into the gold market is when investors are at their most bearish.
Still, legendary investor George Soros reduced his stake in a gold ETF by 55 percent in the last quarter, but we don’t know if he has piled back in or not. Soros Fund Management LLC owned about $97 million of the yellow metal through the SPDR Gold Trust as of Dec. 31, according to regulatory filing. John Paulson, the largest SPDR investor, kept his gold holding valued at around $3.4 billion, unchanged last quarter, his filing showed.
Gold has underperformed so far this year. That is the unsavory truth. (We note that gold didn’t decline for all investors. Gold priced in yen rose 5.7 percent this year and in British pounds it advanced 4.1 percent due to the lower values of those two fiat currencies.)
With global stock markets at a four-year high and the dollar near its strongest in seven months, eight of 13 analysts surveyed by Bloomberg said they expect gold prices will be lower in 2014 than this year. The median estimate of the 13 analysts is for a record annual average of $1,700 in 2013, falling to $1,638 in 2014.
There seems to be a general sentiment that the world economy is improving. Many are speculating that the Fed is going to stop printing money after 2013 (through QE that is).
That’s nice. But things are not always what they seem. We don’t see reasons for this enthusiasm about economy recovery just yet. We don’t see an end to quantitative easing. The Fed is increasing its already large $3 trillion holdings of Treasury and mortgage securities by $85 billion a month. Bernanke has made it clear in his most recent testimony before Congress last month that he will not make any changes until unemployment rates fall to 6.5% or lower. He plans to hold short-term interest rates near zero and has no plans to increase rates.
We must keep in mind that Black Swans tend to glide into the global pond every so often. We hear reports of Korean military exercises and a report in a North Korean paper that its government has “nullified” a truce that goes back the end of the Korean War. The country’s leader says that the nation’s troops should be on “maximum alert.” What does all that mean? Who knows. That’s why we like to have gold in our portfolio. So do the central banks that have added 534.6 tons to reserves last year, the most since 1964, according to the World Gold Council. Barclays predicts 300 tons of buying in 2013 and the same in 2014. Lower prices and improving economies may increase the purchase of gold jewelry, the biggest source of demand, with the bank predicting a 3.2 percent gain this year, from an 8.2 percent drop in 2012.
The truth is that fundamentals since gold reached its apex a year and a half ago have not changed. Central banks around the world are accumulating more gold, and announcing much more quantitative easing than even before.
This week a high ranking Chinese official said that his country is likely to limit its gold holdings to 2 percent of its total foreign exchange reserves. The last time the People’s bank of China revealed its gold holdings was in 2009 when it owned to 1,054 metric tons, which is about 1.8 per cent of its total reserves.
“If the Chinese government were to buy too much gold, gold prices would surge, a scenario that will hurt Chinese consumers,” said the deputy Chinese central bank governor in a press briefing in Beijing. “We can only invest about 1-2 percent of the foreign exchange reserves into gold because the market is too small.”
If you were in their place and wanted to buy more gold, would you tell the world something like the above to keep the price lower while you buy, or would you say that you will buy a lot before the purchase thus pushing prices higher?
China imports about 500 to 600 tons of gold a year and mines about the same amount. How much of that gold goes to the Central Bank? We’ll find out when and if China next reveals its holdings and the statistics are reliably audited.
Meanwhile, let’s turn to the technical portion with analysis of the US Dollar Index. We will start with the short-term chart (charts courtesy by http://stockcharts.com.)
USD and Euro Indices
In Thursday’s Market Alert, we stated:
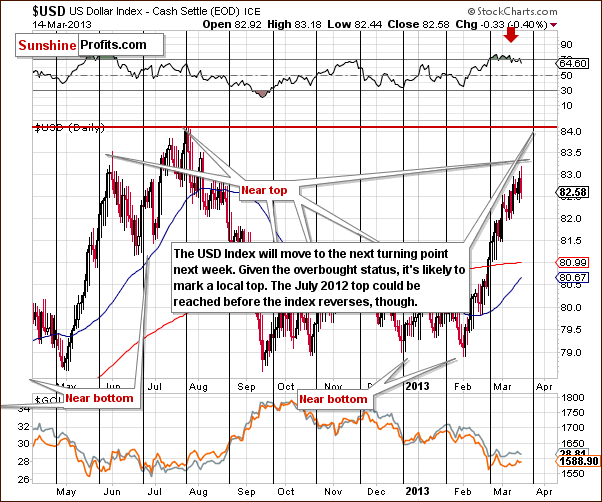
…let us remember that the July 2012 high was 84.10 and it was one of the major highs, so it's relatively important from the technical perspective. Given the current momentum and the fact that there is no significant short-term resistance level between this level and the current 83 level, we may see the dollar move up to this level before the top is seen.
If the recent pace of growth continues, the likely target level will be in the 83.18-84.10 range and with the cyclical turning point approaching next week, such a move could very well result in a local top. Of course, the cyclical turning point did not really work (for the USD that is) last time, but it is still a useful tool and will probably contribute to lower prices in the coming weeks. A rally right now could be seen before the reversal with the index possibly moving to the July 2012 top. In short, a small rally before the next local top would not be surprising here. It is not inevitable, either.
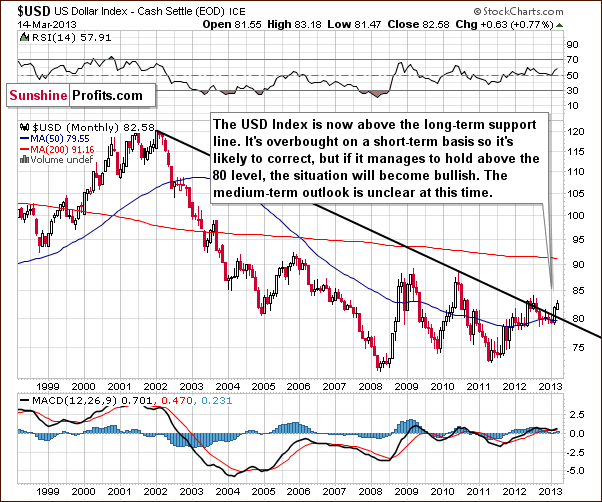
In the very long-term USD Index chart, we have seen the situation change somewhat this week. The breakout here is now quite significant, and we must consider the possibility that the USD Index might move higher in the medium term. The situation in the short term, however, is overbought, so it is likely that we will see the index decline soon and then we’ll see what happens next.
If the correction stops at the declining support line, around the 80 level, then the breakout will be confirmed, and a rally will likely follow. If however, the correction takes the index below the 80 level, the whole breakout will be invalided, and lower values would probably follow. At this time, the medium term and long-term outlooks are somewhat unclear based on this chart alone.
In the medium-term USD Index chart, comments in last week’s Premium Update remain up-to-date:
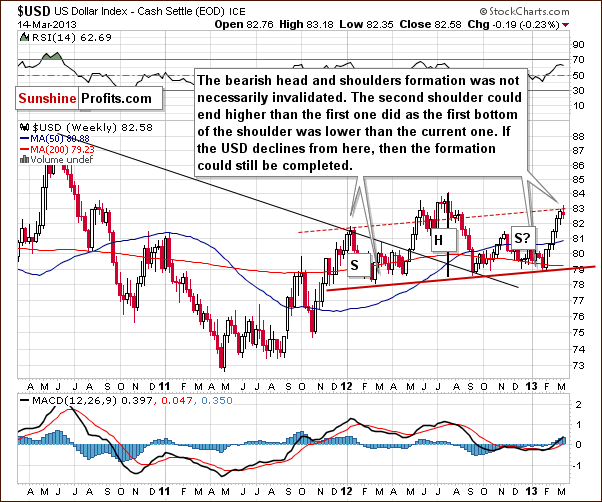
...the important thing to discuss here is the head-and-shoulders formation. This trading pattern has bearish implications for the USD Index and the question now is whether the formation is still present given the recent rally. We feel the answer is “yes”, because even though the index is now higher than the level of the left shoulder, the full formation is simply a bit skewed.
Local bottoms have been a bit higher each time so it is perhaps quite natural for the second shoulder to be above the first shoulder. Consequently, the formation could still be completed - though not yet - the other should has yet to form. Declines in the index are needed for this to happen, and we feel this could still be seen.
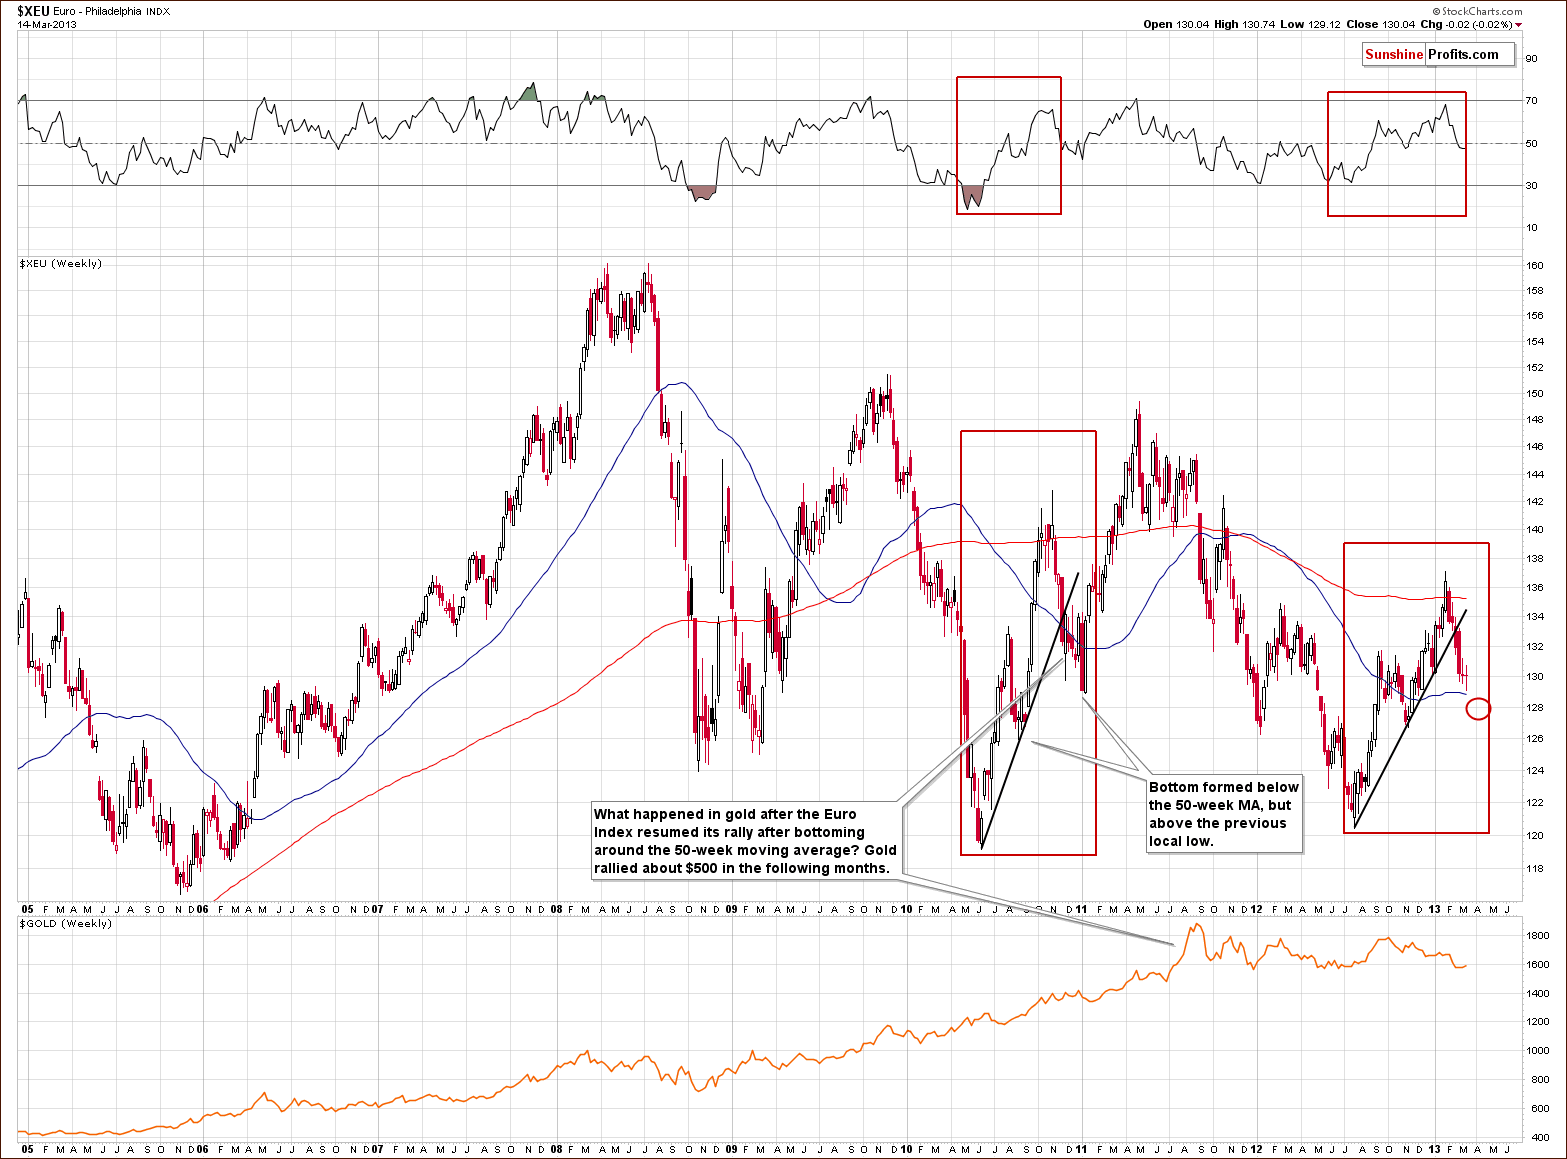
In the long-term Euro Index chart, we did some investigative work this week as we had a feeling that the corrective short-term price swings are probably something which we have seen before. Perhaps the breakdown here should not be trusted. This chart is a result of our long-term research on the Euro Index, and we found patterns similar to what we’ve seen over the past seven months back in late 2010 and early 2011. At that time, the euro rallied sharply, corrected just as sharply, and then continued to move higher. Before the move to the upside, it had broken below its short-term support line. A few weeks ago, we also saw this happen.
The 50-week and 200-week moving averages are currently positioned quite similar to how they were in the 2010-2011 comparison period. The bottom formed around the 50-week moving average and there was some back and forth trading, but the index did not move below the previous local bottom. We can create target levels based on our analysis and we have place a red ellipse around the 128 level in our chart. It seems unlikely that the euro will decline much further from where it is now before forming a local bottom.
Summing up, we could see additional short-term strengths in the USD Index along with weakness in the Euro Index. Neither will probably move very much, and there may be little to no negative impact to gold and the precious metals. The recent relationships between these markets have been somewhat weak as the metals have not declined even though the USD Index has been moving higher.
General Stock Market
In the long-term S&P 500 Index chart, last week’s Premium Updatecomments remain current:
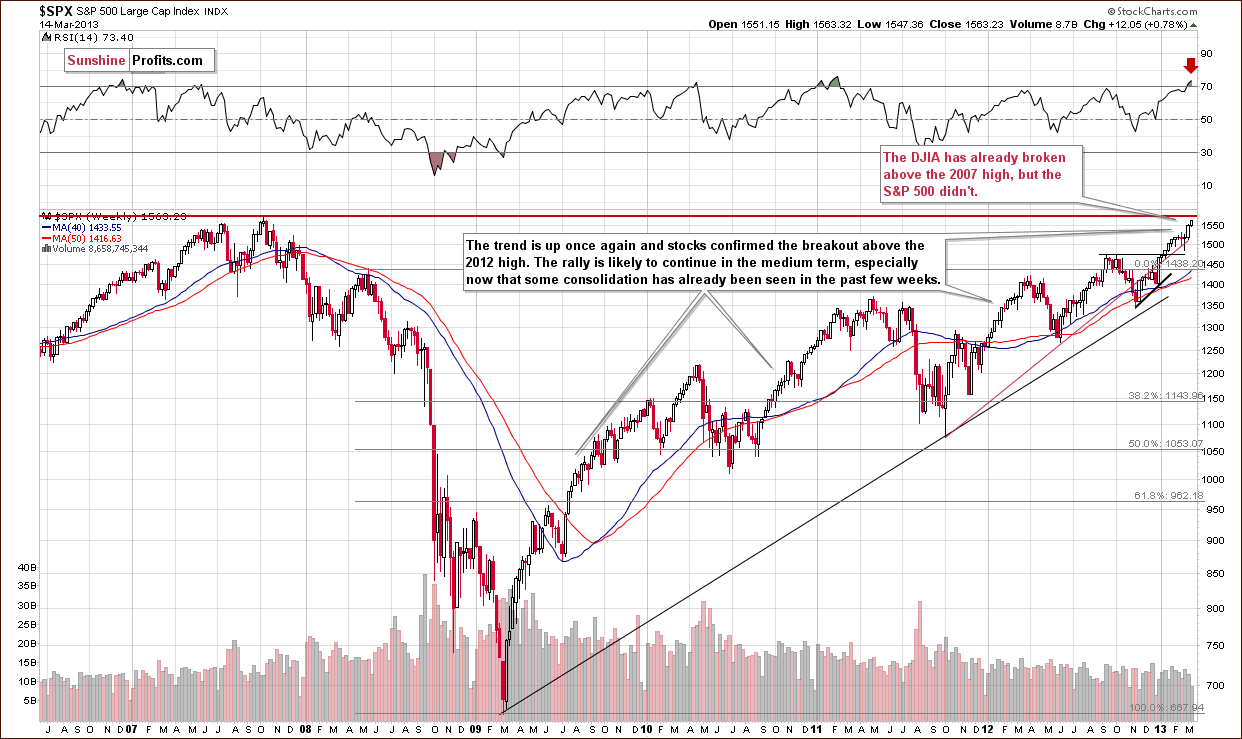
In the long-term S&P 500 Index chart, we see that the broad market has yet to break out above its 2007 high. The Dow Jones Industrials did so, but the S&P 500 have not, so there is no confirmation of a breakout here. This creates a particularly interesting situation.
It seems that the S&P 500 could rally further as their major resistance line has not yet been reached. The Dow Industrials could also rally further since they have already broken out above the resistance level of the 2007 highs. A pause, however, would be likely once the S&P 500 reached their 2007 high.
Our best guess at this time is that the S&P 500 will likely consolidate below the 2007 top, and the Dow Industrials’ consolidation will probably take the form of a post-breakout breather. The RSI suggests an overbought situation, so some consolidation is expected at this time. We expect the rally to continue after a few weeks of consolidation. We will be more certain of a medium-term rally after the breakout is also seen in the S&P 500. Such a development appears quite likely at the moment.
We’ll discuss the link between stocks and gold in the next section of this Premium Update.
Gold and Silver Correlations
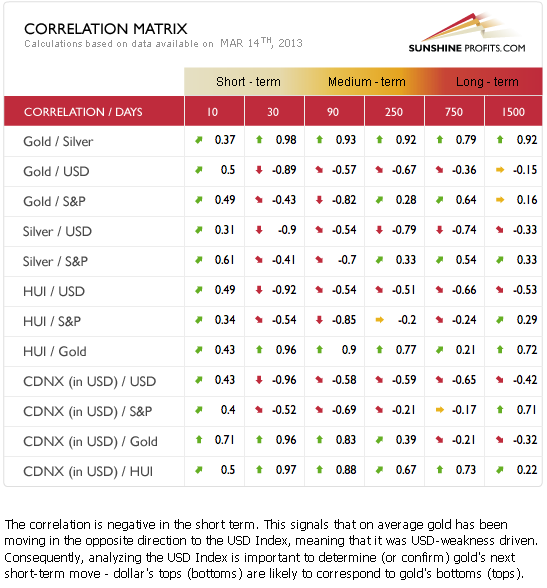
The Correlation Matrix is a tool which we have developed to analyze the impact of the currency markets and the general stock market upon the precious metals sector, (namely: gold and silver correlations). We have two things which we wish to comment on this week. First, the link between the USD Index and gold is negative for the short and medium term. In daily price moves, however, it seems that what happens in the USD Index has been rather irrelevant. Gold and the precious metals have simply refused to move lower when the dollar moved higher.
Our second point is the negative correlation between the precious metals and the general stock market. The link has not been as strong in the last few days, as gold and the precious metals have not declined, although stock prices were rising. When a correction is seen in the general stock market or a period of consolidation begins, the precious metals sector could respond with higher prices.
At this time it seems that the precious metals are anti-assets, just as gold is a hedge against turmoil in the stock and currency markets. As investors become more optimistic about these markets, they sell their gold. It does not mean that in the long run gold cannot rally along with stocks. For instance, both are fueled by low interest rates and quantitative easing. This tells us that a short-term consolidation in the stock market could easily have a positive impact on gold.
Gold
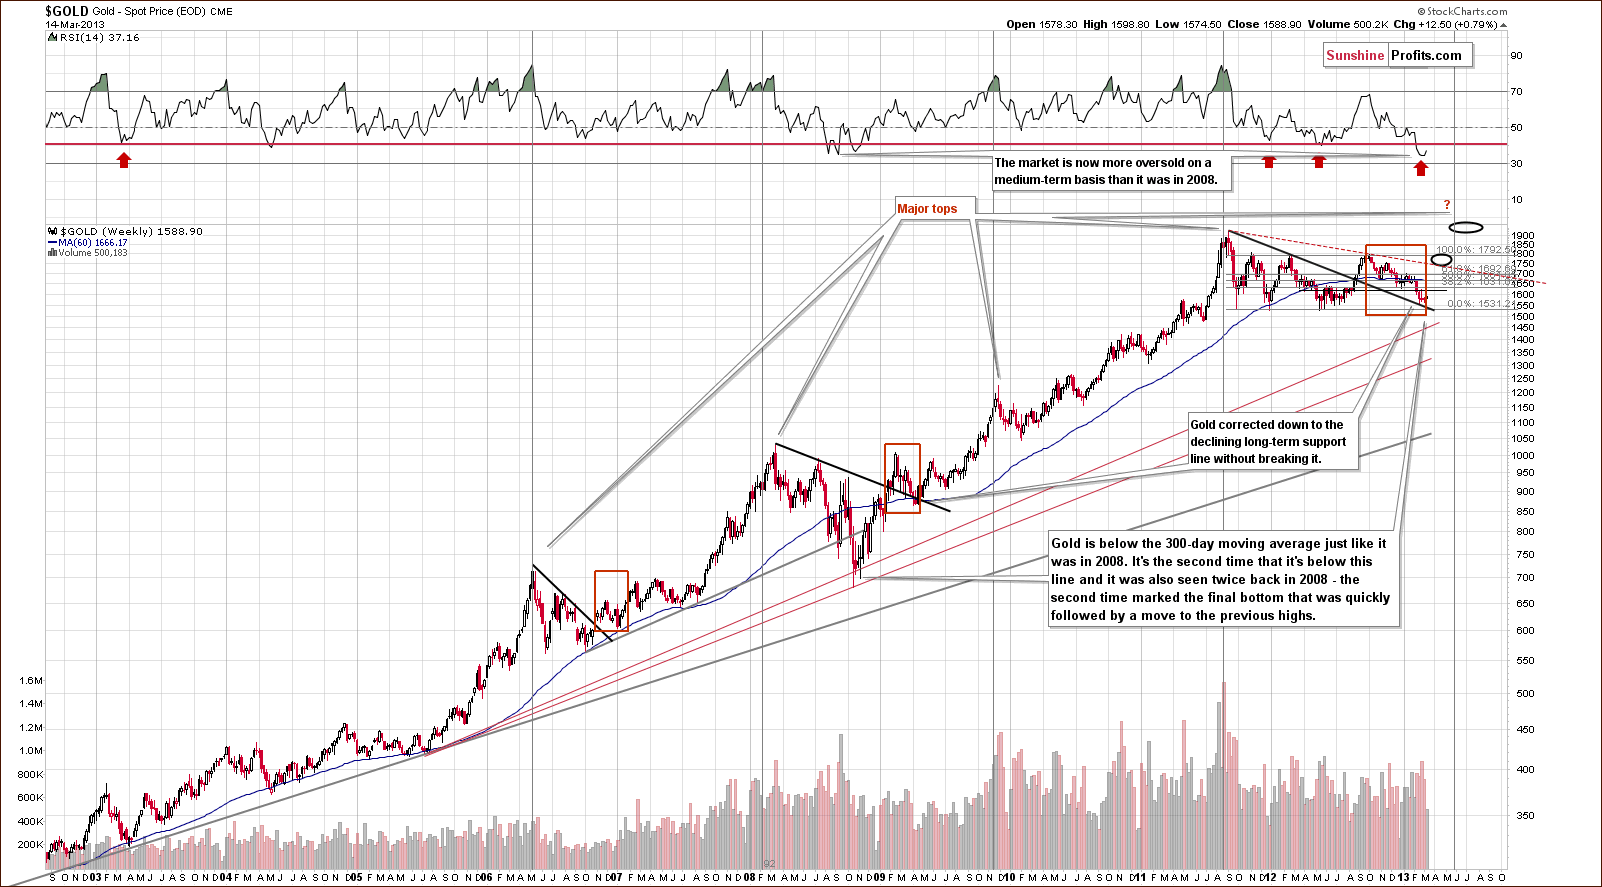
In this week’s very long-term gold chart, we see that in addition to reemphasizing that the RSI suggests that the situation is as extreme as 2008, we must also discuss the 300-day moving average. While a move below this level is not bullish for gold on its own, recall that in 2008, gold moved below this level twice and the second time marked the final bottom.
We are now in this situation once again. This is the second time gold is visibly below this important moving average. This consolidation period was longer, but it still is the second move below the average and in 2008, a rally was subsequently seen.
Other than adding this observation virtually nothing changed on the above chart since last week and we continue to have a bullish outlook as gold is above the declining medium-term support line and 2012 lows.
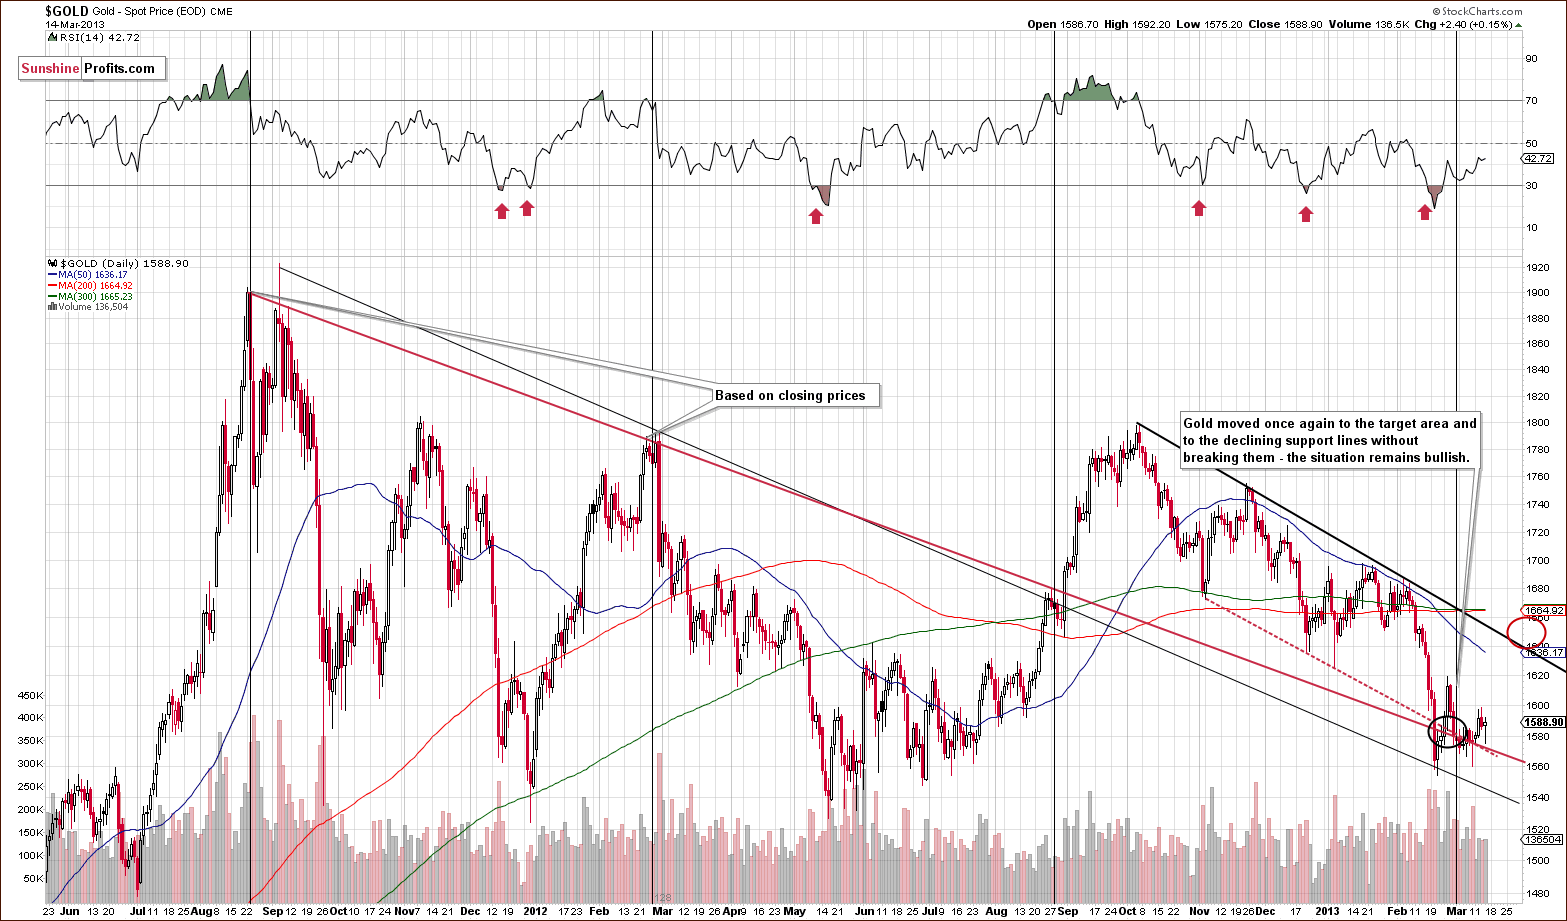
In the medium-term gold chart, we see that gold’s price is holding above the short and medium-term support lines. It probably formed a bottom close to the medium-term cyclical turning point. Please note that last Thursday’s intra-day decline was a retest of the short and medium-term support lines and it was a successful one.
We can expect gold’s price to rally now and pause after moving above the $1,640 level as noted by the red ellipse in our chart. In a worst case scenario that would still not invalidate the bullish outlook, gold’s price could decline to its February low at the black declining medium-term support line. Such a move would not invalidate the medium term bullish picture unless a breakdown below the support line was seen and confirmed. This does not appear likely at this time.
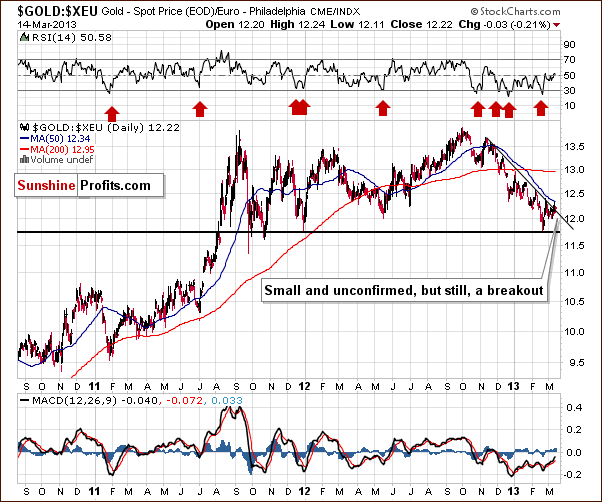
In this week’s chart of gold from the euro perspective, we see a small breakout above the declining resistance line. If confirmed, the outlook would be very bullish for the weeks ahead – and we expect to see this confirmation shortly.
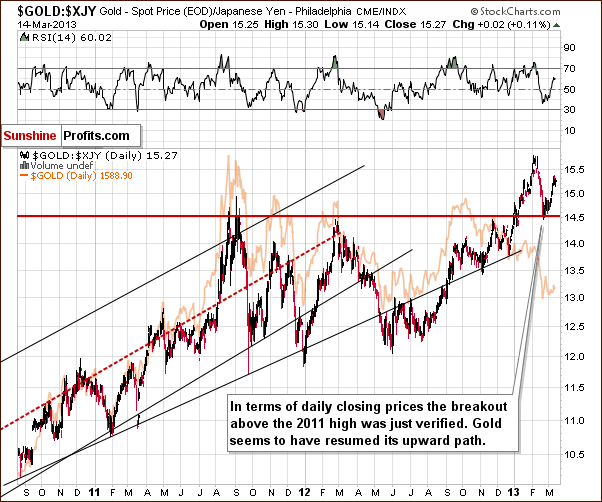
In this week’s chart of gold from the perspective of the Japanese yen, we see a clear breakout and a verification of the breakout above the 2011 high. With this breakout just being verified, the outlook is clearly bullish at this time.
On a side note, we would not be surprised if some websites provided this chart as an example when defining what a breakout or verification are – it’s that clear.
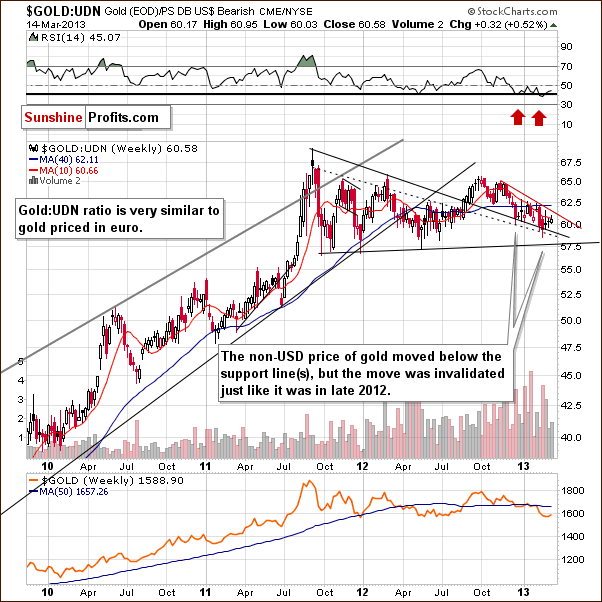
In this week’s chart of gold from the non-USD perspective, we have a situation similar to last week, but prices are a bit higher. Gold’s price is close to but above the declining medium-term support line and below the thick red resistance line. The situation has not really changed much from last week.
Summing up, we continue to have a bullish outlook for the yellow metal, and it will remain bullish unless we see a confirmed breakdown below $1,540. With gold not really reacting to dollar’s strength, we don’t have to see these price levels even if USD rallies.
Silver
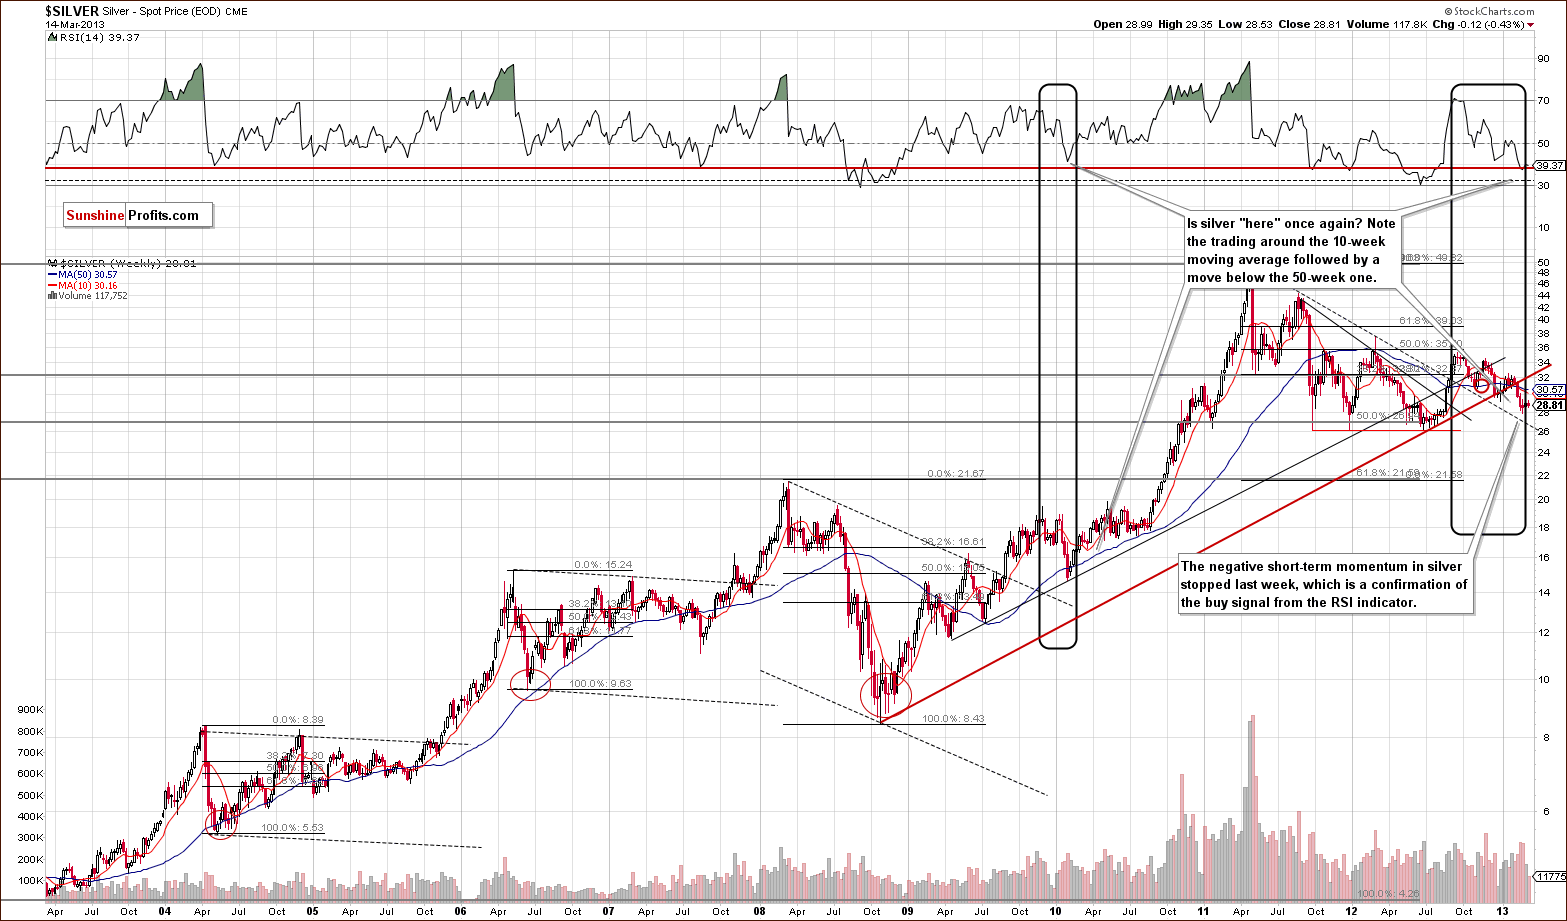
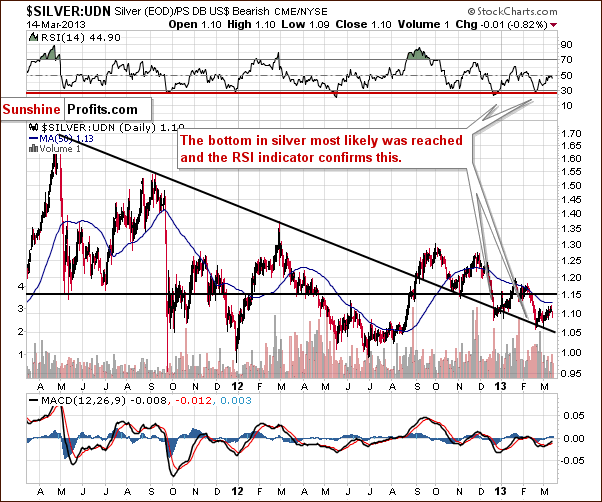
In this week’s very long-term silver chart, recall that last week we speculated that declines have probably stopped here. Now we know this is the case and we have a bullish confirmation of what we see in the RSI levels.
As we stated in last week’s Premium Update:
This is normally not a big deal, but with the RSI level at the horizontal red line, the situation becomes quite different. A stop in the declines quite likely means a bottom has been marked, something which confirms what we see in RSI levels as well.
The point is that with the RSI indicator being where it is, we are expecting to see a bottom. In this environment even a slightly bullish factor becomes a significant one as the oversold status amplifies it.
In this week’s chart of silver from the non-USD perspective, last week’s Premium Update comments remain up-to date and :
(…) we see that the bottom is in and silver’s price is now [close to] the declining long-term support line. When this was last seen, late in 2012 (RSI levels were oversold then as well), prices soon rallied sharply and rose 10% in just a few weeks. With similar trading patterns and RSI levels seen in recent days, there appears to be a good possibility that a sharp move to the upside may be just around the corner here.
Prices are a bit higher than the past few weeks and the medium-term picture remains positive.
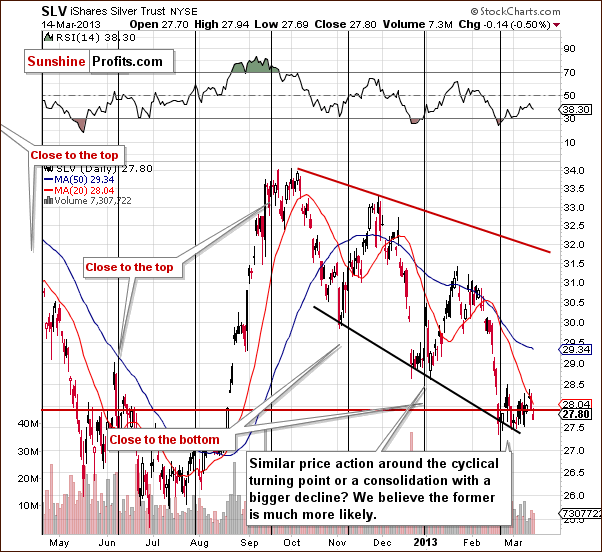
In the medium-term SLV ETF chart, we see that prices have traded sideways for the past few weeks, which is similar to what we saw last July right before a big rally. This is also similar to the period from late December to early January this year. So at time we are not too concerned that the rally has not happened immediately.
From a technical perspective in this chart alone, the medium-term trend is now lower and also follows a consolidation (and RSI levels are no longer oversold), so silver’s price could decline. Support levels are close to today’s price, however, so this chart is not that bearish. Overall, the situation is mixed on this chart alone (!).
Summing up, from a long-term perspective, silver suggests it is at a medium-term bottom and the short-term outlook is not much help. The long-term signals are more important the short-term ones, so the overall the implications are bullish, especially if combined with the implications of this week’s gold charts.
Gold and Silver Mining Stocks
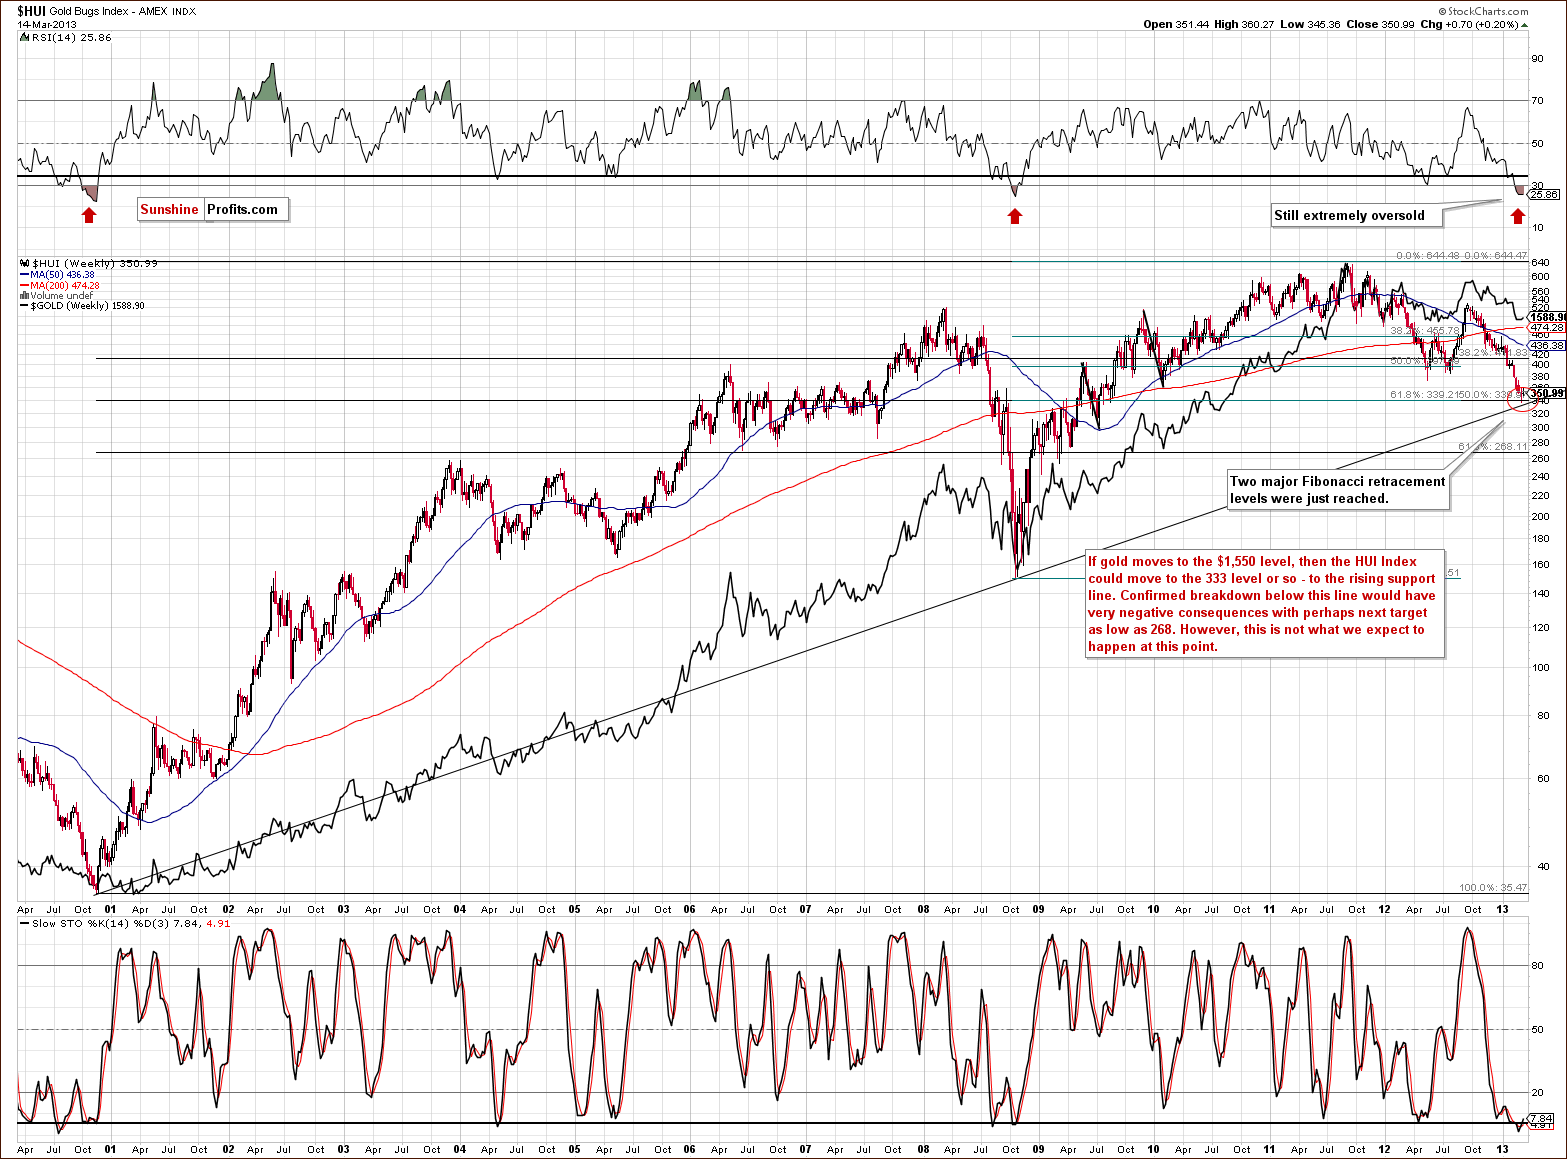
In this week’s very long-term HUI index chart, we have two points we wish to make. First, the RSI is extremely oversold. The small rally seen this week did not change the situation at all. A big rebound is likely based on this oversold situation.
Secondly, if the rebound is not seen immediately, it seems that a small decline, perhaps to the $333 level or so (at the very long-term rising support line) is possible. We have previously stated that this level was almost (!) reached. A move to this line will not invalidate the bullish implications here.
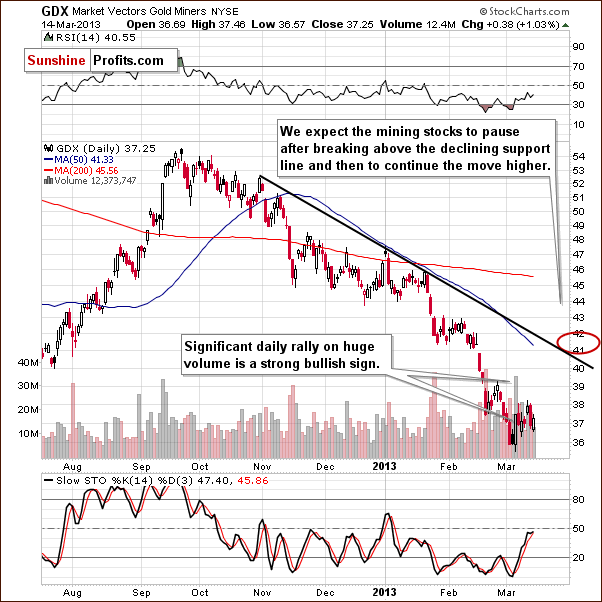
In this week’s GDX ETF index chart, we see that the last few days have been basically just a small consolidation after the strong daily rally on huge volume seen last week. Keep this rally in mind, for it likely marked a major bottom here – based on the huge volume seen on that day. When gold stocks finally rally, we expect some consolidation around the $41 level, when the declining resistance line is breached, followed by higher prices once again.
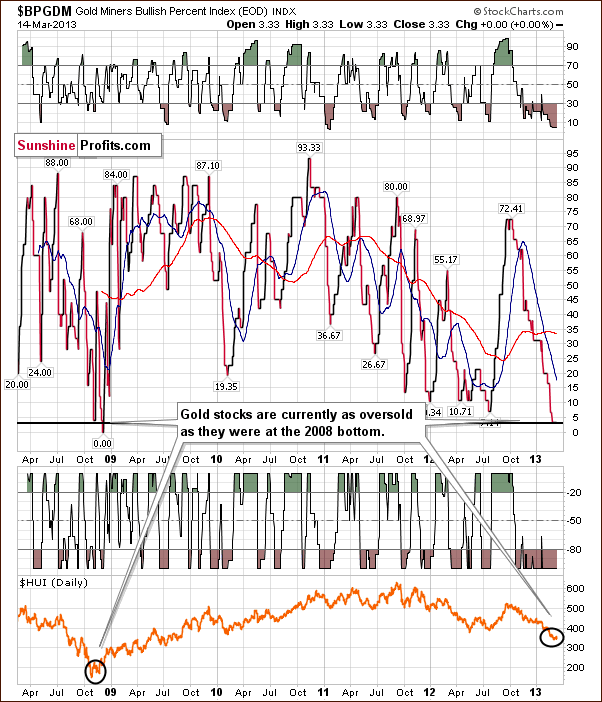
In this week’s Gold Miners Bullish Percent Index chart, the situation has not changed at all and is still as extremely oversold as it was last week. This is similar to what we saw in 2008, and when taking both indicators into account, the situation is much more extreme than it was back then. These indicators have been oversold for months now and it’s almost a proof that the sentiment toward mining stocks is worse than in 2008.
Summing up, the medium-term outlook for the miners remains bullish and even if a period of short-term weakness is seen for the miners, it seems that a rally is likely to follow as long as the HUI Index holds above the long-term support line, around the $333 level. We do not think a move this low is highly likely and worth betting on, however, because the miners have also stopped reacting negatively to the USD Index. We also saw a rally on strong volume last week in the GDX ETF, which has possibly reached a major bottom.
Letters from Subscribers
Q: When gold declines $4, and the GDX is down $1, that's telling you something. Now, just what do you think would happen if gold made another run at $1,550?
A: A daily move doesn't tell us much, could be just price noise. On Thursday GLD moved 0.01% higher and GDX moved 1.03% higher – but that doesn’t prove outperformance either – the data sample is too small.
If gold moved to $1,550 once again, we would expect the mining stocks to move lower as well, likely slightly below the previous low, to the very long-term rising support line that we have drawn on the long-term HUI Index chart. We previously mentioned that this line was almost reached and we could see it reached if gold moved to its recent low.
Q: What will happen to gold and silver prices if the Dow and the S&P start correcting from their recent highs? Thanks.
A: It seems to us (and the short- and medium-term correlation coefficients confirm this) that the weakness in the gold market is to a large extent caused by increased optimism about the stock market and the US economy. In the eyes of some investors, gold has lost its appeal. It no longer seems necessary as everything is going well, and that is what you can see in the popular media.
Consequently, a correction in stocks could actually help precious metals at this time. Again, it's a tough call, because we saw this link only in one way - when gold declines as stocks rise - and we would like to see a few days of stock declines and gold rallies to confirm that that is indeed the case now.
Q: Is the Bitcoin to gold ratio worth following? I remember reading an analysis that suggested big moves in precious metals are preceded by moves in Bitcoin.
A: The Bitcoin-gold link is very interesting as both are somewhat anti-fiat-currency. Gold is the ultimate currency that has worked throughout history (as governments couldn't control its supply nor destroy it through hyperinflation), and Bitcoin is the new digital currency that governments can't control. There's currently a parabolic upswing in the latter, by the way.
The problem is that the Bitcoin market was extremely thinly traded and the volume is still not very significant. This, along with the age of the market, makes us doubtful regarding any ratios simply because there is too great a risk of either manipulation or malfunction in the Bitcoin system when spike highs or lows form.
Consequently, this market is on our radar but it's too early to draw meaningful conclusions based on it.
Q&A:
We were sent and asked to comment on the following essay/comment that paints a rather bearish picture for the precious metals sector. We will put our comments within the essay:
The first clue to identifying this kind of situation is to get a handle on the market positioning. Whilst we cannot know for sure how all investors are positioned, listening to people’s view on the market can be a good proxy for this.
---
Comment: We agree.
---
Everyone else it appears, is long gold stocks, thinks they are significantly undervalued and believes that we are going to see a huge rally in gold stocks as gold moves to new highs and the miners have to play catch up.
---
Comment: We strongly disagree. Gold stocks are one of the most hated, if not the most hated, sector in the market. Although you might get the impression that people believe in precious metals after reading articles on precious-metals-related portals, this is not really the case. Gold analysts who sell analyses that only feature their gold portfolios etc. (meaning that people will be interested in their services if they expect gold stocks to move higher) will generally be biased towards a bullish outlook. (Please note that we have suggested being out of the market or even shorting it in the past.) We're not trying to point fingers at anybody, just describing the general idea. Using gold analysts as a proxy for everyone is not appropriate. Please note that it is only our interpretation that the author meant other analysts in the above sentence.
Here's one quantitative detail: things that we look at and research include, for instance, web searches. The amount of people that are now looking for "gold stocks" is close to the 2004-2013 lows (that’s the longest period that we could get data for). The RSI indicator suggests an extremely oversold condition, not an overbought one. The same can be said about numerous other indicators. We regularly receive letters from investors discouraged with the performance of the precious metals market.
---
We know of only one fund manager who is short the miners (against a long physical gold position) but it appears everyone else is long. (...)
---
Comment: While we can't verify this as we're not sure who is being put in the "everyone else" category, we do know that major financial institutions are lowering their forecasts for gold, as mentioned in the opening part of today's update.
---
The same investors who are long gold mining stocks have been long for some time now. They still come out with the same spiel about how there is going to be a massive rally in the sector as the public begins buying into the gold bull market mania.
---
Comment: Yes, as new investors are generally not entering this market as the sentiment is bad because of the sector’s underperformance in recent months and, in fact, years.
---
This simply isn’t happening and will not happen this year, just like it didn’t happen last year, or the year before.
---
Comment: Correct, this isn't happening, but we don't see why this would imply that it won't happen this year. The fact that it didn't happen last year or the year before makes the situation more bullish, not bearish, as fundamentals for the precious metals sector are positive.
---
So we have established what the market positioning is, the next key step is to gauge the market mentality. The street (i.e. investors in general) can be long and still buy more, pushing the market higher, but that is not the case in the gold mining sector. The street is tapped out. There are no more bullets to fire and no more fresh funds to invest in gold miners.
---
Comment: We think the opposite is the case. People are discouraged, not extremely excited. People were selling and can get back in the market, they have not been buying heavily pushing prices higher to the point that there's nobody left to buy.
---
Gold mining bulls have bought every dip in the last few years and not sold the rallies as they are still under the false perception that there is going to be some super rally that they do not want to miss out on. The market mentality has now shifted. With the breakdown in gold prices technically, a lack of momentum in the last 18 months and an improving economy that makes more QE less likely by the day, the gold bull market story is losing credibility.
---
Comment: The fundamental situation for gold was positive even before the QE programs started. In addition, governments are now buying gold and we continue to have extremely low interest rates. We now have an open-ended (!) QE in place, and there is only speculation about it being over. The fundamental picture remains positive. Technically, the correction was to be expected and there are signals in place suggesting that it's over or very close to being over, for instance gold has stopped reacting (on average) to the dollar's strength.
---
This means that the holders of gold stocks are now getting concerned they may not get the super rally they were desperately holding out for. If gold doesn’t make new highs, how can gold stocks?
---
Comment: We doubt that investors have only now started to get concerned (and we disagree that the bull market is over). The declining mining stock prices suggest that they got concerned a long time ago and have been selling for months now.
---
Another symptom of this situation is some of the more desperate bulls resorting to conspiracy theories as an excuse for why they are losing money. We are not going to waste too much time discussing whether or not there is manipulation in the market.
---
Comment: We agree that blaming manipulation/ conspiracy theories is not an appropriate explanation for all price declines. At the same time we’re not convinced that there is no manipulation in case of the precious metals market whatsoever, especially in case of silver. However, we agree that not all declines should be blamed on manipulation – this is usually just a self-defense psychological mechanism.
---
Was it manipulation that drove gold from $1900 to $1600 in the last year or so? No.
---
Comment: We don't know, we don't have proof that it was legitimate either (but we are leaning toward saying that the decline was rather natural).
---
Likewise the whole paper versus derivative argument that is often put forward appears to us as nothing more than a poor attempt to distract attention from the poor performance of the gold mining stocks and those who consistently recommend them. Sure, the physical gold market may trade at a different level than the futures, but we are talking about a few dollars and it’s irrelevant in the grand scheme of things. Physical gold isn't still selling for $1900, it's selling closer to $1600, and gold stocks fall when gold futures fall, so we ignore such arguments.
---
Comment: We agree that on a short-term basis prices generally stick close, however, there may be times in the future when the physical market moves away from the paper market (especially in the case of silver). However, we don't expect that to take place unless there are some huge changes in the global monetary system or physical tightness in case of silver.
---
So these trapped longs are feeling some pain and it will come down to individual tolerance levels as to when various parties throw in the towel.
---
Comment: If everyone was long and so bullish about the market as indicated earlier, the above would not be an issue. However, if people had already exited the market as they felt a lot of pain during mining stocks' decline in the past months, then they are now out of the market and can re-enter at higher levels, when they become more convinced about the sector.
---
Most will be opting for a strategy along the lines of “I’ll sell if we get a small rally”, and although not all will stick to this strategy, some will and this will keep the rallies back in gold stocks muted – particularly if gold prices remain range bound. There is a chance however that we could see a period of total capitulation where the long throw in the towel and hit whatever bid there is in the market just to get out. This could occur if gold breaks $1550 and should the scenario eventuate then in our view 300 is a realistic target on the HUI gold miners index (equivalent to roughly $35 on GDX). If we do not see a capitulation then the most likely scenario is one of a slow bleed out, gold stocks grinding lower as one by one the longs bail out of positions.
---
Comment: If (!) gold breaks below $1,550-$1,540 then we might indeed see more weakness in the gold mining stocks, and HUI could even move below the 300 level. This is not what we see as a likely outcome, though.
Still, if it was the case that everyone was still long, it would mean that everyone stayed long during HUI's decline from 600 to the 350 that we have right now and if everyone sells in a panic, then the value of the HUI Index would drop only to 300? No difference in investors' sentiment and a 250-index-point decline vs. a total turnaround in the sentiment accompanied by only a 50-point decline?
We continue to believe that the sentiment in gold stocks is extremely negative, that investors are very discouraged and disappointed and that the bottom is at hand or is already in.
Summary
The USD Index may move a bit higher before forming a top, but even if it does it may not have to impact the precious metals negatively. It used to be the case that when the USD Index and stocks moved higher, precious metals prices declined. Since the most recent cyclical turning point for the USD Index however, this has no longer been the case.
Gold seems to have bottomed close to the medium-term cyclical turning point and remains above key support lines from both the USD and non-USD perspectives. We also saw a breakout for gold priced in euro this week, and it seems that the final bottom for recent declines may already be in for the precious metals. Even if additional short-term weakness is seen however, the bullish medium-term picture will not be invalidated. Please check the table below for stop-loss details.
Trading – PR: Long position in gold, silver and mining stocks.
Trading – SP Indicators: Long position in gold, silver and mining stocks
Long-term investments: Remain in the market with your precious metals holdings
| Portfolio's Part | Position | Stop-loss / Expiry Date |
|---|---|---|
| Trading: Mining stocks | Long (full) | 328 (HUI) / Mar 29, 2013 (half) |
| Trading: Gold | Long (full) | $1,534 / Mar 29, 2013 (half) |
| Trading: Silver | Long (full) | $27.80 / Mar 29 2013 (half) |
| Long-term investments | Long | - |
We extended the expiration dates for the long positions based on the SP Indicators for gold, silver, and mining stocks as we saw another buying signal from the SP Extreme #2 Indicator based on March 14 closing prices. We also lowered the stop-loss orders for gold and silver.
This completes this week’s Premium Update. Our next Premium Update is scheduled for March 22, 2013.
As always, we'll keep you updated should our views on the market change. We will continue to send out Market Alerts as the market situations dictate and each day at least until the end of March, 2013 even if our views on the market don’t change.
Thank you for using the Premium Service. Have a profitable week, a great weekend!
Sincerely,
Przemyslaw Radomski, CFA

