
We've almost had a breakout in silver. On Friday, the white metal closed just $0.01 below its 50-day moving average. Once this level is taken out, silver will likely rally further more decisively. This means that any move up here that holds will likely be followed by more gains, not another lengthy consolidation. So far we have seen a small move lower today, but the 50-day MA is still within reach of a daily upswing.
The USD Index closed slightly below the neck level of the medium-term head-and-shoulders pattern on Friday. The breakdown was not verified, so it's too early to get excited (in fact, the USD moved a bit higher today), but we're a big step closer to a confirmed breakdown which would likely lead to further declines in the USD Index and trigger a rally in the precious metals sector.
Over the weekend, we re-examined long-term trends to make sure that you have a full picture of what's going on. There is one relationship that we haven't described for some time now and which currently seems quite useful as after a lengthy consolidation it's quite hard to believe that the consolidation is actually over. What if there was something important that suggested that the final bottom had been formed in mid-2012 and that the rally would indeed accelerate soon? There is such a chart and such a relationship. It's the one between gold and bonds, and more precisely, between gold and the ratio of yields, which ratio emphasizes long-term yields (chart courtesy by http://stockcharts.com.)
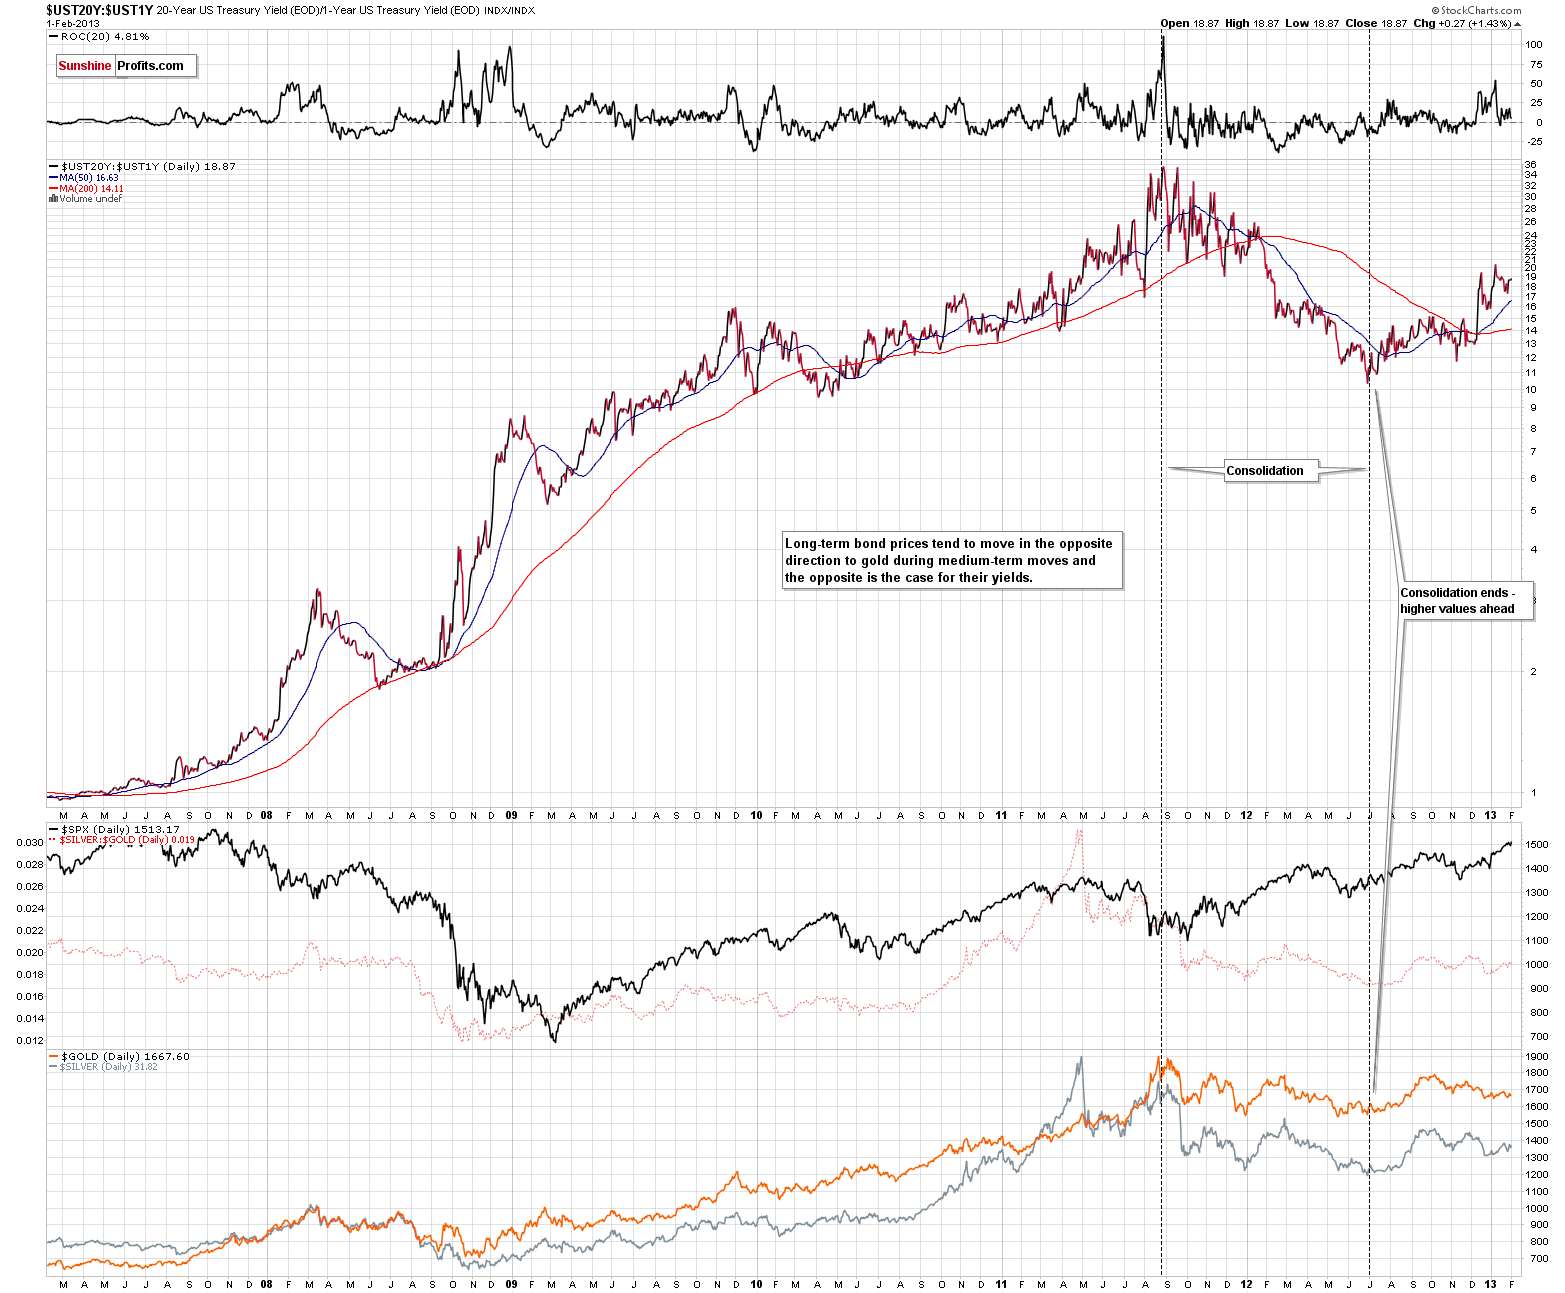
We've used the ratio of yields instead of yield levels since the ratio does a better job at showing bondholders' views on the market than the yields itself. This is because all yields are heavily influenced by Fed rates. By dividing one yield by another, we can partially remove the Fed-effect.
The important thing is that the medium-term trends are very similar in case of long-term yields and gold, and that yields have been on the rise since mid-2012, accelerating in Dec 2012. With yields moving higher, gold is likely to follow.
Why is this taking place? This is not a purely technical phenomenon, and there is a good fundamental reason for it. Yields are moving lower when bond prices are higher and vice-versa. So, it is actually the case that medium-term declines in long-term bond prices are negatively correlated with gold prices. This makes sense, because they could be both viewed as safe-haven assets competing for the attention of investors. If people want to stay safe with their investments but they don't like bonds - they buy gold. Conversely, if they don't like gold, they can switch to bonds by selling gold. Actually, the implications of this observation are much more important than the medium-term situation. With bond prices still at incredibly high levels caused by extremely low interest rates we have a lot of downside potential in this market. This means a lot of upside potential for gold.
On a side note, do you recall what Warren Buffett said about bonds several months ago? He said that we didn't like any of them.
Just as we indicated previously, a full speculative long position is suggested for gold and silver, and also for mining stocks.
Naturally, we suggest remaining in the precious metals market with your long-term investments. We sustain our belief that platinum will continue to outperform gold in the following months and it's not too late to take advantage of that.
As always, we'll keep you updated should our views on the market change. We will continue to send out Market Alerts on a daily basis (except when Premium Updates are posted) at least until the end of February, 2013 and we will send additional Market Alerts whenever appropriate.
Thank you.
Sincerely,
Przemyslaw Radomski, CFA

