
In December 31, 2011, the U.S. Congress passed the National Defense Authorization Act (NDAA) for Fiscal Year 2012. There are many interesting items in the bill, but the most interesting for precious metals investors are the economic sanctions against Iran which are to go into effect at the end of June. This will make it very difficult for Iran to sell the 2.5 million barrels of oil it produces daily to the west. The bill places sanctions on any country or company that deals with Iran, forcing countries to choose between buying oil from Iran or being blocked from any dealings with the U.S. economy. The inability of Iran’s oil customers to pay cash has contributed to a shortage of hard currency in Iran and has hindered its central bank from defending the Iranian rial, which fell sharply over the past month.
China is Tehran’s largest oil customer and trading partner. The strict measures in the bill make it extremely difficult to conduct dollar-denominated business and this puts Chinese officials in a bind. Last year, China imported $21.7 billion in Iranian oil and exported $14.8 billion in goods and services.
The barter trade of goods and services for oil works, but besides Chinese televisions, washing machines and chop sticks, Iran needs cash, especially since it is being cut off from the global financial system. If you recall, in late February the Iranian central bank said it would accept gold as payment for oil. We will not be surprised that when the bill goes into effect in late June, Beijing could start shipping gold to Iran to make up the difference in the trade deficit.
Just imagine what this could do to the price of gold.
Before we jump for joy, let’s keep in mind that the U.S. bill gives the president the power to waive the sanctions depending on the availability and price of supplies from non-Iranian sources. He can also exempt financial institutions from countries that have significantly cut back purchases of Iranian petroleum. For example, the State Department announced waivers for Japan and ten European countries. However, with elections coming up in the U.S and with President Obama wanting to look tough on Iran, Beijing cannot count on getting exceptions in the future.
The Iranians said they would also accept local currencies in an attempt to avoid the U.S. financial system, which means that the Chinese might also pay with non-convertible renminbi for the Iranian oil. (This goes towards undermining the status of the dollar as the world’s reserve currency.) Undoubtedly China and India would be more than happy to keep the money they owe Iran in their banks and give Yuan and rupees instead of hard currencies.
But most likely, the Iranian Mullahs will want real moolah and the best currency has been and likely will always be gold.
The Iranian currency is in crisis. It is not unimaginable that a currency crisis could hit closer to home. What is the best way to defend against a currency crisis? Don’t hold the hot potato and buy a safer currency or else gold, physical gold.
There are several currency crises that we name off the bat. There was one in Argentina in 2002, Brazil in 1990, Thailand in 1997 and Russian in 1998 to name a few. Savvy investors with enough foresight to trade those currencies for safe bets such as the US dollar or gold, were able to weather the storm and pick up a few bargains along the way. But that’s when the U.S. dollar was king of the mountain and the go-to currency in time of crisis.
So now, when the safe bet is not such a safe bet anymore, what is a savvy investor to do? The crises that are unfolding across the front pages of the newspapers are not in countries such as Thailand or Argentina. Now we’re in the currencies major leagues. The fault line is of epic proportions. The US dollar has lost about a quarter of its purchasing power just since 2000. At the same time the value of gold has vaulted.
One can always swap the dollar for currencies that seem more solid, Switzerland, Australia, Singapore, Norway or Chile. Some of these countries are rich in resource and/or operate in a fiscally prudent manner. But for some inexplicable reason when the euro crisis hit last summer, those currencies fell against the US dollar. So swapping dollars for another currency can be a risky venture.
Well, you can probably guess what we think is a good alternative for preparing for the worst.
Precious metals.
As we wrote in our Market Alert this week, the bullish picture for gold has not changed and the smart things to do is to hold on to long positions and buy gold on dips.
The market place seems to be waiting for a new fundamental spark. The European Central Bank has just announced it has left its interest rate unchanged. There were French and Spanish bond auctions this week that were considered fair, and therefore did not set off fresh worries.
A London-based consultancy said Thursday that investment demand for precious metals should rise in the second half of 2012, and that should support platinum group metals prices. Thomson Reuters GFMS stated in its Platinum and Palladium Survey 2012 that gold investment demand is expected to rise in the later part of 2012 and that should spill over to platinum and palladium. The consultancy estimates platinum prices will trade in range of $1,475 to $1,775 an ounce for the rest of this year. Platinum should also find support from production cost pressure in the South African mining industry.
We believe that the main catalysts for the bull market in gold and precious metals are still firmly in place. We have put our money where our mouth is and are invested in long term gold positions right along with our subscribers. The key here is fortitude, staying power and patience.
By the way, it was last year at this time, just about the time of Osama Bin Laden’s capture that silver plunged erasing two weeks of gains in only 11 minutes, falling as much as 12 percent in the session. Luckily, a year ago – in April 29, 2011 Premium Update, we wrote the following: “most traders should not attempt to take advantage of this rally, for it could be difficult to exit quickly if the situation becomes very volatile. Such will be the case if a multi-dollar decline is seen in silver’s price right after the top is formed.” A year later – it the situation appears to be completely different.
Let’s turn to the technical portion with analysis of the US Dollar Index. We will start with the short-term chart (charts courtesy by http://stockcharts.com.)
USD Index
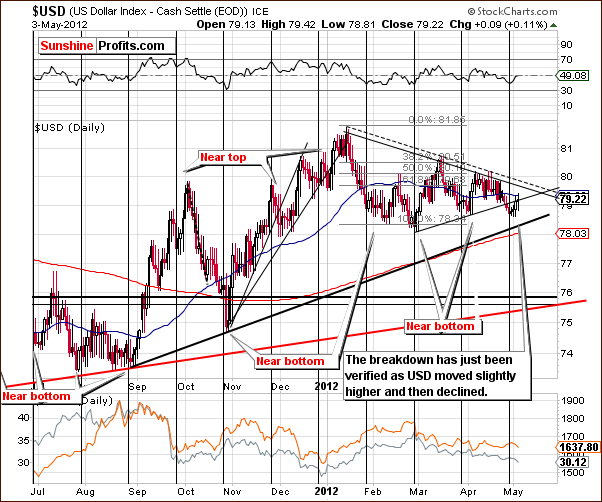
We begin this week with the short-term USD Index chart because it is one of the three most important charts of this week’s Premium Update, along with one of this week’s gold charts. Its importance is due to the fact that it helps to explain what’s behind the recent decline in precious metals prices.
A small rally was seen here this week. By identifying this, however, we actually reveal some bullish (yes) implications for the precious metals. Recall that in last week’s Premium Update, we said that we are a bit concerned with a cyclical turning point also about to come into play. There could simply be a small correction after the recent breakdown to be followed by more declines.
At this point, it might just be the case that the rally in the USD Index that the cyclical turning point suggested is completed. In other words, the thing that made us concerned last week is likely already over.
At the same time, this slight move to the upside will – once USD moves lower - actually verify the breakdown below the rising support line which is now a resistance line. The USD Index is likely to move lower and precious metals’ prices higher in the coming days. More details on this topic will be covered later in this week’s Premium Update.
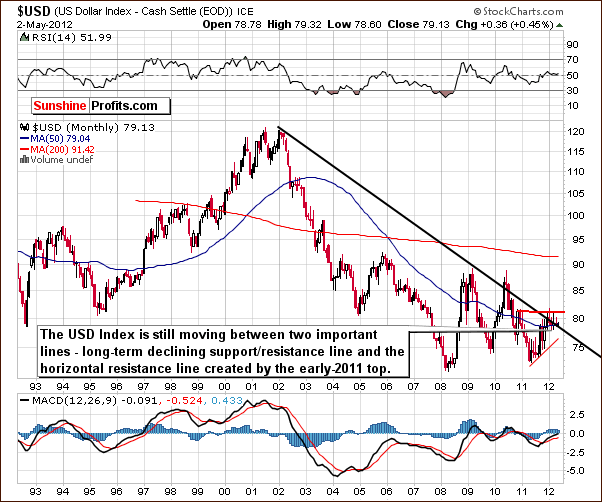
In the very long-term USD Index chart, what we stated last week in still up-to-date and accurate, so we have included some of those comments below:
We see that the sideways trading patterns continue between the two levels which are quite important from a technical perspective. These are the declining long-term support line and the horizontal support line based on the early 2011 high. At this point, the very-long term chart remains mixed with a bearish bias.
To illustrate how small the trading range has been for the USD Index recently, the past sixPremium Updateshave found the change from the previous week to be as follows: down .41, down .61, up .95, down .79, up .25, and down .39. So nearly every week saw a change of less than 1% for the index value of a week earlier, and with the good mix of ups and downs, this is a prime example of true sideways trading.
In the past week, the USD Index rose .31, once again staying well within the recent, narrow trading range.
Summing up, the long-term picture for the USD Index has not changed and the short-term outlook is a bit more bearish even though a slight rally was seen this week. The rally was likely due to the cyclical turning point and the influence of this is probably about over. Also, the small size of the move has actually allowed the recent breakdown to be verified – the verification will be complete once USD moves once again lower. This is also a bullish sign from what at first appears to be a bearish development.
General Stock Market
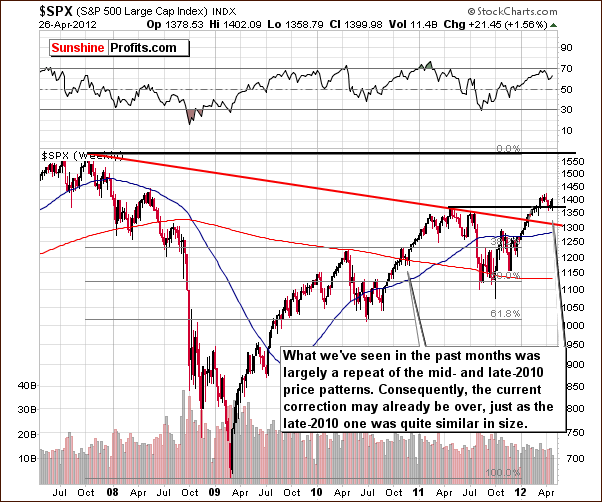
In the long-term S&P 500 Index chart, we have much the same outlook as we saw last week. The recent correction appears quite similar to the one of 2010 and the consolidation seen in RSI levels is also similar. Back then, prices rose nearly 15% in about three months following the small correction. Self-similar patterns (like this one) are quite reliable, so at this point, stocks appear ready to move higher.
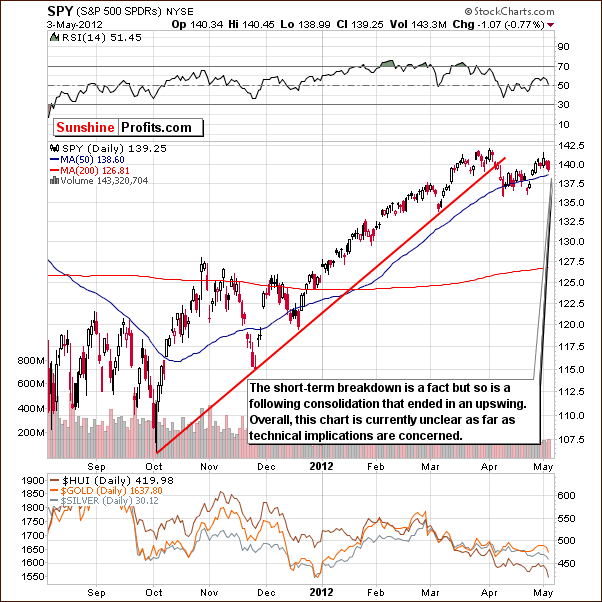
In the short-term S&P 500 Index chart, the situation is somewhat mixed. This week could be viewed as a few days of rally followed by consolidation (with another rally just around the corner) or the beginning of another move to the downside. The 50-day moving average continues to be within range as a support line and may continue to hold declines in check. Note, however, that it was been broken temporarily on several occasions late last year.
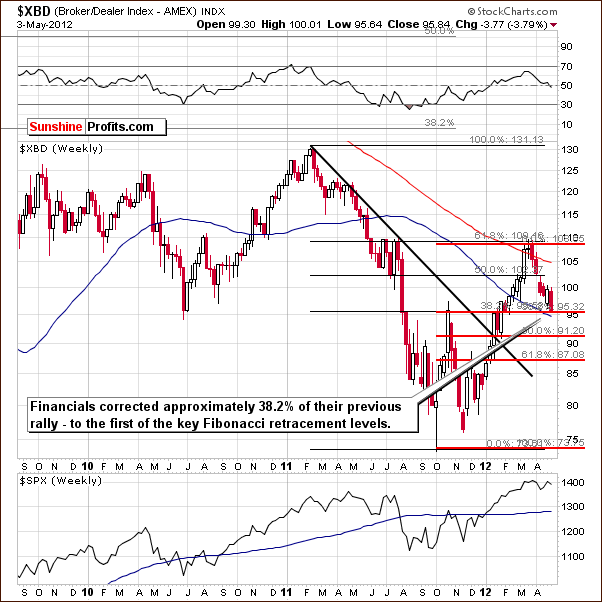
In the Broker Dealer Index chart (proxy for the financial sector) we see that a key support line has held. This line is at the first key Fibonacci retracement level and is also close to the high seen in the financials last October, slightly above 95. Support levels are in check and the bottom may be in. The rally seen since late 2011 has corrected and it now appears that the financials are ready to move higher and perhaps take other stocks with them.
Summing up, the situation for stocks appears mixed for the short term and bullish for the long term. Overall therefore, the outlook is bullish as long-term signals carry more weight than short-term ones.
Correlation Matrix
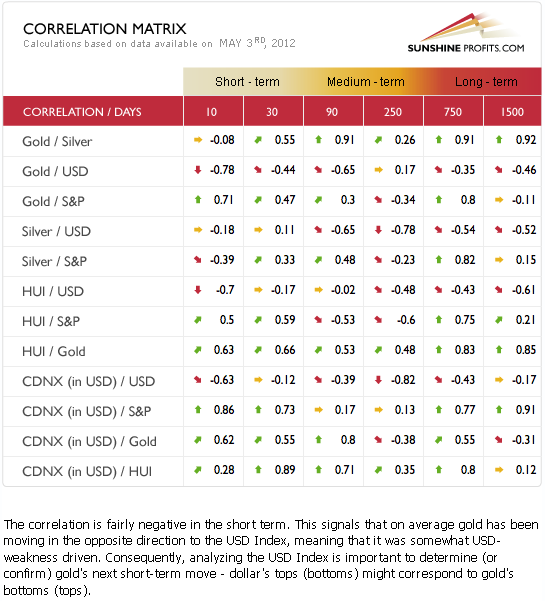
The Correlation Matrix is a tool, which we have developed to analyze the impact of the currency markets and the general stock market upon the precious metals sector. The implications this week for precious metals are generally bullish. The correlation coefficients with the USD Index are negative but rather weak and are they are positive with the general stock market. Therefore, the prevailing bearish outlook for the USD Index and the bullish sentiment surrounding stocks are both likely to provide a positive influence on gold, silver and the mining stocks in the coming weeks.
Gold
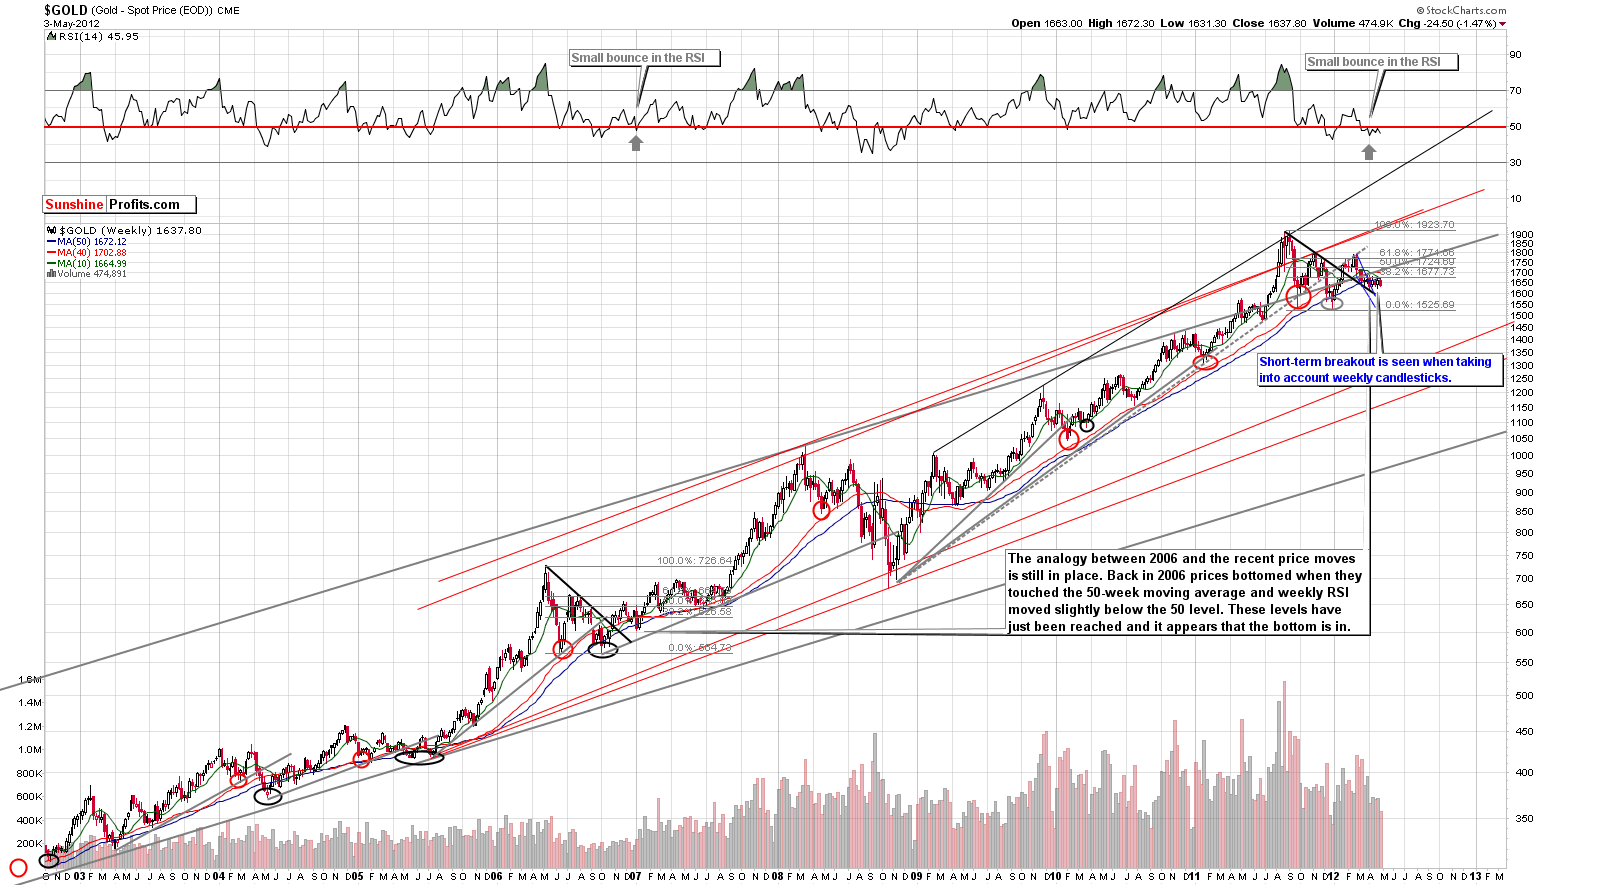
This week we begin our gold section with a look at gold’s long-term chart (please click the above chart to enlarge). This is the second of the very important charts we mentioned in the beginning of this week’s Premium Update. Its implications are still profound as the length of the pattern and its strength are huge even though not much has changed from this perspective in the past week.
Here’s the real point. We saw gold reach a new high with its sharp rally last year and it has since corrected twice. There was a breakout above the declining resistance line followed by a several month long period of consolidation. It is very probable that a rally will be seen next. In short, this chart provides the framework which gives us general direction with which to view other charts for signals that the consolidation is finally over. This is the case, because the big picture is much more important than other short- or medium-term price developments.
So, keeping the above in mind, let’s take a closer look at the short-term GLD ETF chart (the third of the most important charts for today).
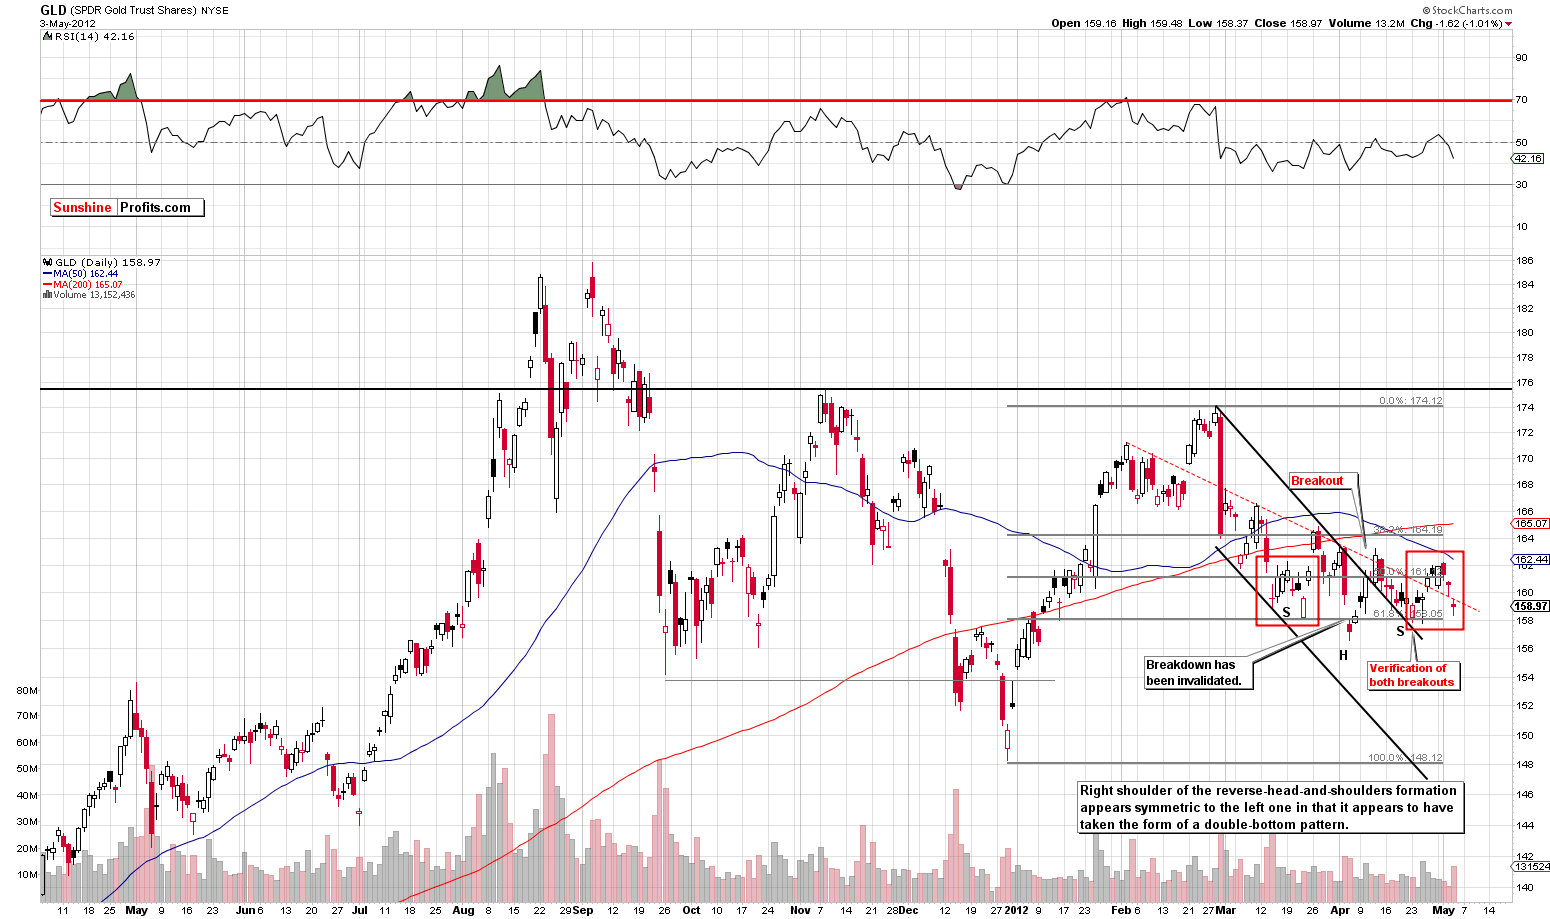
On the above chart, we see a very interesting pattern this week. Gold prices declined, and we realize this is not encouraging for those who – like us – are betting on higher precious metals prices. However, the recent trading patterns seem like a mirror image of the previous shoulder of a reverse head-and-shoulders pattern (marked with red rectangles on the above chart). For the formation to be symmetrical and therefore reliable, the two shoulders should be similar in size and shape. To be precise – it’s not that if the symmetry is weak then the formation can’t play out at all – it can, but the point is that the more symmetrical the formation is, the more reliable it is.
We have seen just another move lower and probably another bottom which is indeed symmetrical to what was seen previously. The two are very similar in terms of price level and shape of the whole shoulder and the implications are therefore quite bullish. If the similarity of patterns continues, a significant rally is probable in the coming days with a likely short-term target level of $166 for the GLD ETF and $1,700 for spot gold (higher prices would then likely follow after a short several-day pause).
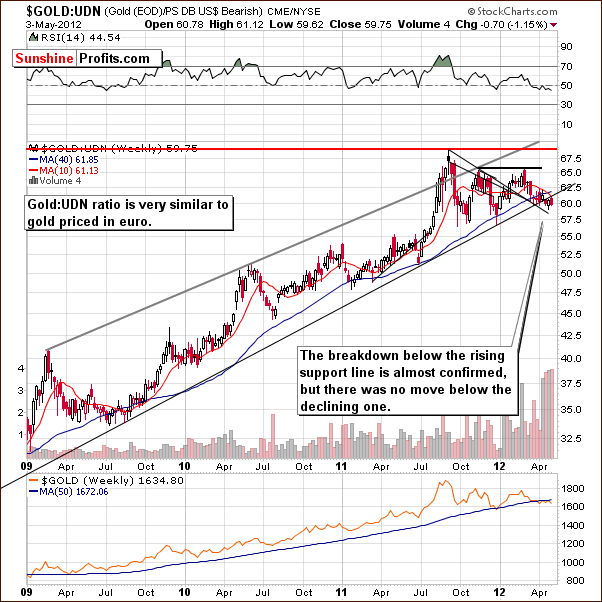
In this week’s chart of gold from a non-USD perspective, we see that gold has consolidated below the long-term rising support line but above the medium-term declining support line. Overall the implications are rather mixed here.
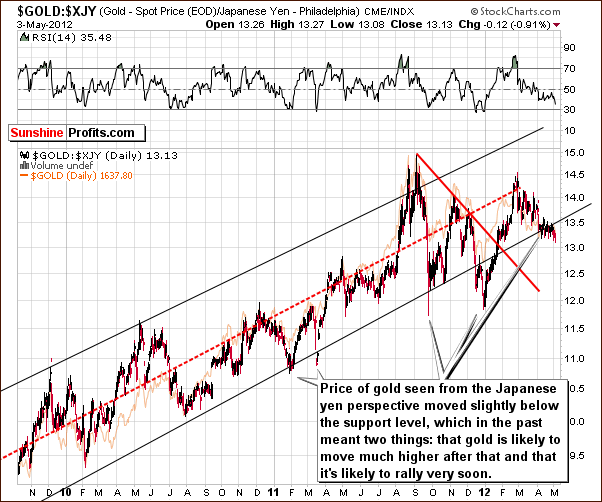
Once again, we have included a look at gold from the Japanese yen perspective. The implications here are bullish. A closer look at the “breakdown” leads us to believe that based upon all past cases, a rally is likely to follow. Furthermore, this rally could very well be significant and also is likely to begin very soon.
Summing up, the situation for gold remains bullish for the short term and long term.
Silver
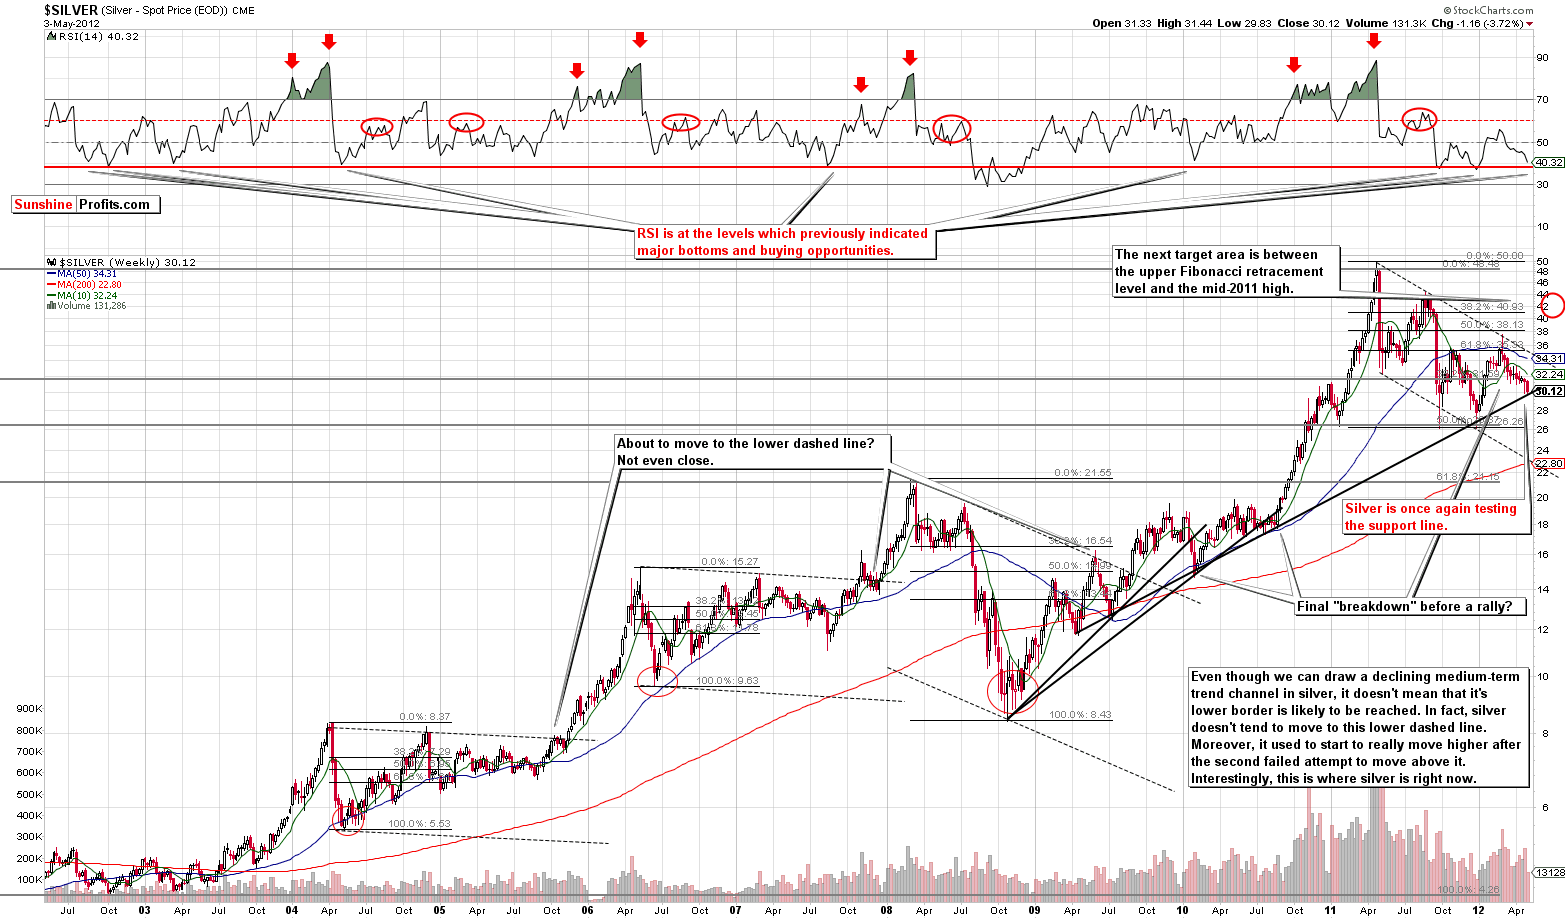
We begin this week’s silver section with a look at silver’s long-term chart (please click the above chart to enlarge). Lower prices were also seen here this week, but silver’s price has not moved below the support line created by several previous local bottoms. For this reason, the overall picture is still bullish, and the long-term remarks made in previous weeks are still up to date. The most important bullish factor is the situation in the gold market itself, though.
Silver usually moves above the declining resistance line (such as the one marked on the chart with a dashed line) on its third attempt which means a successful breakout will likely be seen when silver price’s gets back to this level this time.
The RSI level based on weekly closing prices has nearly always been seen around the current, that is, close to 40 level when silver formed major long-term bottoms, with the one exception being the huge 2008 decline. All other instances coincided with final major bottoms and, of course, favorable buying opportunities. So keep this in mind if you are considering closing long positions in the white metal. We are not advocating such a move at this time.
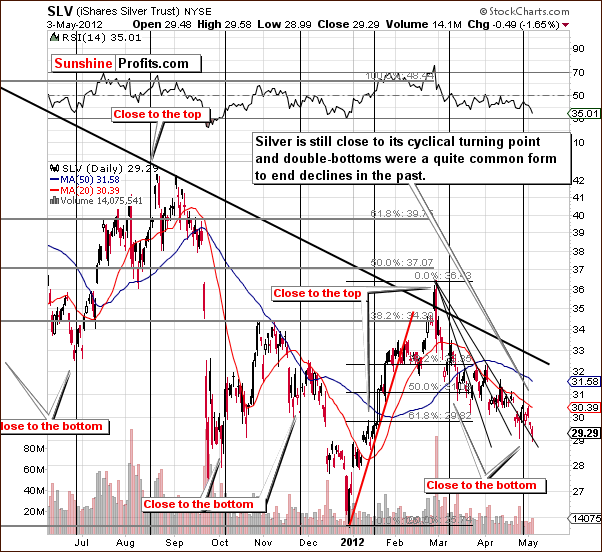
We now turn to silver’s short-term chart. Prices moved lower this week, but with silver still close to a cyclical turning point, higher prices are likely in the coming days. Such a move will be well in tune with previous bottoming patterns. The June 2011 bottom and the September 2011 bottom are good examples of similar patterns.
Summing up, the situation for silver remains bullish even though it appears somewhat unfavorable from a medium-term perspective. There are reasons visible on the silver charts but the most important one is the situation in the gold market.
Gold Mining Stocks
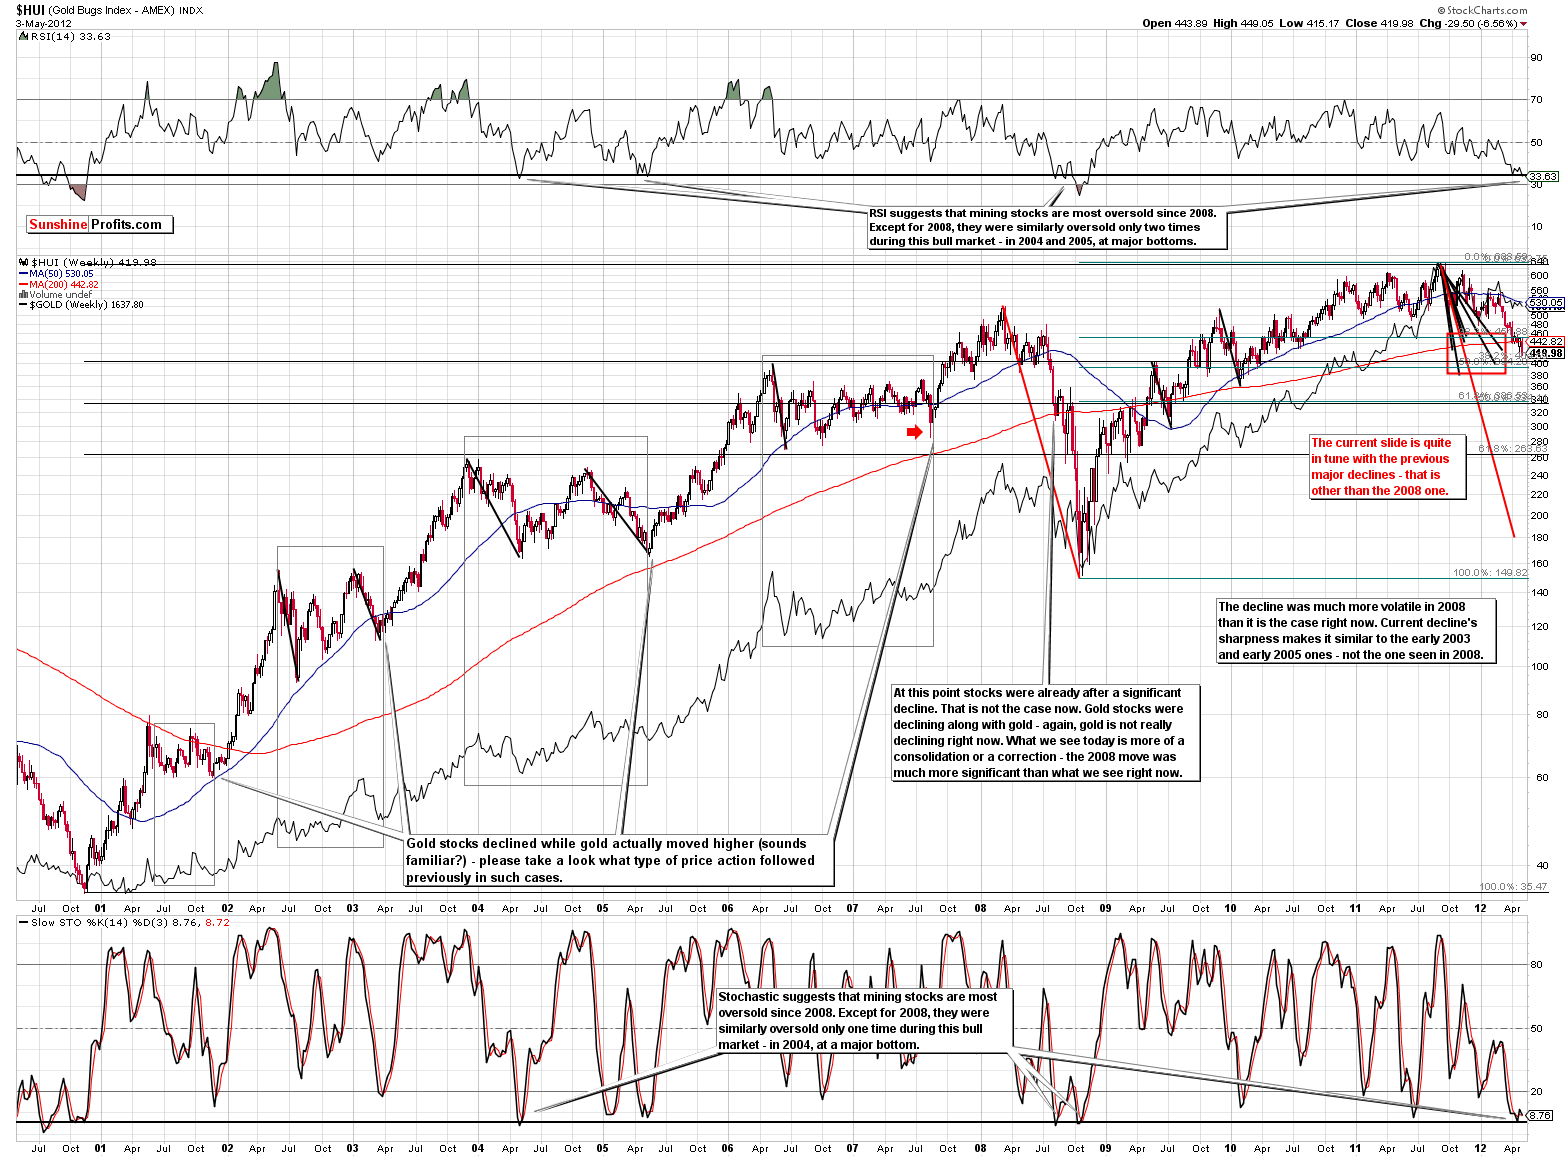
In this week’s long-term HUI Index chart (please click the above chart to enlarge), not much has changed. After the previous short-term rally, prices again moved to the downside approaching previous lows. Current prices levels, however, are very much in tune with the levels reached in previous major declines. Our “run for the hills” target levels were not reached, so we continue to view this situation as extremely oversold and believe that betting on higher prices, not lower, should be considered.
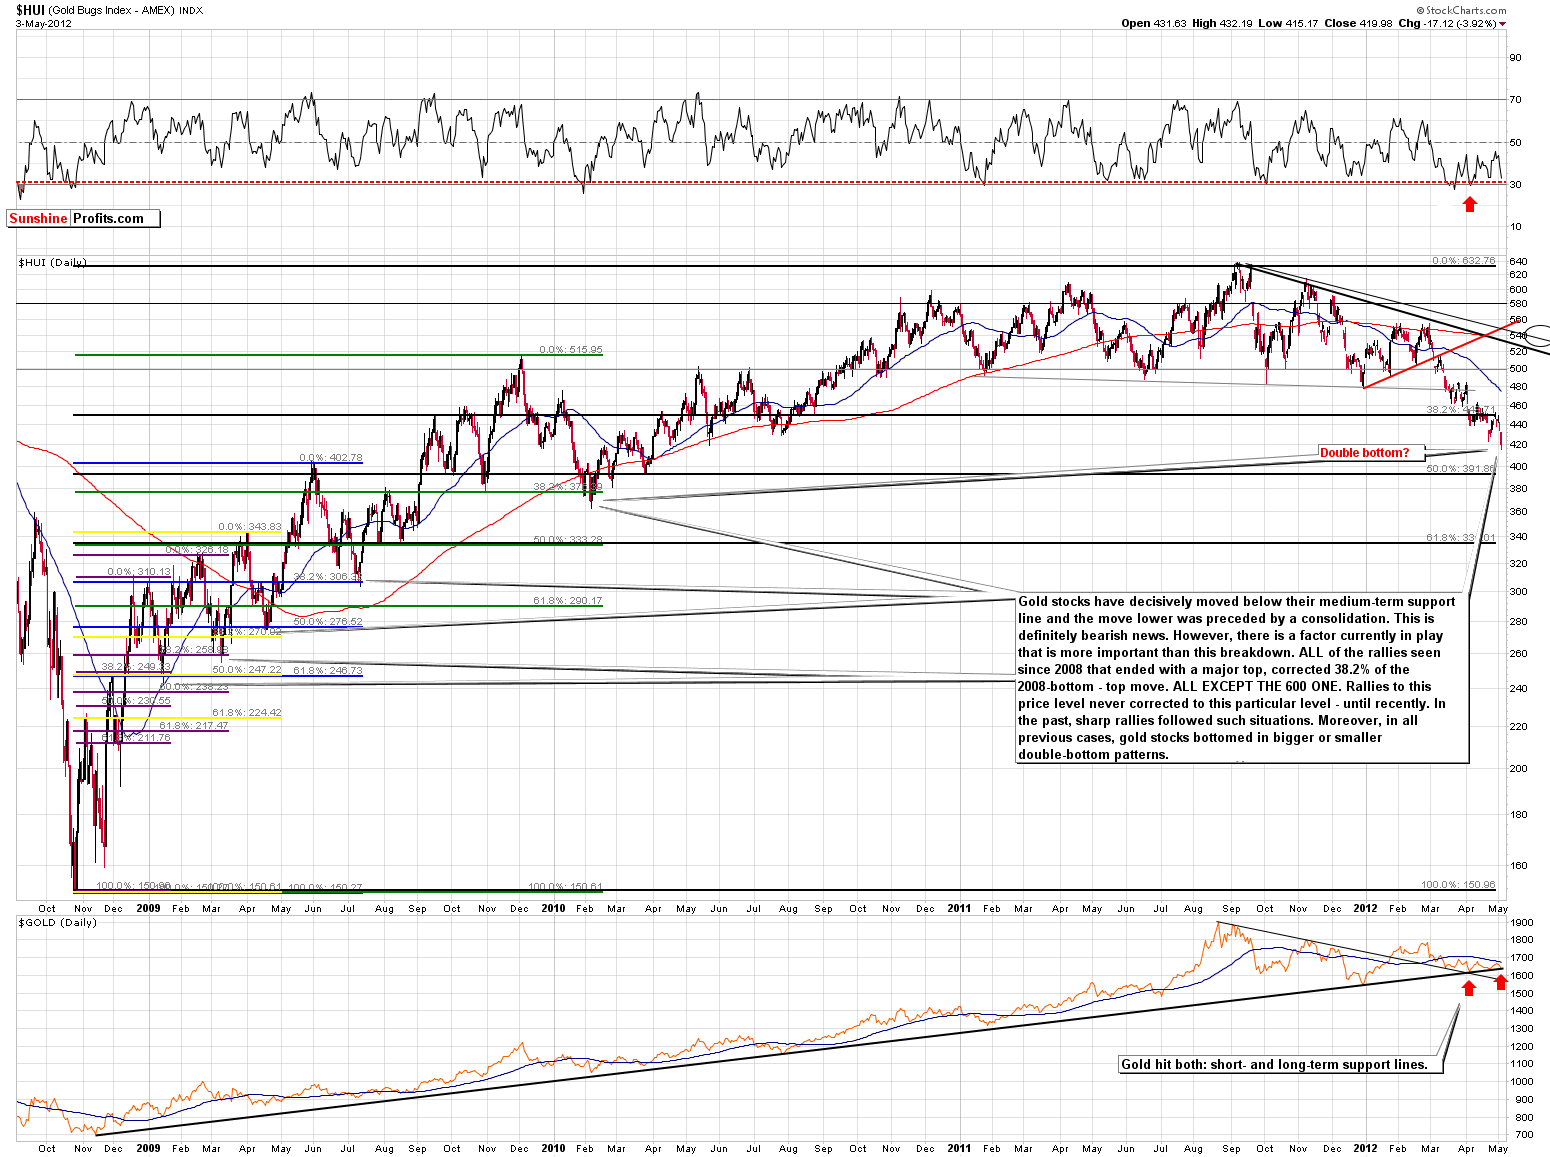
In this week’s medium-term HUI Index chart (please click the above chart to enlarge), the same can be said but this is of course from a shorter term perspective. We are likely seeing a double bottom pattern which has been seen before and has actually been quite a common occurrence in past years.
Summing up, we still view the situation for gold mining stocks as extremely oversold. Long, not short positions should be considered in our view. This is based not only on the long-term HUI Index chart but on gold’s long- and short-term charts as well.
Junior Mining Stocks
As stated in the Key Principles section, the list of top juniors will be updated approximately every 4 weeks, so this is the Update that should contain the revised version of the lists. However, before providing you with up-to-date rankings, let’s take a moment to study the performance of the whole sector and compare to the senior mining stocks.
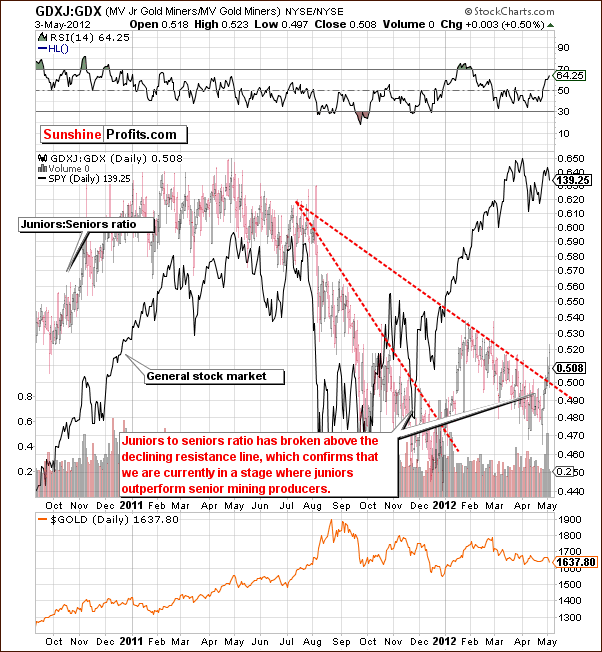
As you can see on the above chart, the juniors-seniors ratio corrected from February to the end of April. We call this correction instead of decline because this 3-month move didn’t erase the previous monthly rally (January 2012). As all corrections come to an end eventually, it seems to be the case also with this one. The ratio moved sharply higher in the recent days and the correction appears to be over as the resistance line has been broken. The implication is that another wave of juniors’ outperformance is likely underway.
There is also another implication of the above chart. Please compare the movement in the ratio to the price of gold (bottom of the chart). The rally in the ratio preceded the significant rally that started at the end of 2011. The top (and start of the above-mentioned correction) preceded the top in gold in the first quarter of this year. Consequently, it could very well be the case that the breakout in the juniors-seniors ratio is heralding the end of correction and subsequent rally in gold.
Let’s take a look at our junior rankings.
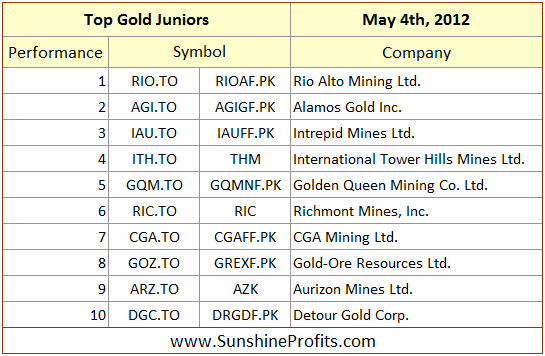
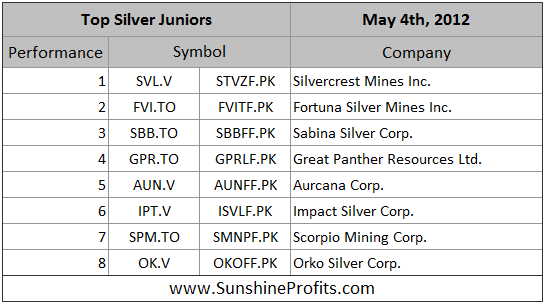
There generally no changes in the silver ranking since we featured it previously and there is only one noteworthy change in the gold ranking – we decided to remove the OceanaGold Corp. because it didn’t perform as well as the rest of featured gold juniors. However, since it “almost qualified” to be included in today’s ranking, we don’t suggest removing it from one’s portfolio if one already owns it. In other words, if you don’t own it now, there’s no need to buy it in our view, but if you do, you don’t need to exit this position either.
Please note that we’ve recently written that we favor junior mining companies to big senior producers. The current bullish case for the general stock market in the medium term makes us continue to believe that this is a good way to approach the mining sector. As you may see in the last 4 rows in this week’s Correlation Matrix, there is a very strong correlation between juniors and main stock indices – consequently, what’s bullish for stocks, is also bullish for juniors.
Letters from Subscribers
Q: In the newsletter analysis, it appears that we could reach a turning point for gold at any time, having seen a double bottom. This means that gold would move up in price, possibly aggressively. Platinum continues to be priced under gold. For gold to move decisively higher, wouldn’t it be a requirement for platinum to move higher than the price of gold first? It seems that as long as platinum is priced below gold, the low price of platinum is acting as an "anchor" on the price of gold.
A: Generally, platinum's price above that of gold is not something that is necessary for a bottom to be formed. In fact, platinum was cheaper than gold at the major 2008 bottom.
Whether platinum is signaling higher gold prices or not is really a matter of perspective. Actually, we already see platinum's outperformance. As strange as it may sound (platinum being approximately $100 cheaper than gold), we would like to stress that it was about $175 cheaper than gold at the beginning of 2012. Plus, we now have a correction in the platinum:gold ratio after a strong move higher (platinum was recently more expensive than gold). In the April 20, 2012 Premium Update we wrote that the [platinum:gold] ratio has rallied sharply since January 1 so a pullback is not all that surprising.
Q: I am currently long on 'paper' silver and platinum (the latter on your advice). My question is whether I should be holding these long assets in physical or perhaps physical backed form and if so what is your recommended vehicle?
A: The answer depends on whether you own silver and platinum for the short- or long-term. We suggested owning platinum for the long term, so the following takes that into account.
We answered a similar question about platinum ETFs on March 16, 2008, so we will quote our previous reply, as it is still relevant as far as selecting an easy-to-use way to own platinum is concerned. We generally prefer physical holdings, but we realize that is not convenient for most investors.
PHPT (ETFS Physical Platinum ETF), in our view, is the best option for those looking for Platinum ETFs – both long-term and short-term. For long term investors, the fact that PHPT is physically backed is reason enough to consider it not only in the platinum space, but as a good instrument in the overall precious metals segment. PHPT has high liquidity and years of market presence. Reasonable costs and tracking error also make PHPT a competitive ETF tool for the precious metals investor. However, for long-term investors, PPLT is a good alternative. PPLT measures the same as PHPT in terms of key attributes such as liquidity and physical backing, but lags behind marginally because it is relatively new and does not boast of the same history and trust as PHPT. For short-term traders tracking error and costs are a drag.
As far as silver is concerned, we strongly suggest physical silver ownership for long-term investments. However, owning "paper" silver (either through derivatives directly or indirectly via ETNs or similar) is preferred for trading purposes.
We believe the following link will also be useful as it includes our comments on being heavily long silver in an electronic way.
Q: I am holding the following options now: GLD JUNJ12 167C, bought at $4.8 on March, 8th and GLD JUN12 165C, bought at $5.65 on March, 9th. The prices are now, respectively, $0.83 and $1.25, so the loss is significant. I am thinking of closing these positions as the chance of having some gains is quite low now when the price of gold has gone nowhere for the last 2 months and doesn't show any signs of life.
A: Given the above-mentioned entry price, in order for the June 167 call options to be profitable we would need to see GLD above $171.8 (taking the intrinsic value into account and conservatively disregarding the time value). That is considerably higher than where GLD is right now when we remember that the price of gold is more or less where it was over a month ago. However, if we take into account the reverse head-and-shoulders pattern and the fact that prior to the March - today consolidation gold rallied significantly, the following rally becomes much more likely.
All in all we currently see the probability of GLD moving above $171.8 before the expiration of June 2012 options at 70%.
Q: Which product are you referring to for speculative positions in your PUs? According to this - http://www.sunshineprofits.com/key_principles/options -it's options,right? The problem is that options lose value with time and so do our investments. Or do you mean other products?
A: As far as the speculative positions are concerned, there is no recommended product. We do like options as a speculative vehicle as they provide leverage and at the same time will not make one vulnerable to margin calls during volatile moves (which would be the case with futures or CFDs). However we acknowledge that these derivative instruments are not suitable for everyone. Generally, most who are not experienced traders should not really use them as they are likely to buy too much of them, and excessively large speculative positions lead to losses. The disadvantage that you mentioned is options' time decay - it can be managed by using our Position Size Calculator, but again that's not easy for non-pros (at least not yet as we haven't introduced instructional videos to our tools so far).
All in all, most traders will likely be happy with ETFs and ETNs. Naturally, physical ownership is preferred for long-term investments, but for short-term trades these are fine.
Summary
The precious metals markets did not perform very well this week. There appears to be a good reason, however. The pullback in the USD Index has taken the dollar to the previously broken support line which is now a resistance line. As the breakdown below this line will likely be confirmed, lower index levels are likely ahead and therefore higher precious metals prices are probably in the cards.
The recent small move to the upside in the USD Index was seen after a cyclical turning point and its impact has therefore already been felt and is no longer of any significant concern. The days ahead should be affected only slightly if at all.
The general stock market situation is rather bullish based mainly on the signals from the long-term S&P 500 Index chart. Similarities to 2010 and a consolidation of RSI levels are the main contributing factors here.
The situation for gold is not bearish contrary to what one might infer based on the analysis of the last 3 trading days. The current decline created a symmetrical shoulder in a reverse head-and-shoulders pattern. If the symmetry continues, gold could rally quite soon, possibly early next week. Silver and mining stock prices would likely follow suit and rally as well.
The target levels stated in recent weeks are unchanged except the ones for mining stocks. They are as follows: slightly above $1,900 for spot gold, $40 to $45 for spot silver, 540 for the HUI Index, and $53 for the GDX ETF. We currently view the probability of an upswing in gold (instead of a confirmed move below $1,600) at 75%. We believe that the rally to these levels will take approximately 2 months from the day we have a confirmation that it has started. We expect to see this confirmation next week.
This completes this week’s Premium Update. Our next Premium Update is scheduled for Thursday, May 10, 2012, a day earlier than usual.
Thank you for using the Premium Service. Have a profitable week and a great weekend!
Przemyslaw Radomski

