

Please note that due to market volatility, some of the key levels may have already been reached and scenarios played out.
Trading positions
- WTI Crude Oil [CLF22] Long around $75.25-76.22 support (yellow band) with targets at $79.37 / $82.24 and stop just below $73.43 (previous swing low) – See chart
- Natural Gas [NGZ21] No position currently justified on a risk-to-reward point of view.
By the way, have you read my last article about commodity currencies? Let me know what you would like to learn more about regarding that hybrid (commodities/FX) topic, so I will do my best to emphasise on some of your suggestions in my future posts!
Trade Plan Review
Since the market has been facing further downward pressure, also induced by a stronger US dollar and the recent threats of a coordination with several countries to draw into their strategic oil reserves: USA, China and now Japan. Indeed, Japanese Prime Minister Fumio Kishida said on Saturday that his government was considering drawing on oil reserves in response to rising crude prices. Since Japan sources most of its oil from the Middle East, the recent surge in prices and the decline of the yen have pushed up the cost of imports for the Nipponese archipelago. As a reminder, last week I anticipated a lower dip that would take place onto the $75.25-76.22 yellow band. The recommended objective would be the $79.37 and 82.24 levels. My recommended stop would be located on the $74.42 level (below both previous swing low from 7-October and previous high-volume node and volume point of control (VPOC) from September). Alternatively, you could also eventually use an Average True Range (ATR) ratio to determine a different level that may better suit you. For now, that dip did happen Friday around that support area (likely to become a demand zone) where we might see some ongoing accumulation for the forthcoming hours. Now, we can observe a doji formation(candlestick figure), and more precisely a long-legged doji happening on the daily chart, which is generally synonymous with indecision.
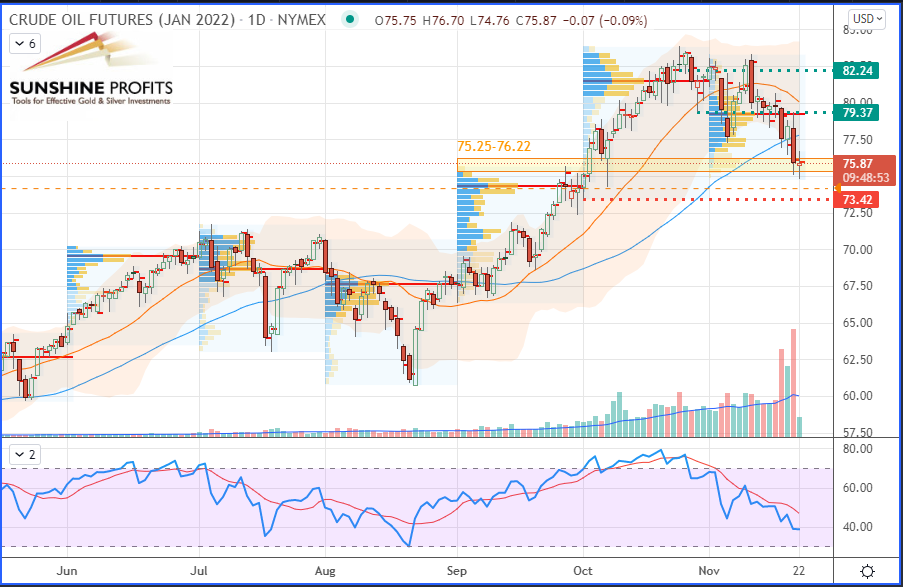
WTI Crude Oil (CLF22) Futures (January contract, daily chart)
To visualise how the price action is currently developing, let’s zoom into a 4H chart, where we have a much clearer downtrend taking place:
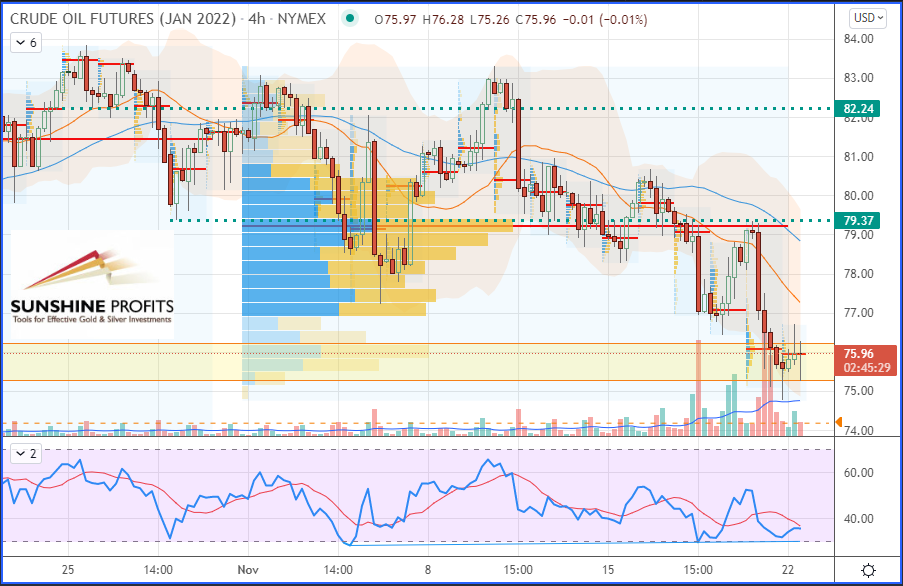
WTI Crude Oil (CLF22) Futures (January contract, 4H chart)
So, as you can see, even on that lower timeframe we have a doji formation, where the bulls are trying to take over the bears to push the market towards higher floors. So let’s see where this is going to end up… Will the current 4H downtrend extend lower or will the longer-term (daily) uptrend resume its rally?
That’s all folks for today. Happy trading!
As always, we’ll keep you, our subscribers well informed.
Thank you.
Sebastien Bischeri
Oil & Gas Trading Strategist

