

Trading position (short-term; our opinion): No positions are justified from the risk/reward perspective.
On Tuesday, crude oil continued its rally and gained 2.79% as the combination of the EIA forecast, tensions in Yemen and a weaker greenback pushed the price higher. Thanks to these circumstances, light crude broke above important resistance lines, opening the way to the Feb highs. Will the commodity climb above them in the coming days?
Yesterday, the U.S. Energy Information Administration said that domestic shale oil output was expected to fall by 57,000 barrels per day to 4.98 million bpd in May (which would be the first monthly decline in over four years), which supported the price. Additionally, ongoing tensions in Yemen weighed on oil investors’ sentiment, fueling worries that a civil war in the country could destabilize Saudi Arabia (its northern neighbor) and limit oil exports out of the Bab el-Mandeb strait, which pushed the commodity higher. On top of that, disappointing U.S. data (retail sales rose 0.9% in March, disappointing expectations for a 1.0% gain) raised concerns over the strength of the economy, weakening the greenback and making crude oil more attractive for buyers holding other currencies. Thanks to these circumstances, light crude extended gains and broke above important resistance levels. What does it mean for the commodity? (charts courtesy of http://stockcharts.com).
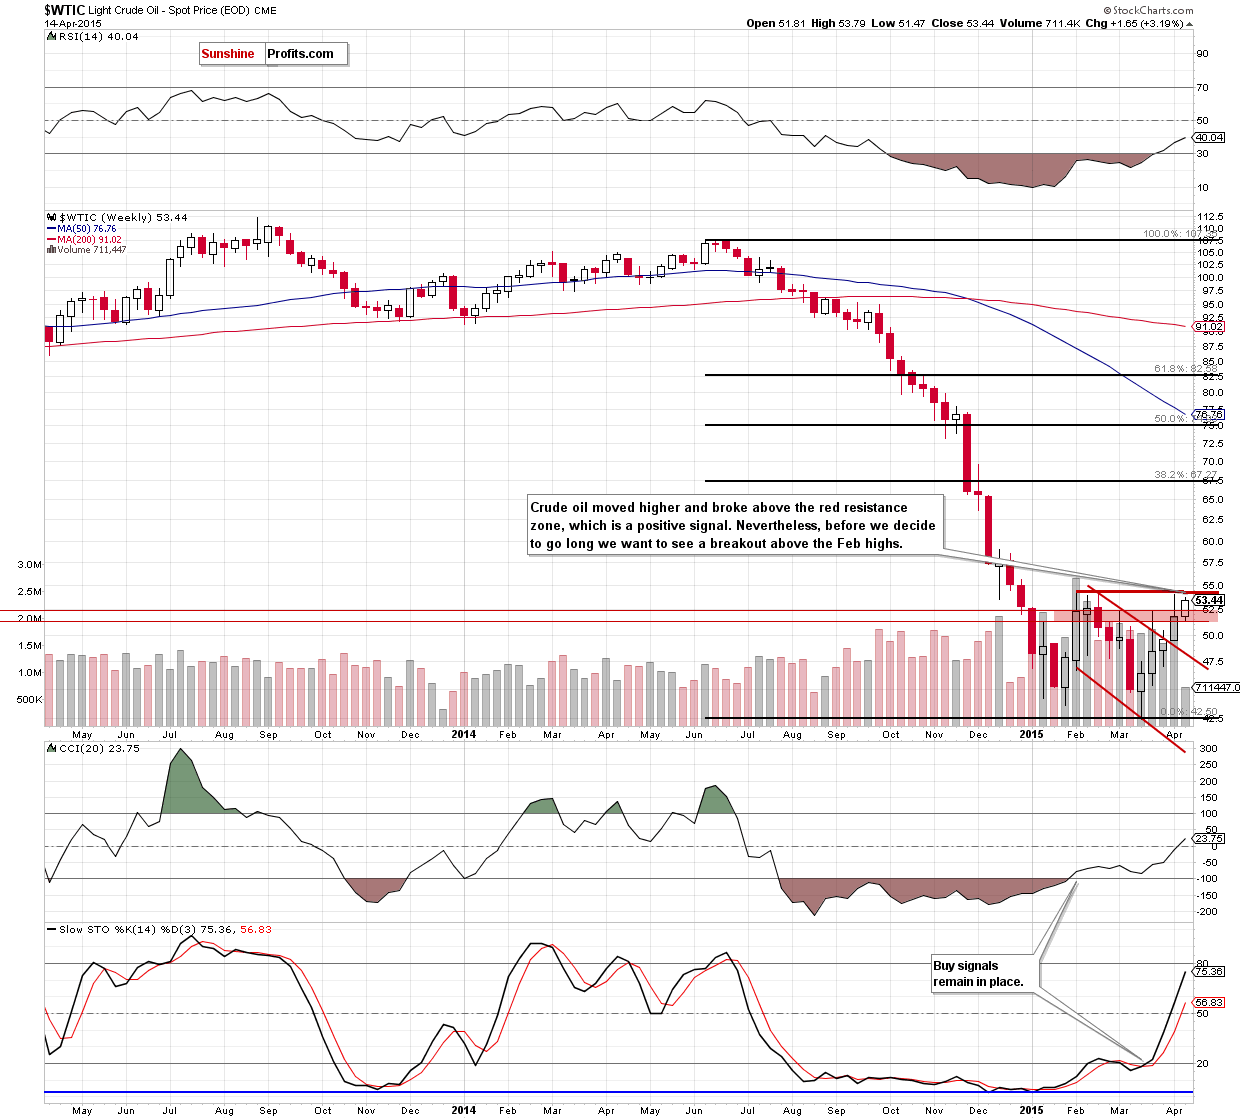
The first thing that catches the eye on the above char is a breakout above the red resistance zone (created by the 76.4% and 78.6% Fibonacci retracement levels). Although this is a bullish signal, we saw similar price action in the previous week. Back then, the resistance zone based on the Feb highs ($54.15-54.24) stopped further improvement. Therefore, before we decide to go long we want to see a successful breakout above these levels.
What could happen if we see such increase? We believe that the best answer to this question will be the quote from our Oil Trading Alert posted on Apr 8:
(…) There’s no significant resistance all the way up until the first of the classic Fibonacci retracement levels, which is much higher than the current crude oil price. Moreover, since the previous move lower was very sharp, we can expect a move back to be sharp as well. Consequently, paying extra attention to the crude oil market in the following days should be worth it.
Once we know the medium-term picture, let’s examine the daily chart and find out how this increase influenced the very short-term outlook.
In our previous Oil Trading Alert, we wrote the following:
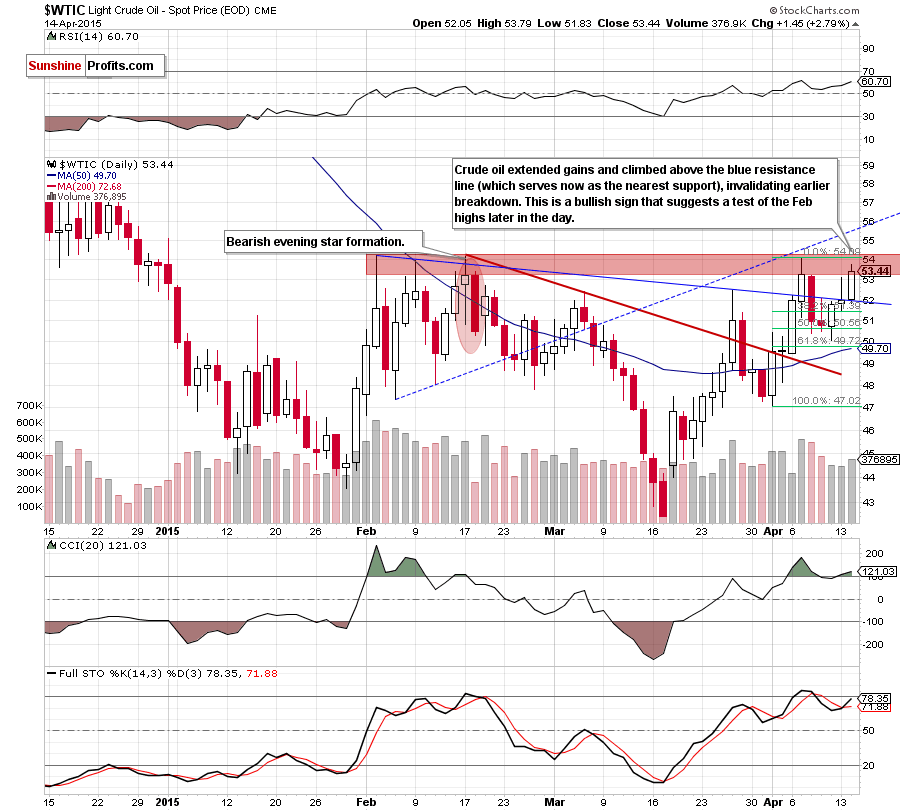
(…) taking into account the fact that crude oil remains above the 38.2% Fibonacci retracement (based on Apr rally), it seems that oil bulls will try to push the commodity higher in the coming day. If this is the case, the initial upside target would be around $53.10-$53.23, where the recent highs are.
As you see on the daily chart, the situation developed in line with the above scenario and crude oil moved sharply higher. With this upswing, light crude climbed above the blue resistance line (which serves now as the nearest support), invalidating earlier breakdown. This is a bullish signal, which suggests further improvement and a test of the Feb highs later in the day.
Nevertheless, at this point, it is worth noting that the size of volume that accompanied yesterday’s increase was smaller than a week ago, which doesn’t confirm that oil bulls are strong enough to break the key resistance levels. Additionally, there are negative divergences between the CCI, Stochastic Oscillator and the commodity (please note that in the first half of February similar divergences in the CCI preceded bigger declines and a fresh 2015 low). Therefore, we are convinced that until crude oil moves above the Feb 2015 high, the outlook will not become bullish enough to justify opening long positions in crude oil.
Summing up, crude oil climbed above the red resistance zone and the blue line, which is a bullish signal, but not bullish enough to justify opening long positions at the moment. Nevertheless, taking the above facts into account, we think that the commodity will test of the Feb highs later in the day.
Very short-term outlook: mixed
Short-term outlook: mixed
MT outlook: mixed
LT outlook: bullish
Trading position (short-term; our opinion): No positions are justified from the risk/reward perspective at the moment, but we will keep you informed should anything change.
Thank you.
Nadia Simmons
Forex & Oil Trading Strategist
Przemyslaw Radomski, CFA
Founder, Editor-in-chief
Gold & Silver Trading Alerts
Forex Trading Alerts
Oil Investment Updates
Oil Trading Alerts

