

Today, we begin this Oil Investment Update with the words that we used to summarize the situation in the previous update (on Nov 5, 2015). We summarized the situation in the following way:
(...) light crude reversed (...) and climbed to the key resistance lines. Taking this fact into account, and combining it with a potential head and shoulders formation (marked on the long-term chart) and the current position of the above ratios, which remains under important resistance levels (in all cases their reversals and declines will translate to lower values of crude oil), we believe that reversal and lower prices of light crude are just around the corner (especially if the commodity successfully drops under key support zone).
Additionally, we included a bearish scenario for the following weeks:
If the commodity declines below the blue support zone (based on the Jan lows) and the blue support line, the current declines will accelerate and we’ll see a test of $40. If it is broken, the next target for oil bears would be the Aug low of $37.75 or even around the support zone based on the Dec 2008 and Jan 2009 lows (around $35.13-$35.52).
Looking at the charts from today’s point of view, we see that the situation developed in line with the above scenario and crude oil reached our downside targets after the Organization of the Petroleum Exporting Countries decided to maintain current production levels at around 31.5 million barrels per day. Additionally, Friday’s bullish job report (which showed that the U.S. economy added 211,000 jobs in the previous month, beating analysts’ forecasts) increased expectations that the Fed will hike interest rates at its upcoming meeting, which pushed the USD Index above 98, making crude oil more expensive for buyers holding other currencies. Will we see further deterioration in the coming weeks? Let’s jump right into charts (chart courtesy of http://stockcharts.com) and try to find the answer.
Crude Oil
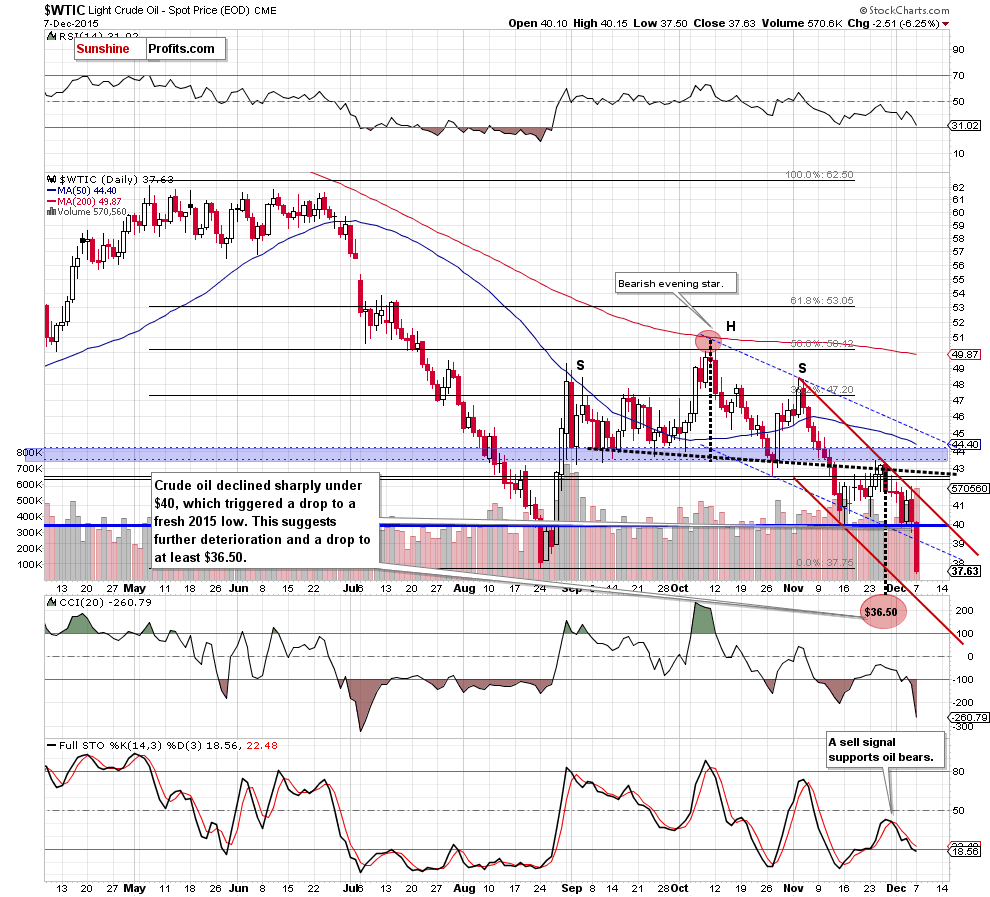
The first thing that catches the eye on the daily chart is a head and shoulders formation. As you see on the chart, last week’s upward move took light crude to slightly above the black dashed resistance line. Despite this improvement, oil bulls didn’t manage to push crude oil higher, which showed their weakness and resulted in an invalidation of the small breakout. As a result, light crude extended losses and slipped under $40 in the previous week. Although the commodity rebounded in the following days, the red declining resistance line (based on the Nov highs) stopped further improvement and triggered another decline to the barrier of $40.
Yesterday, oil bears pushed the commodity lower, which resulted in a breakdown under this key support level. This negative event triggered a sharp decline, which took light crude below the Aug low. This is a bearish signal, which suggests that our next downside target (around $36.50, where the size of the downward move will correspond to the height of the head and shoulders formation) would be in play in the coming day(s).
What impact did this decline have on the medium-term picture? Let’s check.
A month ago, we wrote the following:
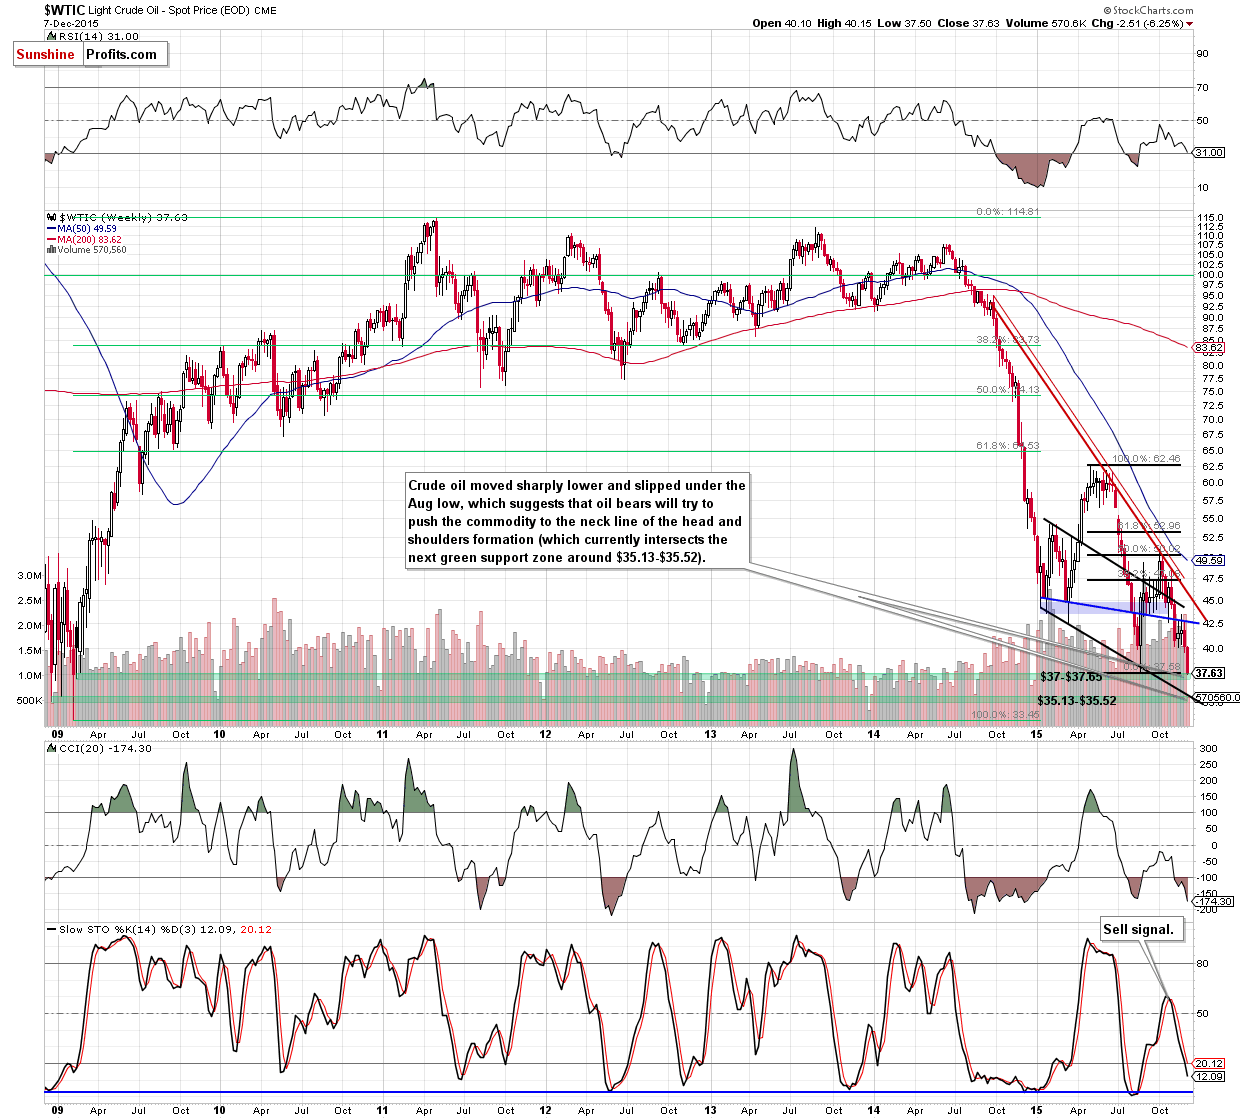
(…) light crude increased to the red declining resistance line earlier this week. Despite this upward move, this key resistance line was strong enough to stop further rally (similarly to what we saw in the previous month), which resulted in a pullback. With this downswing, light crude invalidated small breakouts above the red line (a bearish signal), which suggests further deterioration.
How low could the commodity go? In our opinion, the initial downside target would be the blue support line (currently around $43.81). If this key support is broken, we’ll likely see an acceleration of declines and a drop to (at least) $40.57-$40.86, where the next support area (created by the 76.4% and 78.6% Fibonacci retracement levels) is. If this support is broken, we’ll see a test of the Aug lows.
From today’s point of view, we see that the situation developed in line with the above scenario and crude oil not only tested the Aug low, but also hit a fresh multi-year low of $37.50. What’s next? With yesterday’s decline the commodity reached the upper green support zone marked on the above chart. If it is broken, we’ll see further deterioration and a drop to the lower green zone around $35.13-$35.52. At this point, it is worth noting that in this area is also the neck line of the head and shoulders formation (marked with black), which could encourage oil bulls to act and pause the downward move.
What could happen if crude oil declines below it? Let’s take a closer look at the long-term chart and find out.
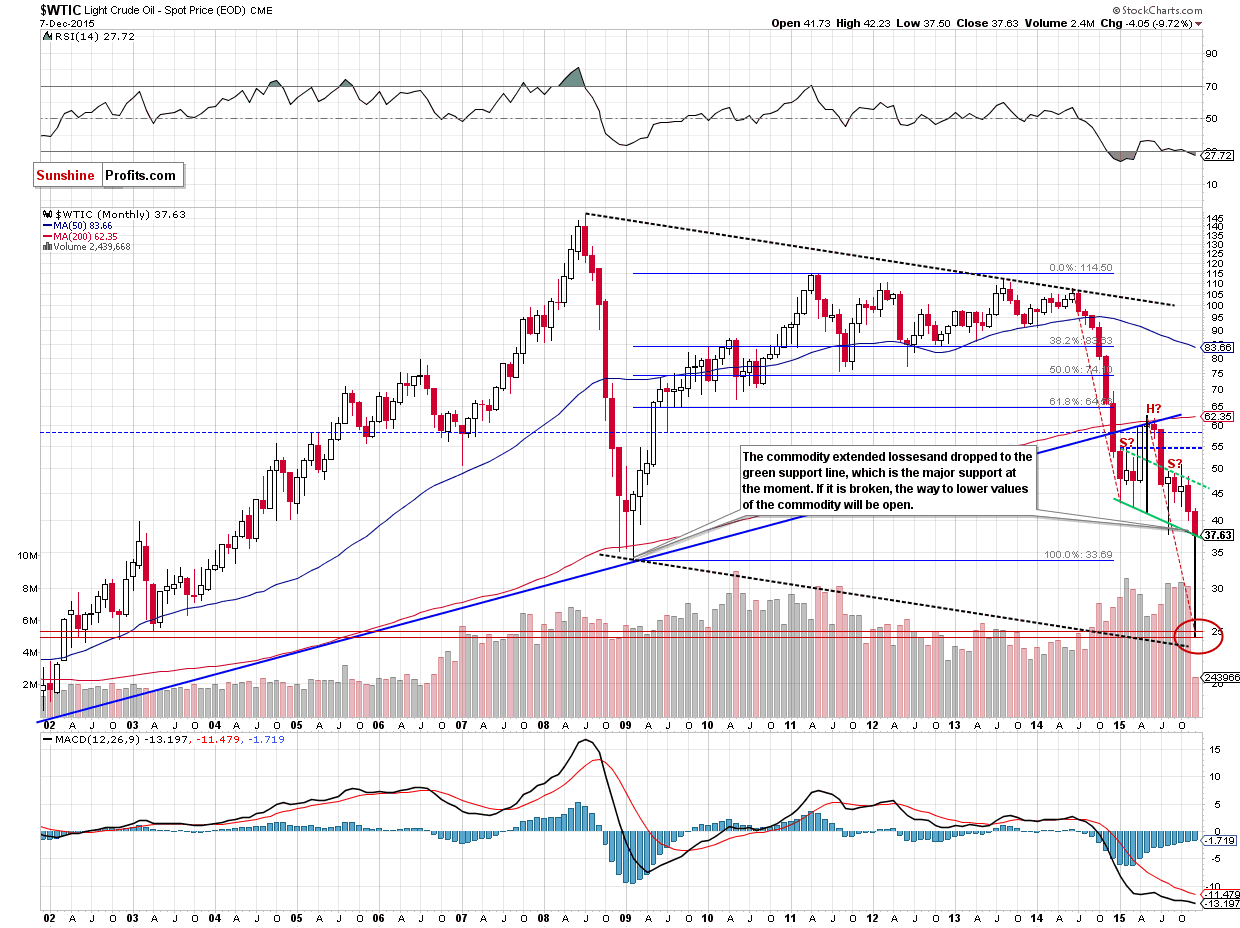
If crude oil extends losses and breaks under the green support line (the neck line of the formation), we’ll see not only fresh 2015, but also further deterioration, which could took the commodity even to $25.
Why? We believe that the best answer to this question will be the quote from our Oil Trading Alert posted on Sep 9:
- The breakdown below the key long-term rising support line (marked with blue) was confirmed and verified – this year’s rally didn’t take crude oil back above it – the line proved to be strong resistance. This by itself doesn’t imply a target level at a certain point, but it strongly suggests that crude oil has to fall much lower, before the decline is over.
- The symmetry of major declines: the 2008 slide is the only decline that is really similar to the current one, and in order for this similarity to be upheld (history repeats itself to a considerable extent), crude oil would have to move even a bit below $25. On the above chart you can see that in the form of the declining dashed black lines.
- The symmetry between the 2014 slide and the (likely) current decline. This year we have definitely seen some kind of consolidation (which might still turn out to be a bottom, but that is unlikely in our view) and the move that follows a consolidation is very often similar to the one that preceded it. If you look at the red dashed declining lines on the above chart you’ll notice that for the previous decline to repeat, crude oil would have to move to about $25.
- Speaking of the consolidation, it’s taking the form of a head-and-shoulders pattern and once / if the pattern is completed, we will have a pattern-based target at around $25. The reason is that once price breaks below the “neck level”, it’s likely to decline as much as the size of the “head” in the pattern.
- The late-2002 and 2003 bottoms create strong support at those levels.
The amount of signals that points to $25 as the most likely target is uncanny, which makes it quite reliable.
Yes, there also are the 2008 and 2009 lows, but generally not much (if anything) confirms them as a major target, so they might not be able to generate anything more than a short-lived bounce (if anything at all).
Please keep in mind that the above is what we believe as most likely based on today’s prices.
Summing up, crude oil declined sharply and hit a fresh 2015 low, which suggests that further deterioration is more likely than not. Therefore, short positions (which are already profitable as we opened them when crude oil was trading around $46.69) continue to be justified from the risk/reward point of view.
Having discussed the situation in crude oil, let’s examine the NYSE Arca Oil Index (XOI) to find out what the current outlook for oil stocks is.
Oil Stocks
Quoting our previous Oil Investment Update:
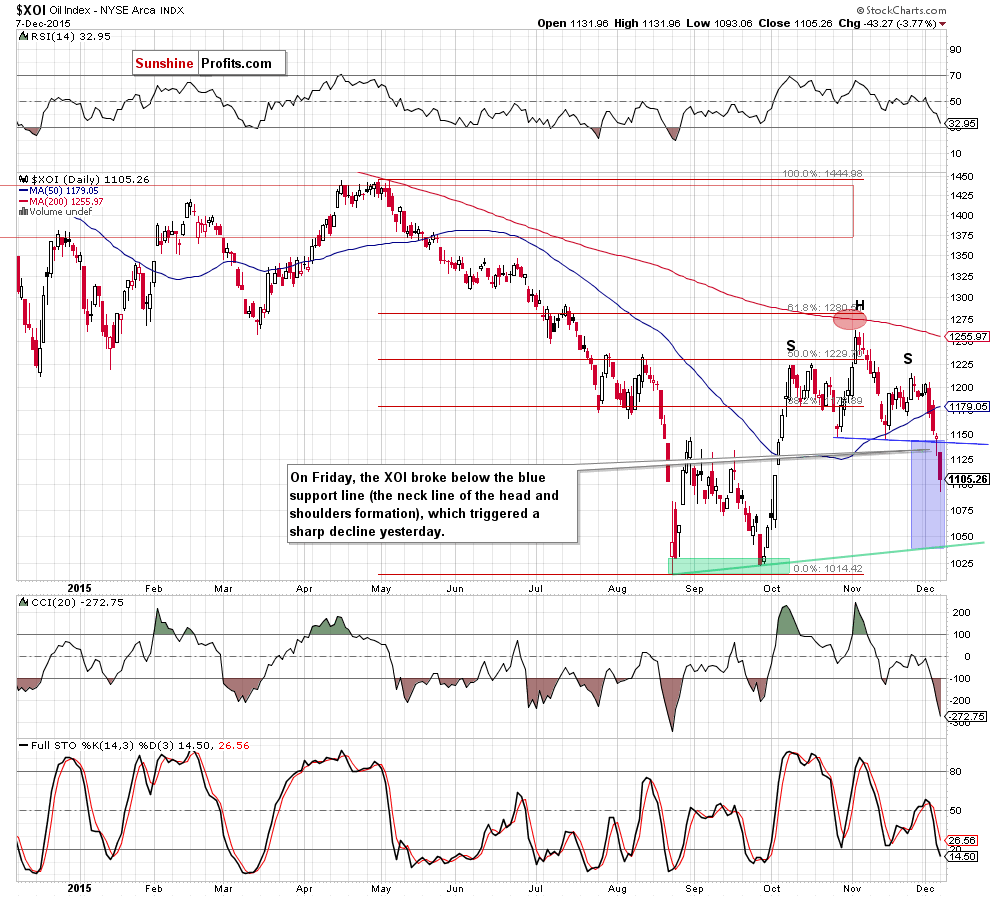
(…) the XOI approached the resistance area (created by the 61.8% Fibonacci retracement and the 200-day moving average), which could trigger a corrective pullback in the coming days (especially if the CCI and Stochastic Oscillator generate sell signals).
On the daily chart, we see that the situation developed in line with the above scenario and oil stocks reversed, triggering sharp declines. With this downward move, the XOI dropped under the 50-day moving average, which encouraged oil bears to act and resulted in a decline below the blue support line – the neck line of the head and shoulders. This bearish event pushed the index sharply lower yesterday, which suggests that we may see a decline even to around 1,040, where the size of the correction will correspond to the height of the formation.
Are there any technical factors that could hinder the realization of the above scenario? Let’s examine the weekly chart and find out.
A month ago, we wrote:
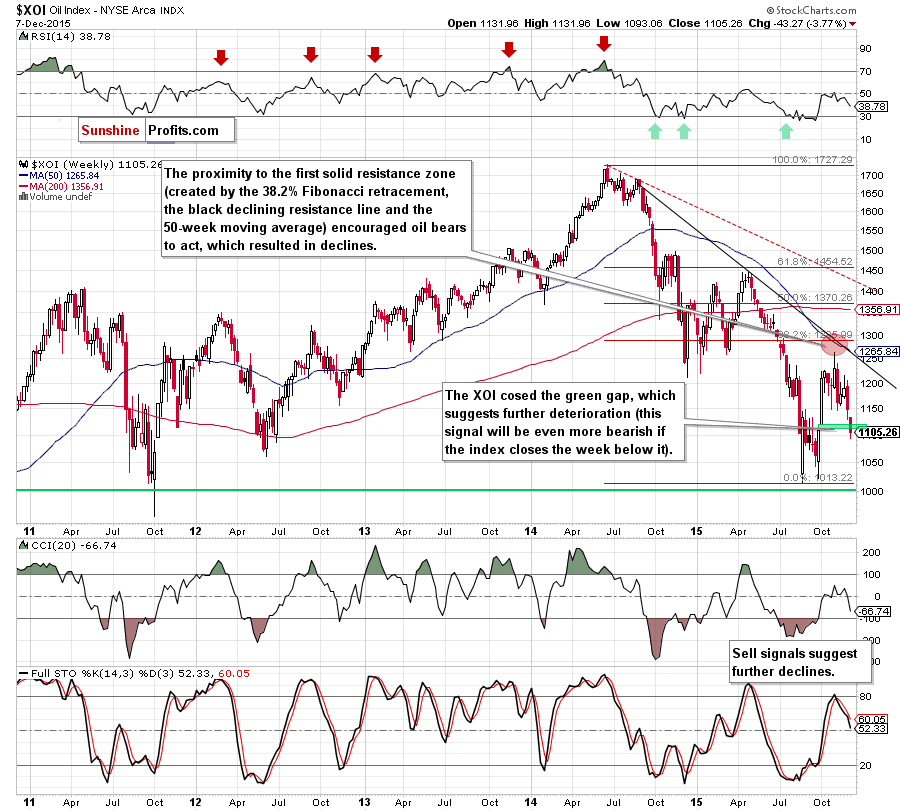
(…) the XOI approached the first solid resistance zone (created by the 38.2% Fibonacci retracement, the black declining resistance line and the 50-week moving average), which suggests that the space for further rally may be limited and reversal in the coming week(s) should not surprise us.
From this perspective that oil bears pushed oil stocks lower as we had expected. With this downward move, the XOI dropped below 1,100 and closed the green gap which suggests further deterioration. Nevertheless, this signal will be more bearish if the index closes the week below it.
Having said that, let’s focus on the long-term perspective.
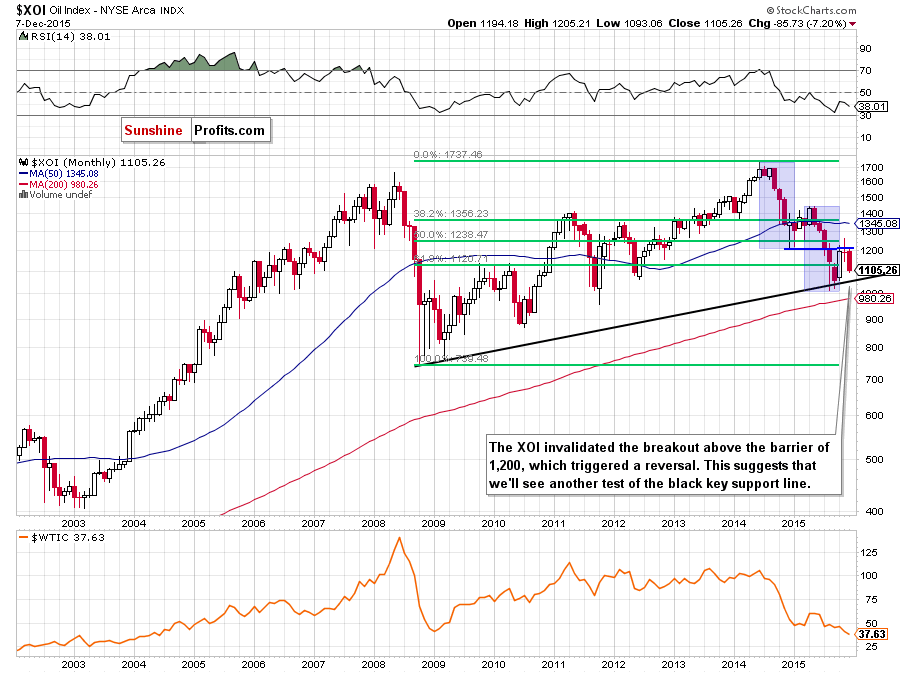
On the monthly chart, we see that the XOI invalidated the breakout above the barrier of 1,200, which triggered a reversal. This negative signal confirms that further deterioration is just around the corner and suggests another test of the black key support line in the coming month.
Summing up, oil stocks declined sharply below the neck line of the head and shoulders formation (marked o the daily chart), which suggests further deterioration and a re-test of the black key support line in the coming month.
Ratio Analysis
Once we know the current situation in crude oil and oil stocks, let’s focus on the relationship between them. What can we infer from the chart below?
A month ago, we wrote the following:
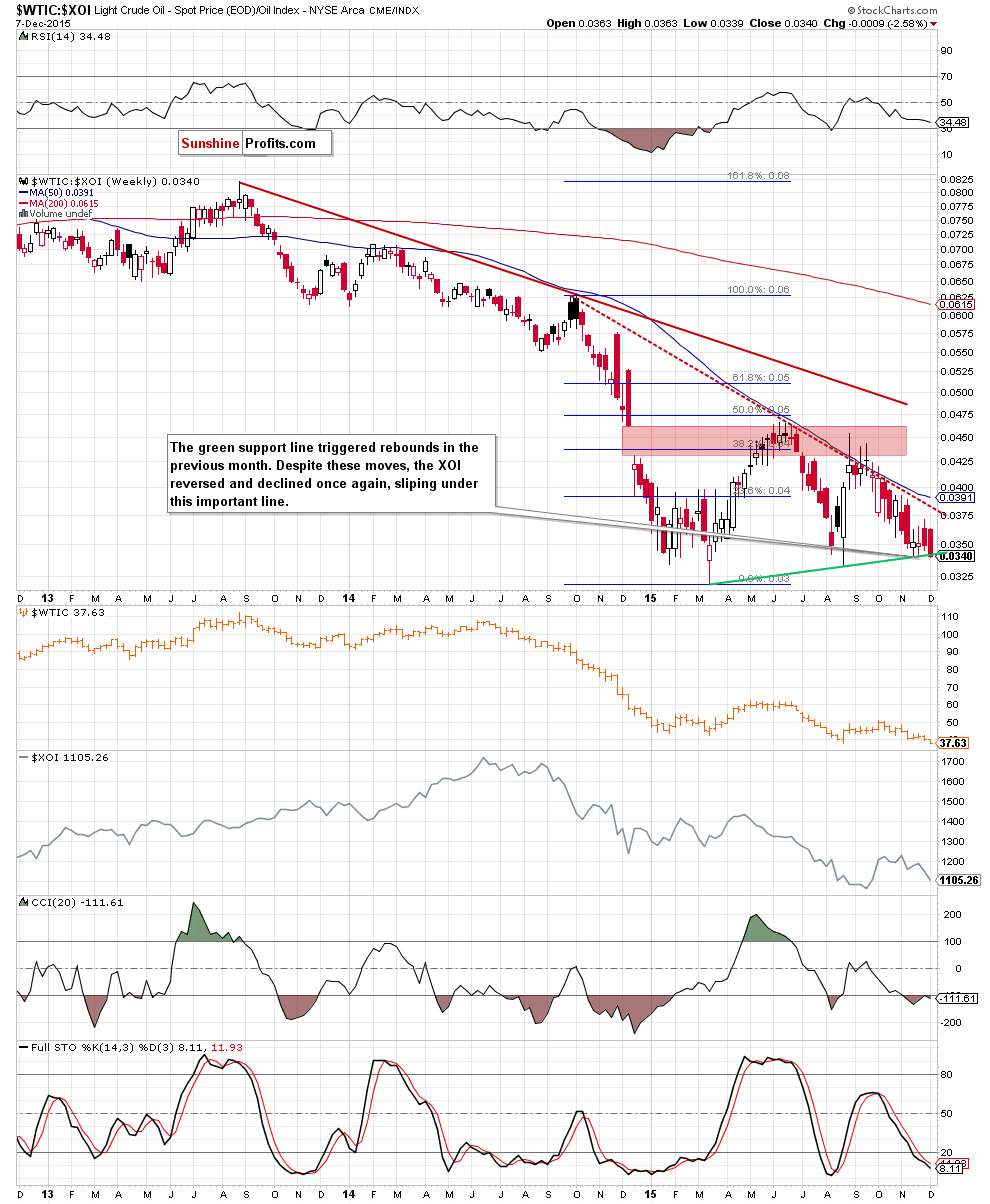
(…) the red gap in combination with the 38.2% Fibonacci retracement (based on the Oct-Mar declines) triggered a decline, which took the ratio below the red dashed declining resistance line and the 50-week moving average (at the same time, light crude moved lower and hit the Oct low of $42.58). The last two weeks brought a small rebound (in the ratio and crude oil), but the ratio still remains under the key resistances, which suggests that even if we see another upswing from here, the space for gains is limited and reversal is just around the corner. What does it mean for crude oil? Based on price action that we have seen in the past, we think that lower values of the ratio will translate to a pullback in light crude – similarly to what we saw in June, at the turn of Sep and Oct and also in Feb 2014.
Looking at the above chart we see that the situation developed in line with the above scenario and the ratio extended losses, slipping to the green support line based on the Mar and Aug lows. As you see on the weekly chart, this solid support line was strong enough to stop declines in the previous weeks, which suggests that we may see similar price action in the coming week. Nevertheless, a sell signal generated by the Stochastic Oscillator suggests that lower values of the ratio can’t be ruled out. Therefore, a potential breakdown would be a very negative signal, which could trigger a test of the Aug or even the March low and result in further deterioration in crude oil.
Having said the above, let’s analyze the oil-to-gold ratio.
Quoting our previous update:
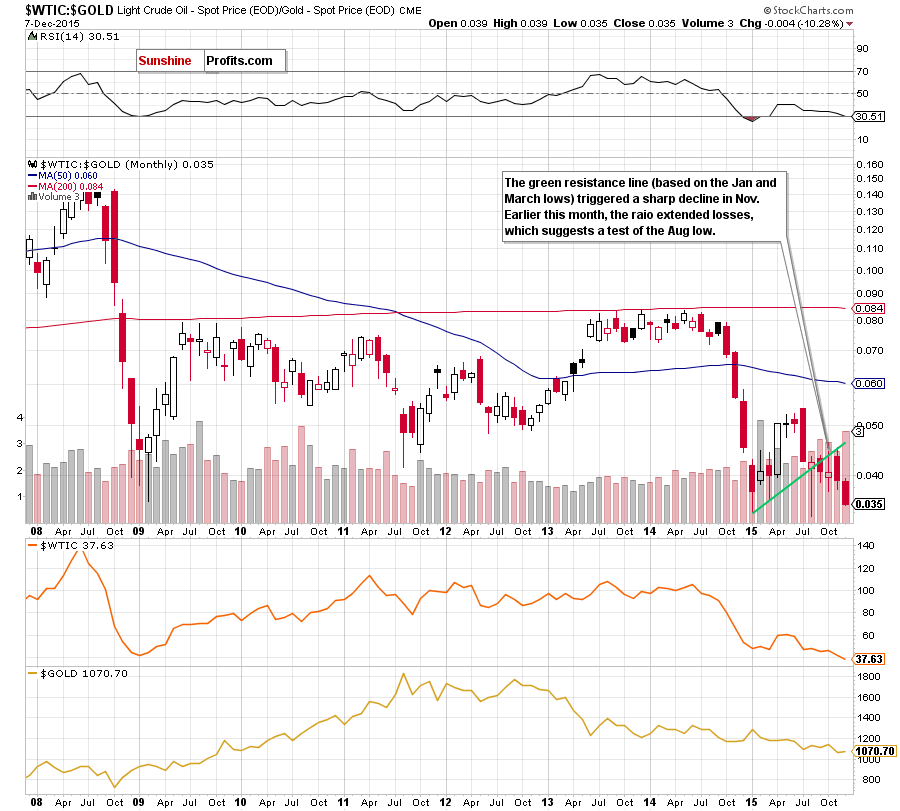
(…) the ratio extended the previous month’s rebound and approached the green resistance line (based on the Jan and March lows), which suggests that we may see a reversal from here – similarly to what we saw in Oct.
On the monthly chart, we see that the ratio reversed (as we had expected) and declined sharply, which resulted in similar sharp decline in crude oil. What impact did this downward move have on the medium-term chart? Let’s check.
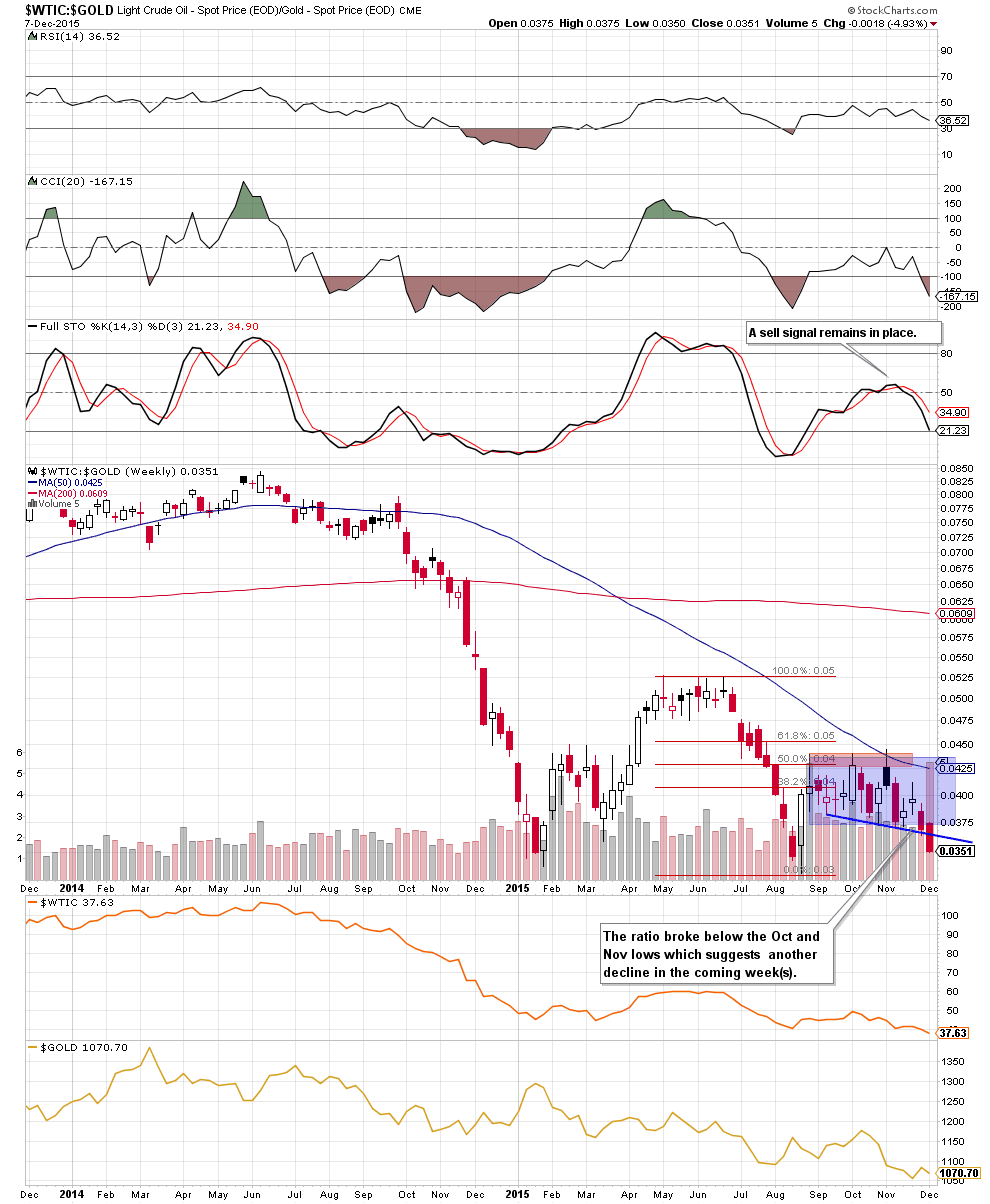
From this perspective, we see that the ratio broke below the Oct and Nov lows (and the blue support line based on them), which suggests another decline in the coming week – especially when we factor in the situation in the short term.
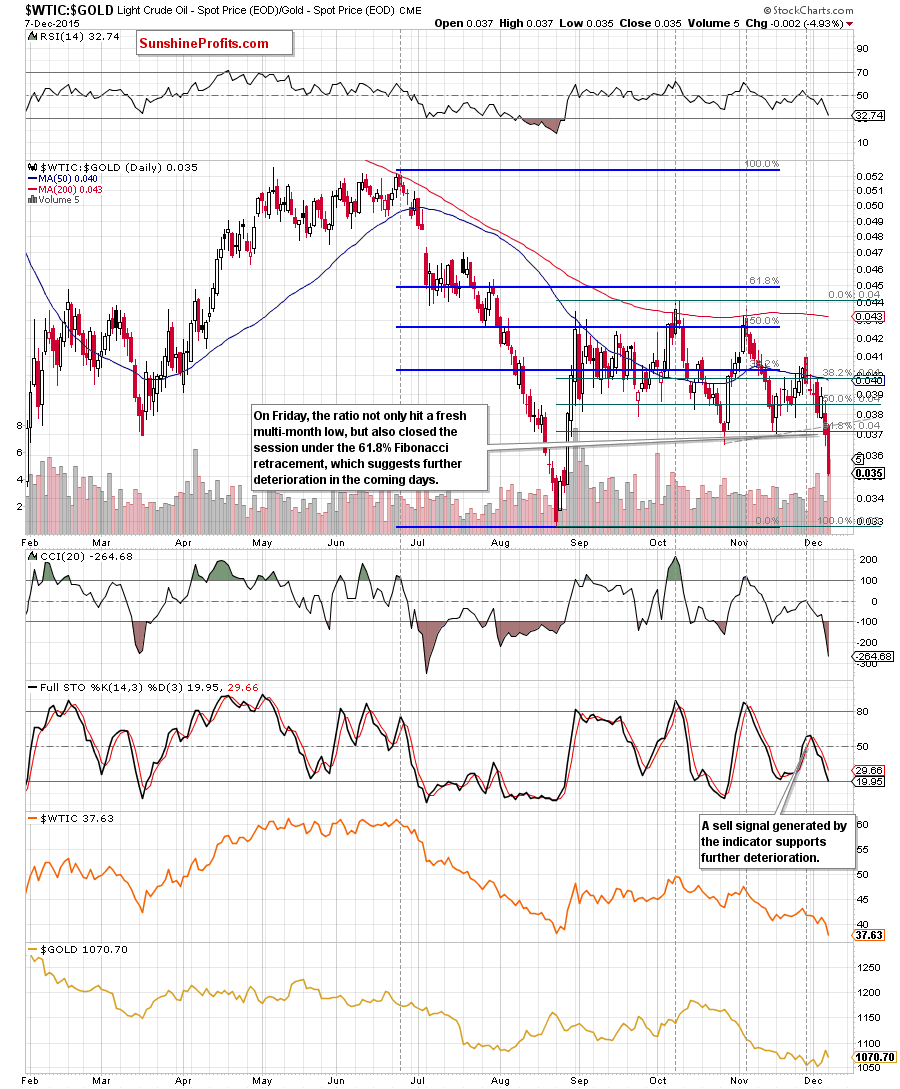
As you see on the daily chart, the ratio not only hit a fresh multi-month low in the previous week, but also declined below the 61.8% Fibonacci retracement, which suggests further deterioration in the coming days (this scenario is also reinforced by the sell signal generated by the Stochastic Oscillator). If this is the case, we’ll also see lower values of crude oil in near future.
What about gold? Taking into account the fact that the recent declines triggered a rebound in gold, it seems that further deterioration in the ratio will support the price of the commodity. Nevertheless, if you want to have a more complete picture of gold (and the precious metal sector) we encourage you to sign up for Gold & Silver Trading Alerts or the All-Inclusive Package that includes it.
Finishing this section, we would like to take a closer look at the relationship between crude oil and the general market.
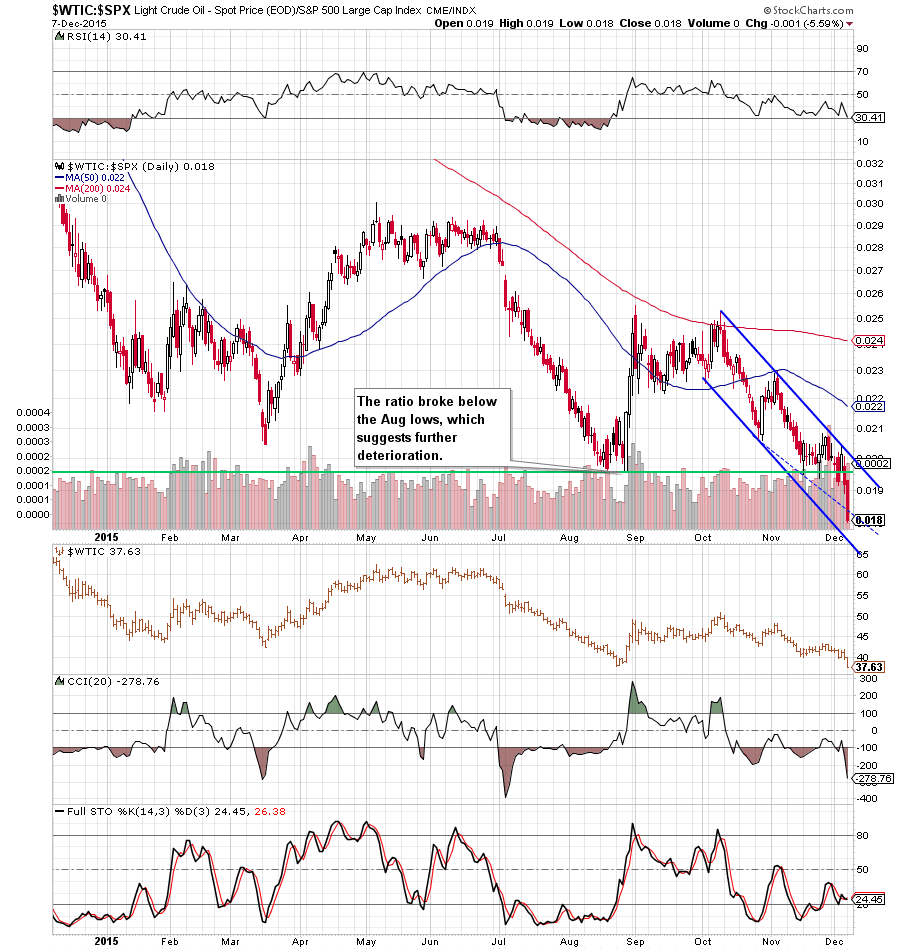
Looking at the daily chart, we see that the upper border of the blue declining trend channel triggered a decline, which took the ratio under the Aug low. This negative signal triggered further deterioration, which resulted in a sharp decline yesterday. Taking into account that sell signals remain in place, we think that the ratio will test the lower line of the formation. If we see such price action, crude oil will also move lower in the coming days.
What could happen if the ratio breaks under this important support? Let’s examine the monthly chart and find out.
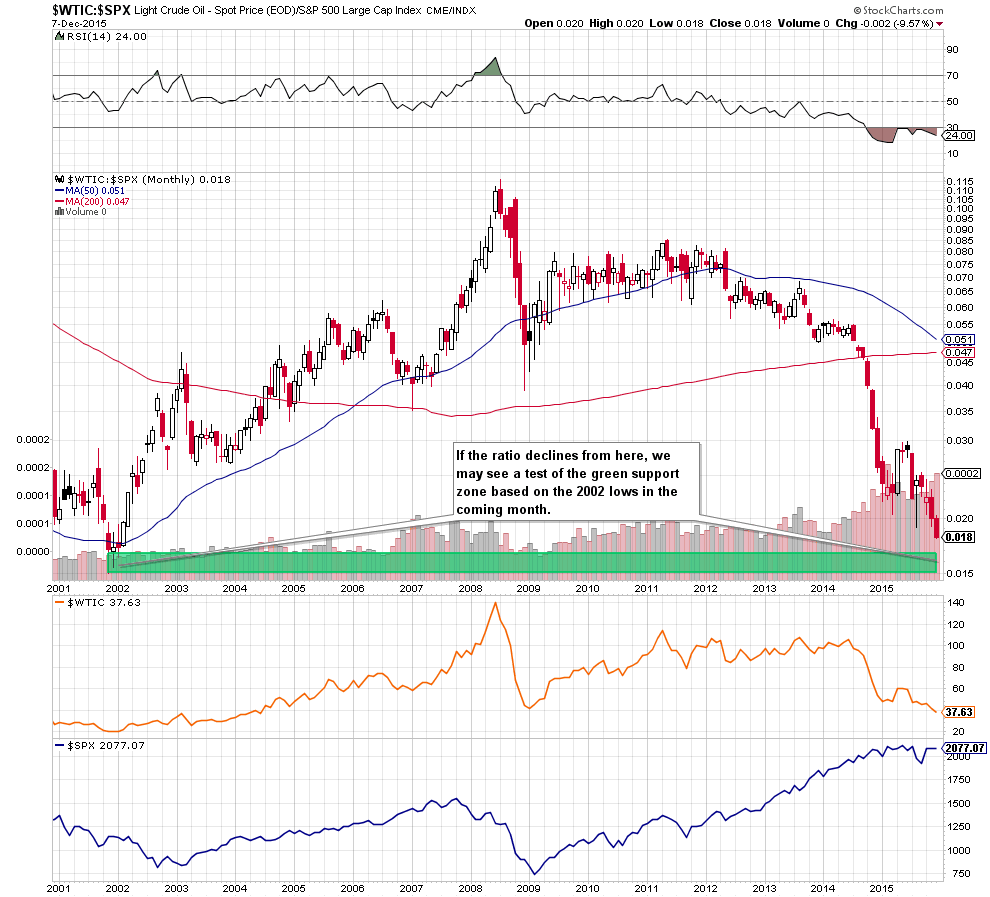
As you see on the long-term chart, if the ratio extends losses, we may see a test of the green support zone based on the 2002 lows in the coming month (and another downswing in black gold).
Non-USD Crude Oil Price
Know the situation for the above ratios, let’s move on to the non-USD (WTIC:UDN ratio) chart of crude oil. As a reminder, UDN is the symbol for the PowerShares DB US Dollar Index Bearish Fund, which moves in the exact opposite direction to the USD Index. Since the USD Index is a weighted average of the dollar's exchange rates with world's most important currencies, the WTIC:UDN ratio displays the value of crude oil priced in "other currencies".
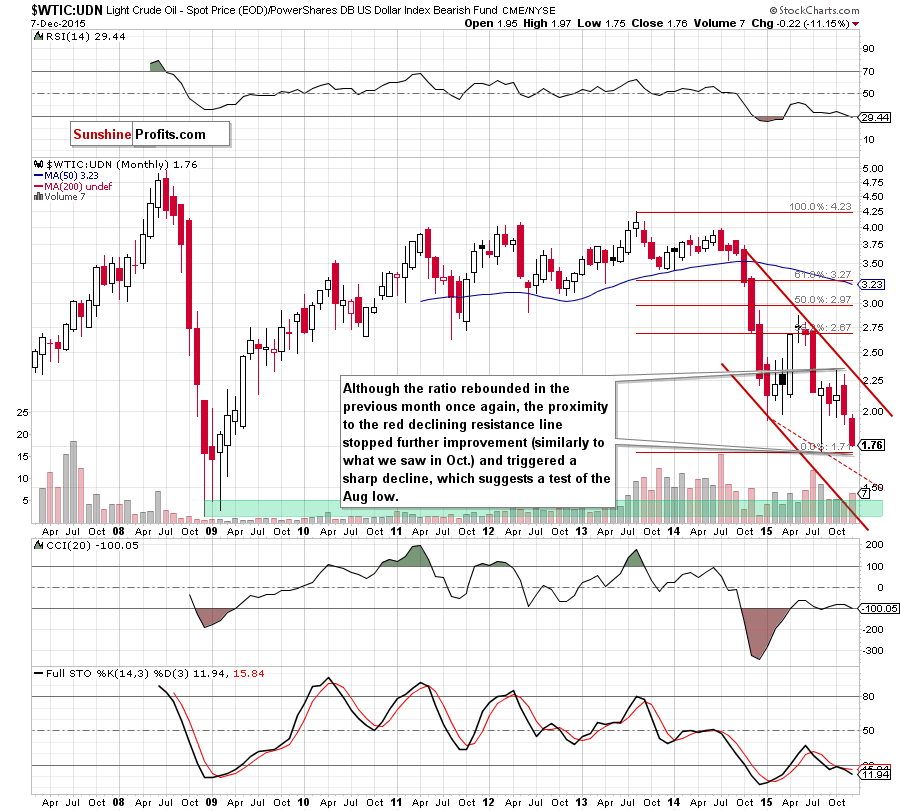
From the long-term perspective, we see that although the ratio moved higher in the previous month once again, the proximity to the red declining resistance line stopped further improvement (similarly to what we saw in Oct.) and triggered a sharp decline, which suggests (at least) a test of the Aug low.
Will the medium-term picture give us more clues about future moves? Let’s check.
A month ago, we wrote:
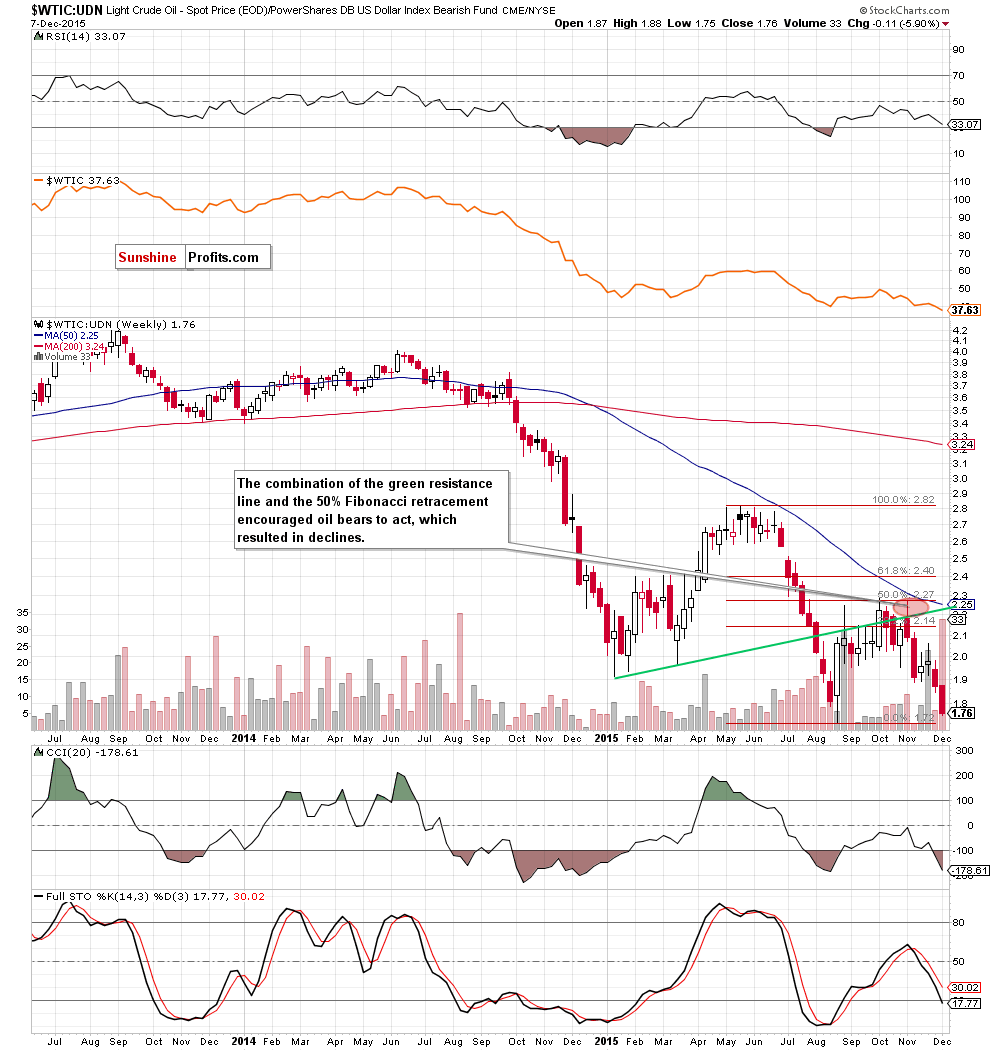
(…) the previously-broken green support/resistance line (based on the Jan and Mar lows) continues to keep gains in check. Taking this fact into account, we believe that as long as there is no weekly close above this important line another attempt to move lower is more likely than not (…). If we see such price action, it will translate to lower values of light crude in the coming week(s).
From today’s point of view, we see that the situation developed in line with the above scenario as the ratio and crude oil declined sharply in recent weeks. Yesterday, light crude broke below the Aug low, which suggests that we’ll see similar price action on the above chart. Finishing today’s commentary on this ratio, please note that sell signals generated by the indicators are still in play, which suggests further deterioration in the coming week(s). If we see such price action, the ratio could even decline to the green support zone (marked on the monthly chart) based on the 2008 and 2009 lows.
Scenarios
Just like a month ago, today’s Oil Investment Update includes scenarios of what could happen in the coming weeks. Naturally, we will continue to monitor the market in the coming days and if anything invalidates our long-term outlook we will send you an additional message.
- Bullish scenario
If crude oil bounces off the upper green support zone (marked n the weekly chart), we’ll see an invalidation of the breakdown below the barrier of $40. Such positive event would likely encourage oil bulls to act and result in an increase to around $43.45-$45, where the previously-broken blue support/resistance line and the blue zone are. In this area is also the long-term red declining resistance line, which stopped further rally in Oct and Nov. If this resistance zone is broken, the next target for oil bulls would be the psychologically important barrier of $50, the 50% Fibonacci retracement (based on the May-Aug declines) and the Oct high. - Bearish scenario
If the commodity extends losses, we may see a drop to the support zone based on the Dec 2008 and Jan 2009 lows (around $35.13-$35.52). In this case, crude oil would break below the neck line of the head and shoulders formation (marked on the monthly chart), which will likely accelerate declines and result in a drop to the 2009 low of $33.55.
Summary
The most important event of the recent months was a successful breakdown under the barrier of $40, which resulted in a fresh multi-year low of $37.50. As we mentioned earlier, with this downward move the commodity reached its key support – the neck line of the head and shoulders formation (marked on the monthly chart). Although we could see a pause in this area (or even a small rebound from here), the current position of the indicators (in the case of crude oil and all the above-mentioned ratios) suggests that a test of the 2009 low is just around the corner.
Very short-term outlook: bearish
Short-term outlook: bearish
MT outlook: bearish
LT outlook: mixed with bearish bias
Trading position (our opinion): Short positions (which are already profitable as we opened them when crude oil was trading around $46.69) with a stop-loss order at $54.12 and initial (!) target price at $35.72 are justified from the risk/reward perspective. We will keep you – our subscribers – informed should anything change.
This completes this month’s Oil Investment Update. Our next Oil Investment Update is scheduled for Thursday, Jan 7, 2016. Oil Trading Alerts subscribers will additionally receive similar but shorter alerts on a daily basis (or more than once a day when the situation requires it). You – Oil Investment Updates subscribers – will receive short Investment Alert messages should the outlook for the medium or long term change before the next Update is posted.
Thank you.
Nadia Simmons
Forex & Oil Trading Strategist
Oil Investment Updates
Oil Trading Alerts

