

Looking at the crude oil’s charts from today’s point of view, we can summarize the recent month in one sentence: more of the same. Although oil bulls tried to push the commodity above the key resistance zone several times in the recent weeks, all tests have failed and light crude remains in a narrow range between $57 and $62. Will we see a breakout or a breakdown in the coming weeks?
Before we try to answer this question, focusing on the technical picture of the commodity, we would like to draw your attention to Friday’s OPEC meeting. Although the majority of OPEC's smaller nations (such as Venezuela, Libya or Angola, which derives nearly 98% of its revenues from oil) have advocated for production cuts in an effort to bolster prices, they have been overruled by Saudi Arabia, which is looking to undercut U.S. shale producers by depressing prices. As a result, OPEC kept production levels unchanged from their current level at approximately 30 million barrels per day (in line with earlier speculations) in spite of a continuing glut of oversupply in the market.
And speaking of the supply glut… if longstanding economic sanctions against Iran are lifted by Western powers, Iranian exports could increase to 1.7 million bpd from a current level 1.0 million within 12 months (additionally, Iran reportedly has 30 million barrels of crude stored in offshore tankers ready for export), which would be bearish for crude oil prices.
On top of that, the Baker Hughes reported that the number of oil rigs declined by only four to 642 in the previous week. Although it was the lowest level since Aug 2010, the pace of slowdown continued to decrease, which could translate to lower-than-expected drops in domestic crude oil supplies in the coming week(s).
All the above-mentioned fundamental factors do not bode well for crude oil, suggesting that lower values of the commodity should not surprise us. Will the technical picture of the oil market confirm this scenario? Let’s examine charts to find out what are they saying about future moves (charts courtesy of http://stockcharts.com).
Crude Oil
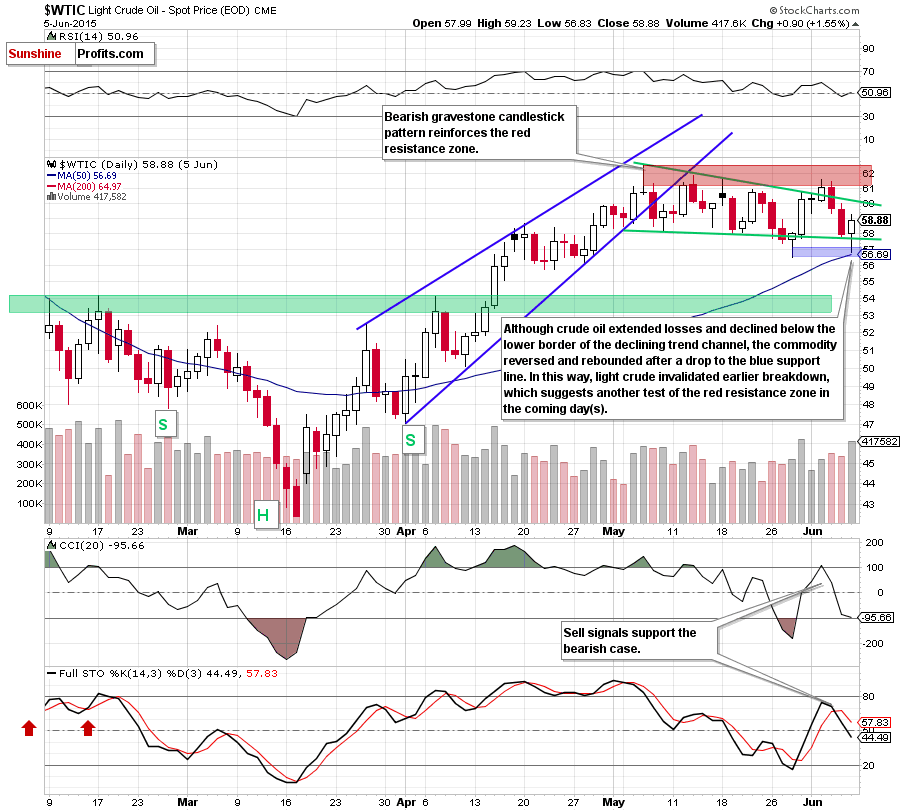
On Friday, crude oil moved sharply lower after the market’s open and slipped below the green support line, which triggered a test of the recent low and the 50-day moving average. As you see on the above chart, the combination of these two supports encouraged oil bulls to act and resulted in a sharp rebound. In this way, light crude invalidated earlier breakdown, which is a positive signal that suggests further improvement and a test of the red resistance zone in the coming day(s).
Nevertheless, we should keep in mind that sell signals generated by the indicators remain in place, supporting further declines. Are there any other factors that could encourage oil bears to act in the coming week(s)? Let’s examine the charts below and find out.
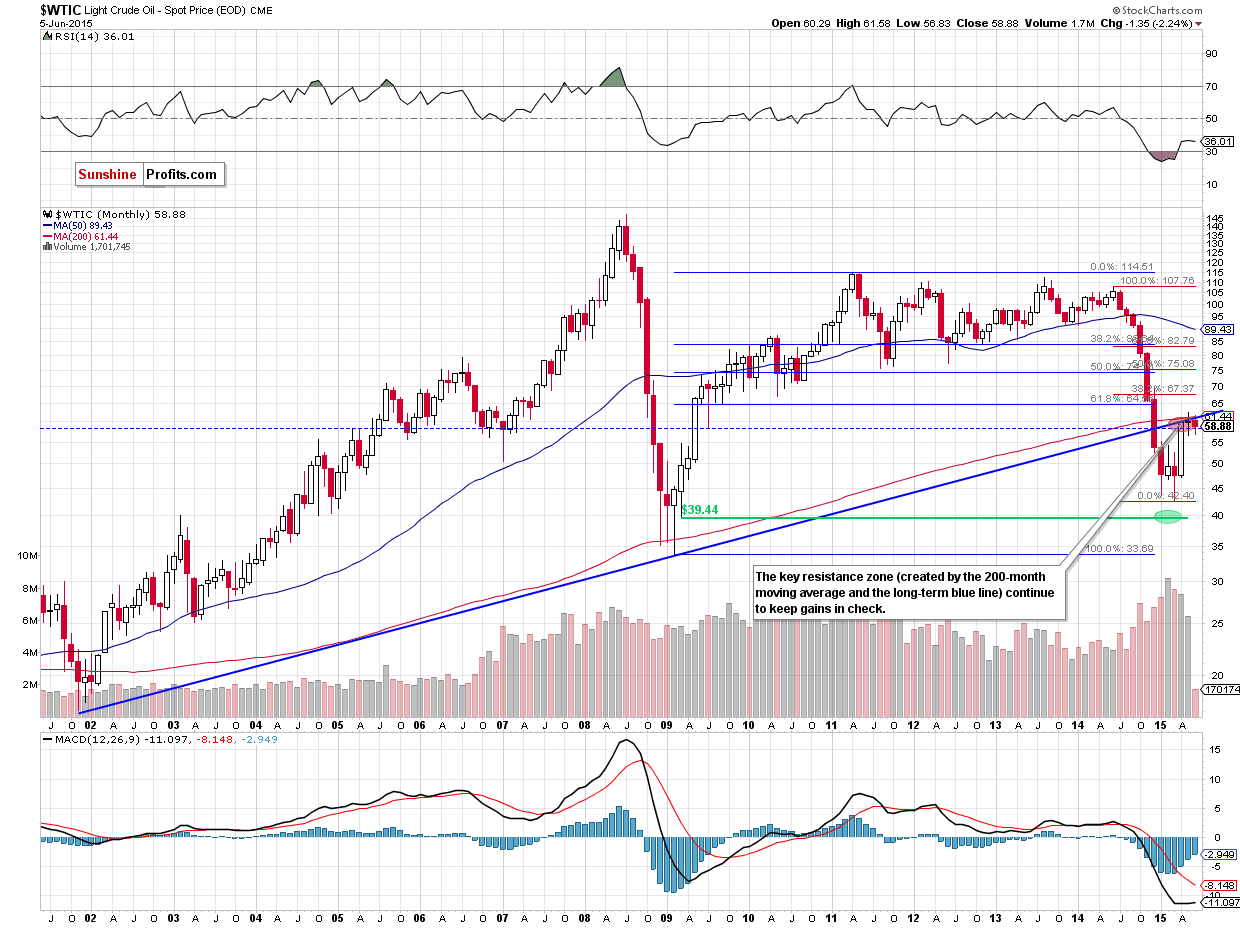
As you see on the monthly chart, although crude oil moved higher earlier this month, the key resistance zone (created by the long-term blue resistance line and the 200-month moving average) continues to keep gains in check. In our opinion, this means that as long as there is no successful breakout above this area further rally is not likely to be seen and further deterioration is more likely than not.
Can we infer something more from the weekly chart? Let’s check.
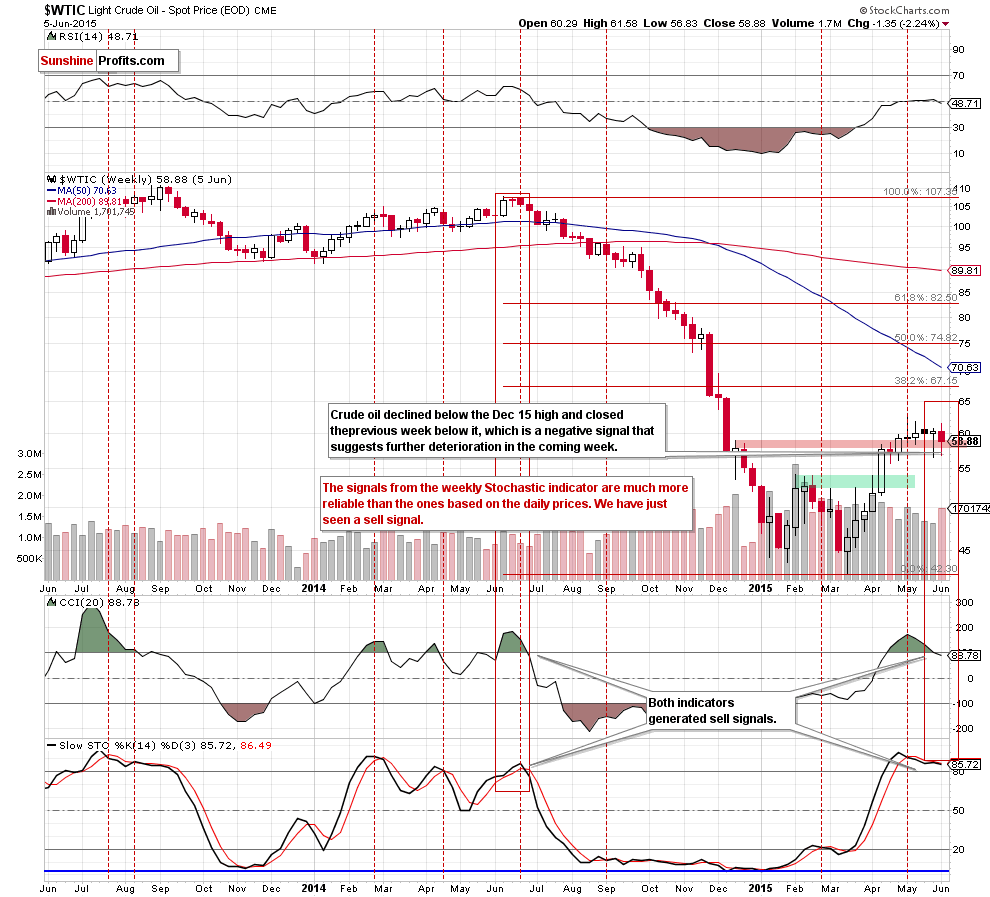
From this perspective, we see that although crude oil rebounded on Friday, the commodity declined below the Dec 15 high and closed the previous week below it, invalidating earlier breakout, which is a negative signal that suggests further deterioration in the coming week.
Additionally, when we take a closer look at the chart, we notice that last week’s decline materialized on sizable volume (compared to what we saw during the recent weeks), which means that oil bears are getting stronger. On top of that, the CCI and Stochastic Oscillator generated sell signals, supporting the bearish case. At this point, it is worth noting that last time we saw similar values of the indicators a year ago. Back then, sell signals preceded huge declines, which took the commodity to the multi-month low of $42.41. Taking this fact into account and combining with the long-term picture, we believe that lower values of crude oil are just around the corner.
If this is the case, and the commodity extends declines, the initial downside target would be the blue support zone (marked on the daily chart) around $56.51-$56.69, where the recent lows and the 50-day moving average are. If it is broken, we’ll see a drop to the green support zone created by the Feb highs.
Summing up, although crude oil invalidated earlier breakdown under the lower border of the declining trend channel (which suggests further improvement and a test of the red resistance area in the coming days), we think that the long- and medium-term picture in combination with sell signals generated by the indicators (daily and weekly) will trigger further deterioration in the coming week(s).
Having discussed the situation in crude oil, let’s examine the NYSE Arca Oil Index (XOI) to find out what the current outlook for oil stocks is.
Oil Stocks
In our previous Oil Investment Update, we wrote the following:
(…) we think that the current position of the indicators (the CCI and Stochastic Oscillator generated sell signals) will encourage oil bears to act in the coming week(s). If this is the case, the initial downside target would be (…) around 1,375. If it is broken, we might see a drop to around 1,360, where the medium-term declining red line (which serves as a support now) is.
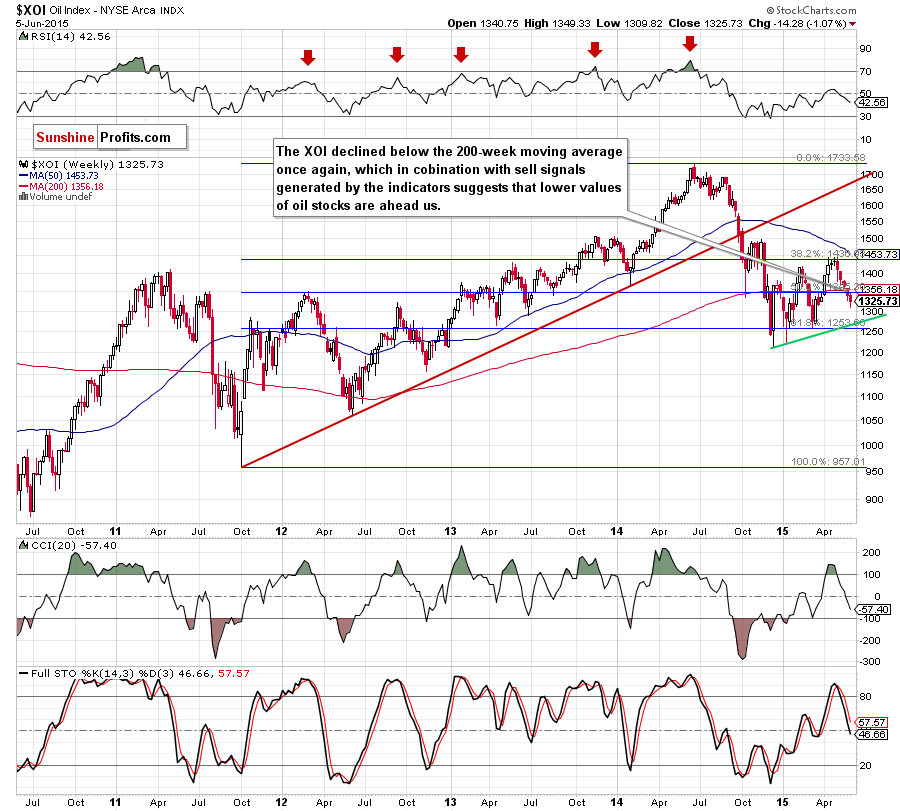
From today’s point of view we see that oil bears not only took the XOI to our downside target, but also managed to push the index lower. With this downward move, oil stocks declined below the 200-week moving average once again, which in combination with sell signals generated by the indicators suggests that further deterioration is still ahead us. If this is the case, and the XOI moves lower from here, the initial downside target would be around 1,270, where currently the green support line based on the Dec and Jan lows is.
Are there any short-term factors that could hinder the realization of the above scenario? Let’s examine the daily chart and find out.
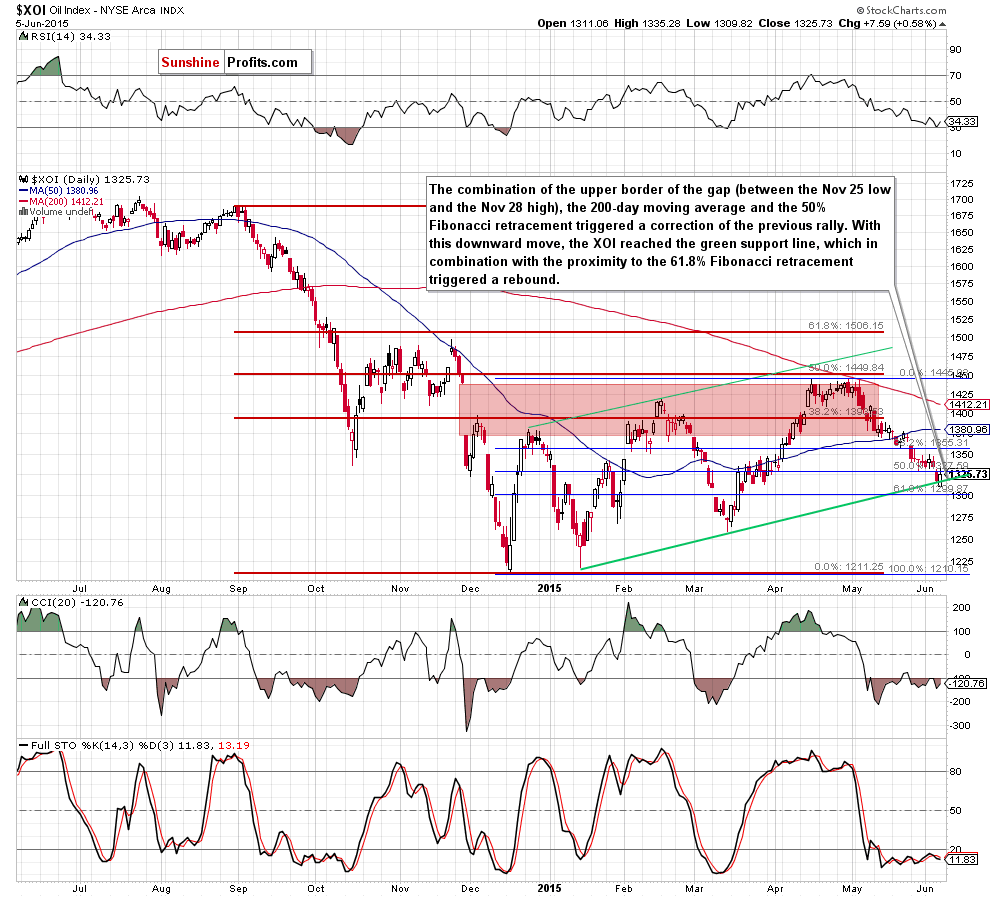
Looking at the daily chart, we see that the combination of the upper border of the gap (between the Nov 25 low and the Nov 28 high), the 200-day moving average and the 50% Fibonacci retracement level stopped further improvement, triggering a correction of the previous rally. With this downward move, the XOI reached the green support line (based on the Jan 14, and Mar13 lows), which in combination with the proximity to the 61.8% Fibonacci retracement (based on the entire Dec-Apr upward move) triggered a rebound.
At this point, it is also worth noting that the RSI bounced off the level of 30, generating a buy signal, while the CCI and Stochastic Oscillator are oversold and very close to do the same in the coming days. If we see such price action, the XOI will likely moves higher from here and climb to the 38.2% Fibonacci retracement based on the entire recent decline (around 1,360) in the coming days.
Before we summarize this section, let’s take a look at the relation between the general stock market an oil stocks. Will it confirm the above pro-growth scenario?
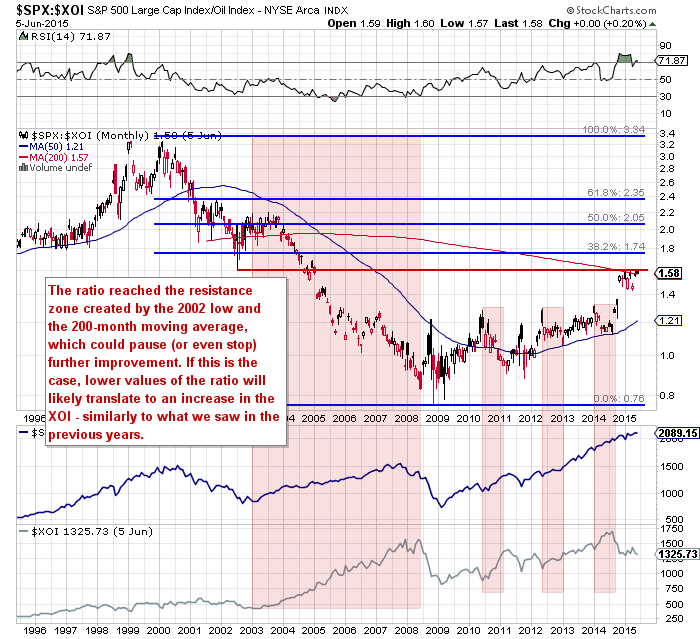
As you see on the above chart, the ratio reached the resistance zone created by the 2002 low and the 200-month moving average, which could pause (or even stop) further improvement. When we take a closer look at the chart, we notice that we saw such situation in the previous years and also in Jan and then in March (we marked these periods of time with red rectangles). In all these cases, lower values of the ratio translated to an increase in the XOI. Therefore, another pullback from here will likely trigger an improvement in oil stocks in the coming week(s).
Summing up, oil stocks extended losses and reached the green support line based on the Jan and Mar lows, which in combination with the proximity to the 61.8% Fibonacci retracement, the position of the daily indicators and the current situation in the SPX:XOI ratio suggests that we could see a rebound from here to around 1,360 in the coming week(s).
Ratio Analysis
Once we know the current situation in crude oil and oil stocks, let’s focus on the relationship between them. What can we infer from the chart below?
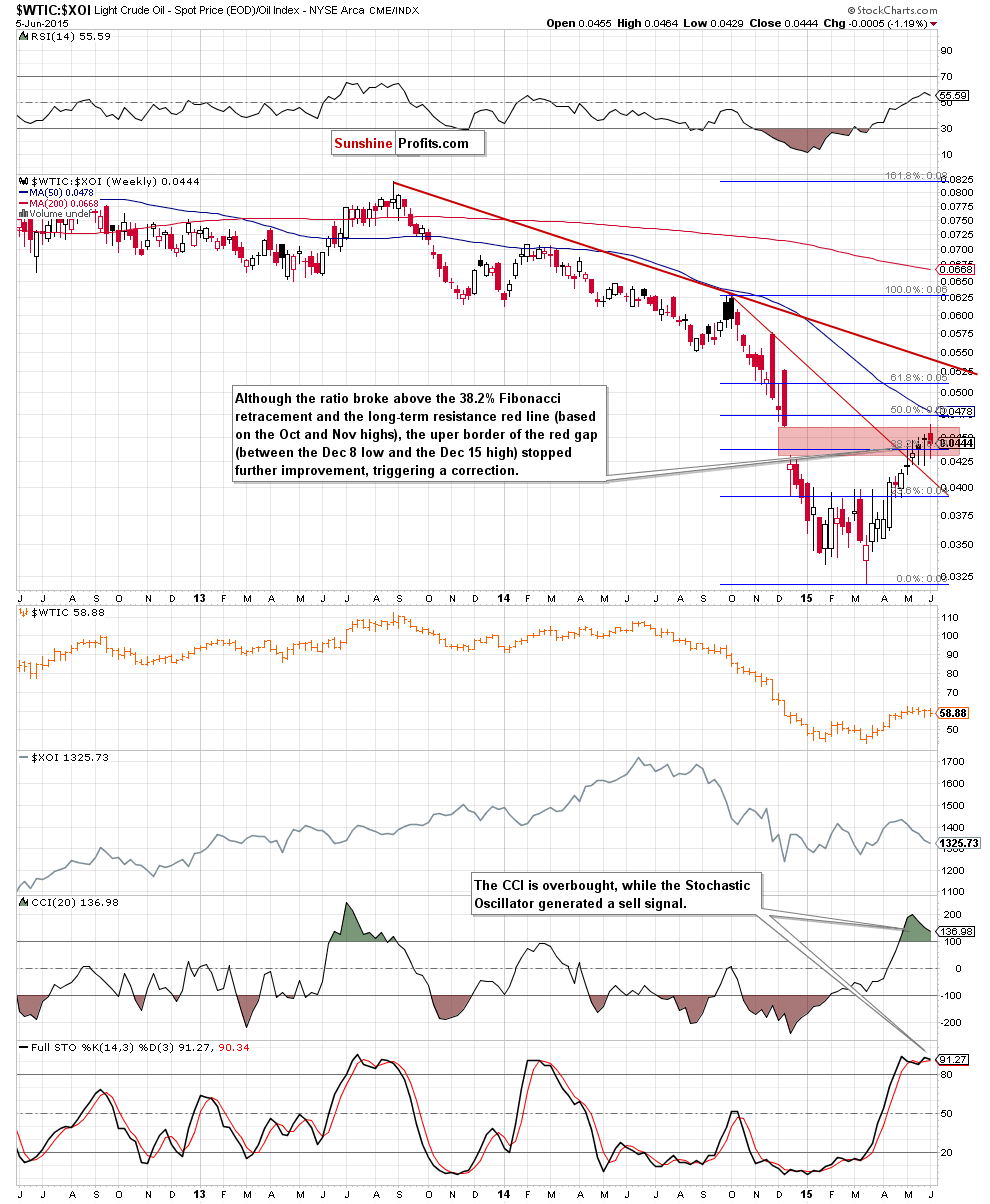
Looking at the above chart, we see that the ratio moved higher in the previous weeks and broke above the 38.2% Fibonacci retracement and the long-term red resistance line (based on the Oct and Nov highs). Despite this improvement, the upper border of the red gap between the Dec 8 low and the Dec 15 high stopped further improvement, triggering a pullback. Will we see further deterioration? Taking the above into account, and combining it with the current position of the indicators (the CCI and Stochastic Oscillator are overbought, which will likely translate to sell signals in the coming week), we think that lower values of the ratio are just around the corner. If this is the case, and the ratio declines from here, such price action will likely translate to a pullback in light crude – similarly to what we saw in the previous months.
Having said that, let’s find out whether we can infer something more about future crude oil’s moves from the stocks-to-oil ratio or not.
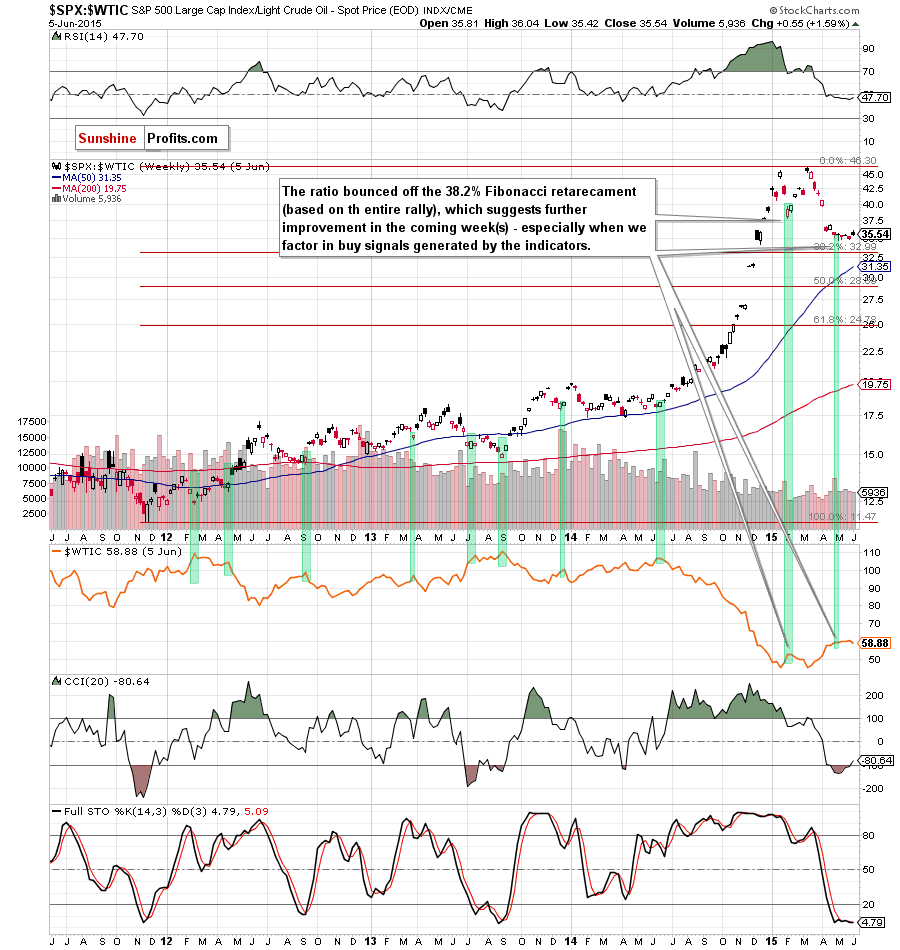
From this perspective, we see that the ratio bounced off the 38.2% Fibonacci retracement based on the entire rally, which suggests further improvement in the coming weeks – especially when we factor in the current position of the indicators (the CCI and Stochastic Oscillator generated buy signals). What does it mean for crude oil? As you see on the above chart, many times in the past (we marked them with green) local bottoms in the ratio have corresponded to local tops in crude oil. Therefore, if we see a rally from here, the probability of a pullback in the commodity will increase.
Once we know the current situation in the stocks-to-oil ratio, let’s analyze the oil-to-gold ratio.
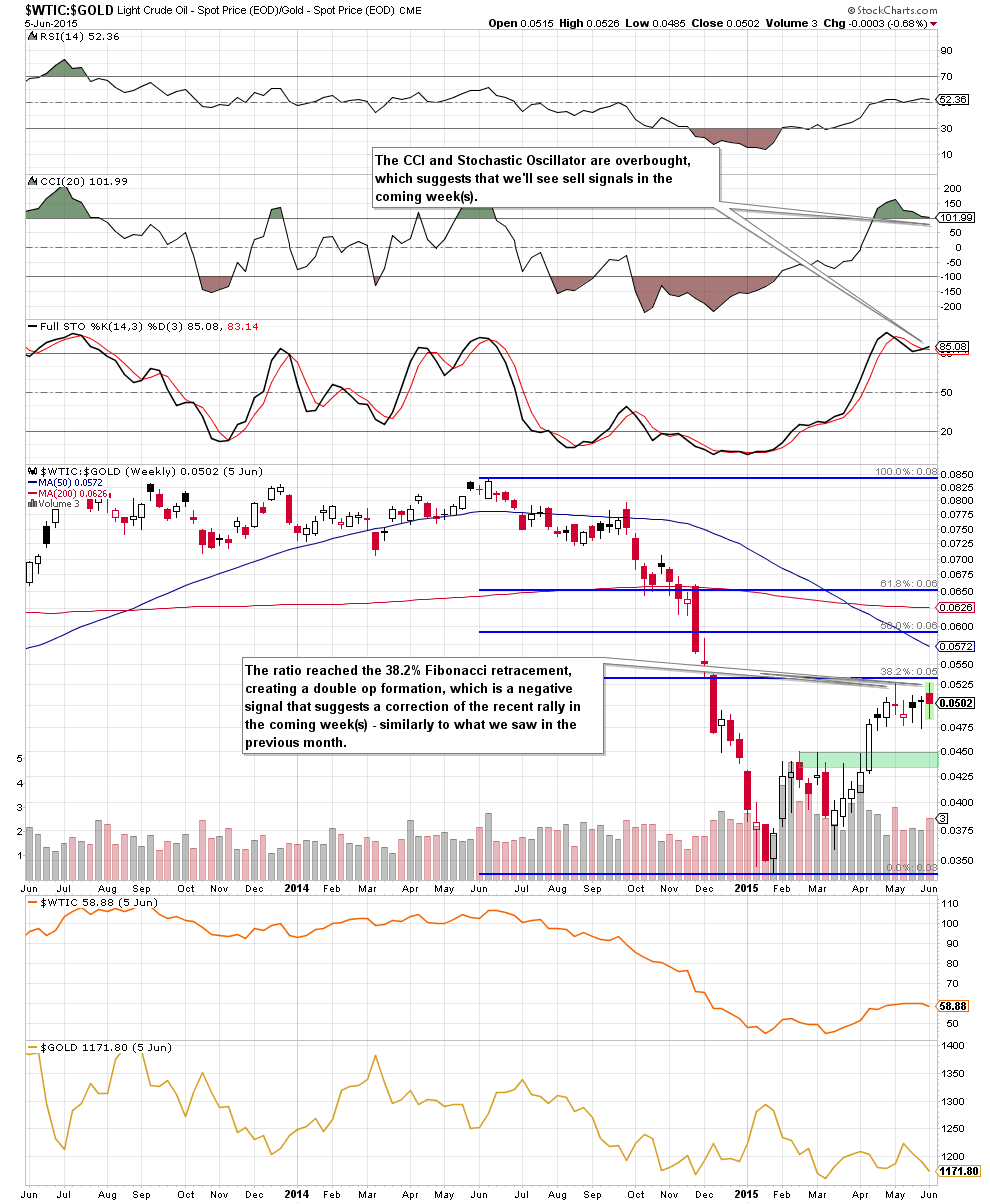
On the above chart, we see that the ratio reached the 38.2% Fibonacci retracement, creating a double top formation, which is a negative signal. Taking the above into account and combining it with the current position of the indicators (the CCI and Stochastic Oscillator are overbought and very close to generating sell signals) and the Fibonacci resistance level, it seems to us that we might see a correction of the recent rally in the coming week(s). If we see such price action, crude oil will likely also move lower – similarly to what we saw in the past.
To have a more complete picture of the oil market, we also decided to examine the WTIC:USD ratio.
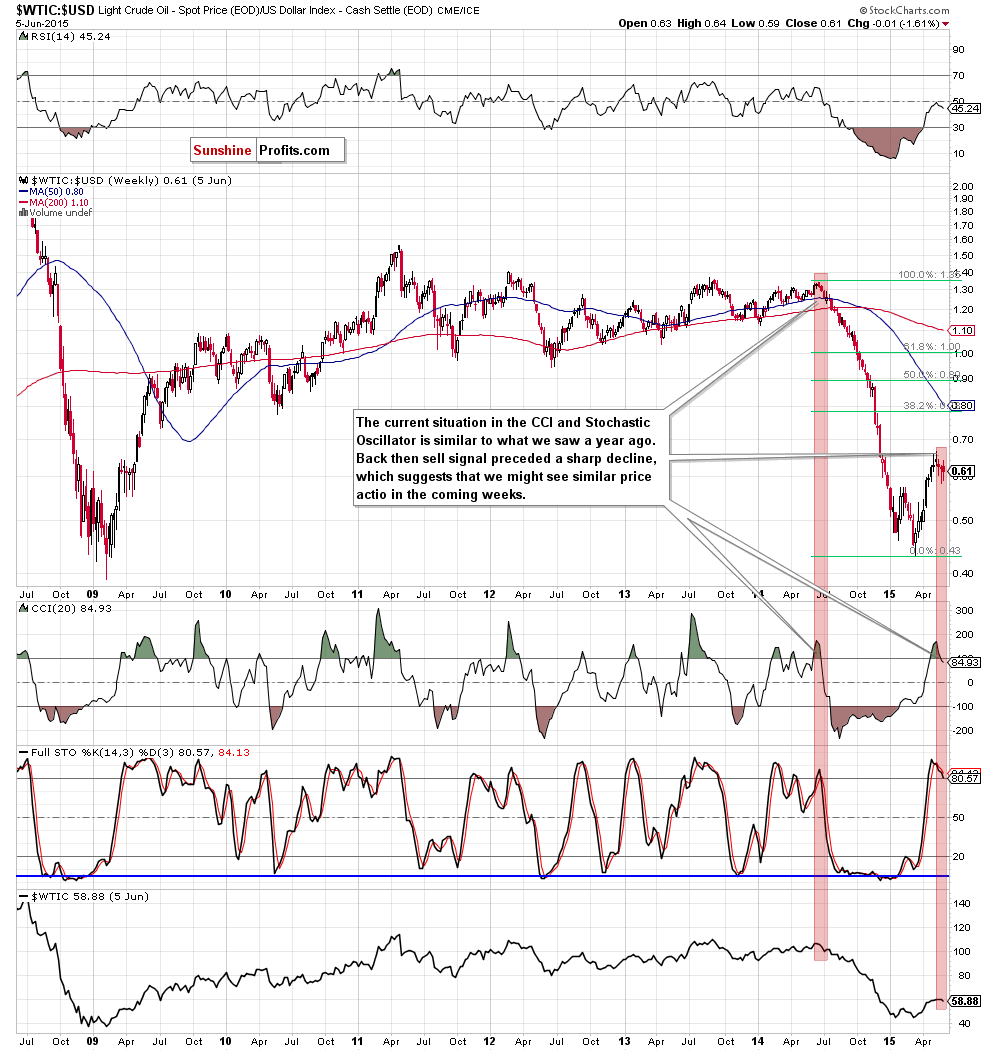
From today’s point of view we see that the current situation in the CCI and Stochastic Oscillator is similar to what we saw a year ago. Back then, sell signals generated by the indicators preceded a sharp and sizable decline, which took the commodity below $50. Taking this fact into account, it seems that history will repeat itself once again and we’ll see lower values of the ratio and crude oil in the coming week(s). If this is the case, the initial downside target would be around 0.573, where the Feb highs are.
Non-USD Crude Oil Price
Know the situation for the above ratios, let’s move on to the non-USD (WTIC:UDN ratio) chart of crude oil. As a reminder, UDN is the symbol for the PowerShares DB US Dollar Index Bearish Fund, which moves in the exact opposite direction to the USD Index. Since the USD Index is a weighted average of the dollar's exchange rates with world's most important currencies, the WTIC:UDN ratio displays the value of crude oil priced in "other currencies".
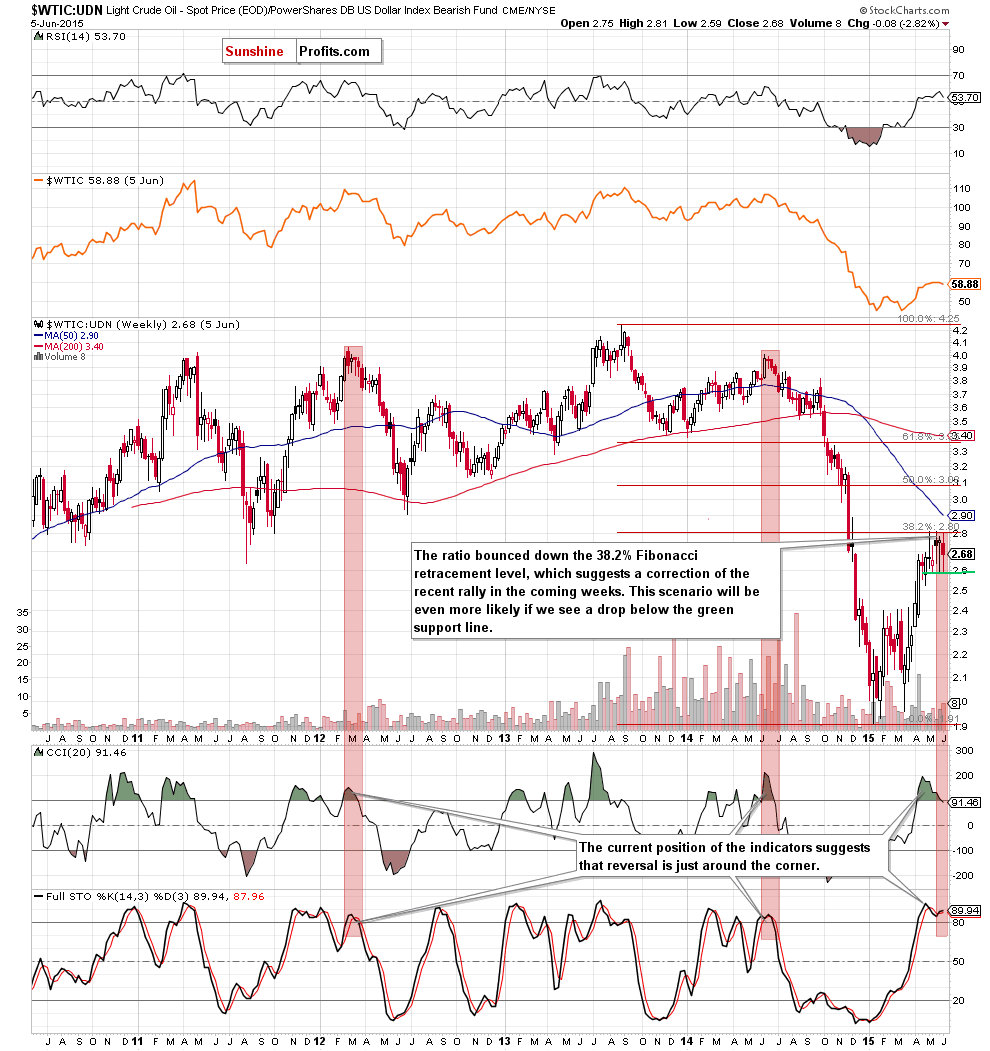
As you see on the weekly chart, although there were several attempts to break above the 38.2% Fibonacci retracement level (based on the entire Aug-Jan decline) they all failed, which resulted in a another decline to the green support line. Although this support triggered a small rebound, the current position of the indicators (the CCI generated a sell signal, while the Stochastic Oscillator is extremely overbought) suggests that further declines are just around the corner. At this point, it is worth noting that similar readings of these indicators have preceded declines in the past, which increases the probability of reversal. Nevertheless, in our opinion, the correction will accelerate if the ratio drops under its major support line at 2.59.
Scenarios
Just like a month ago, today’s Oil Investment Update includes scenarios of what could happen in the coming weeks. Naturally, we will continue to monitor the market in the coming days and if anything invalidates our long-term outlook we will send you an additional message.
- Bullish scenario
If crude oil breaks above the major resistance zone created by the long-term blue resistance line and the 200-month moving average (marked on the monthly chart), it would be a strong bullish signal, which will trigger further improvement and an increase to the initial upside target around $67, where the 38, 2% Fibonacci retracement based on the entire Jun-Jan declines is. If it is broken, the next target for oil bulls would be around $75 (the 50% Fibonacci retracement and the 50-week moving average). - Bearish scenario
If the commodity closes the day below the blue support area (around $56.51-$56.69, where the recent lows and the 50-day moving average are), we’ll see a test of the green support zone created by the Feb highs ($54-$54.24). Please note that if this area is broken, the next targets would be around: $52.40 (the 50% Fibonacci retracement based on the entire Mar-May rally), $50 (the 61.8% retracement) or we might see a test of the Apr low of $47.
Summary
Although crude oil rebounded and invalidated earlier breakdown under the short-term support level, the commodity still remains below the May and June highs and the key resistance zone created by the long-term blue resistance line and the 200-month moving average. Additionally, last week’s decline materialized on sizable volume (compared to what we saw during the recent weeks), which means that oil bears are getting stronger. On top of that, similar values of the CCI and Stochastic Oscillator (not only in case of crude oil, but also in oil-to-gold , oil-to-usd and WTIC:UDN ratios) preceded huge declines, which took the commodity to the multi-month low of $42.41.Taking this fact into account and combining with the long-term picture and the current position of the ratios, which reached important support/resistance levels (in all cases their reversals will translate to lower values of crude oil), we believe that lower values of crude oil are just around the corner.
Very short-term outlook: bearish
Short-term outlook: bearish
MT outlook: mixed with bearish bias
LT outlook: mixed with bearish bias
Trading position (short-term; our opinion): Short positions with a stop-loss order at $65.23 are justified from the risk/reward perspective. We will keep you – our subscribers – informed should anything change.
This completes this month’s Oil Investment Update. Our next Oil Investment Update is scheduled for Thursday, July 9, 2015. Oil Trading Alerts subscribers will additionally receive similar but shorter alerts on a daily basis (or more than once a day when the situation requires it). You – Oil Investment Updates subscribers – will receive short Investment Alert messages should the outlook for the medium or long term change before the next Update is posted.
Thank you.
Nadia Simmons
Forex & Oil Trading Strategist
Oil Investment Updates
Oil Trading Alerts

