
The first days of the new month have been very positive for oil bulls. After a breakout above the lower border of the declining trend channel in terms of intraday lows, buyers pushed the price higher and broke above another short-term resistance line. This event resulted in a sharp rally, which took light crude above $98. On top of that, crude oil broke above the upper border of the declining trend channel in terms of intraday highs and above the 50-day moving average. In this way, after seven weeks of losses, crude oil posted its second weekly gain in nine weeks.
In our previous Oil Investment Update, we focused on U.S. inventories and production in the United States – major fundamental factors, which have driven prices lower in recent weeks. Back then, we wrote the following:
(…) as is well known, more refineries come back from seasonal maintenance. Therefore, crude stockpiles could begin falling and product stockpiles could grow. If this happens (maybe not this week, but likely this month), the price of light crude will likely find supporting fundamental factors. On a side note, historically, refineries try to reduce their crude stockpiles before year-end tax assessments based on storage levels.
Taking into account the significant impact of inventories on the price, investors kept an eye on data from the American Petroleum Institute late on Tuesday and weekly oil inventory data from the Energy Information Administration on Wednesday. What was the EIA data release?
The Energy Information Administration said in its weekly report that crude oil stocks fell by 5.6 million barrels, but it was far less than the 12.4-million-barrel drop reported late Tuesday by the American Petroleum Institute. Therefore, this news pushed crude oil to its intraday low of $96.30. So, what is the clue for the future? First of all, investors should focus on whether the data are better or weaker than expected. Secondly, compare the EIA weekly report with the one from the American Petroleum Institute. If it is weaker, we may see similar price action and lower values of crude oil.
Last week, we also mentioned U.S. data which give a clearer view of the strength of the economy and the demand outlook for the world's biggest oil consumer. At this point, it’s worth noting that investors should also keep an eye on Chinese economic data because China is the world's second largest oil consumer after the U.S. and has been the engine of strengthening demand in recent weeks.
At the beginning of the previous week, oil prices began their climb after traders digested a reading from China's official Purchasing Managers' Index, which came in at 51.4 for November, a figure better than economists had expected and above the 50-point level, which indicates expansion. Please note that the PMI, which is a gauge of the country's manufacturing health, is important to oil investors because China has accounted for roughly 10% of oil demand in recent years, according to the International Energy Agency.
Additionally, a report from the Institute for Supply Management showed that U.S. manufacturing activity unexpectedly rose to 57.3 last month, up from 56.4 in October. The reading was the highest for the U.S. since April 2011, which fueled optimism for more robust economic recovery. Later in the week, the Commerce Department said that third quarter U.S gross domestic product grew at a faster pace than initially thought, recording a 3.6% rise, compared with forecasts of 3.2% growth. Additionally, the Labor Department said that new claims for unemployment benefits fell for a third straight week last week. Initial claims were 298,000 in the Nov. 30 week, below economists' expectations of 320,000.
On top of that, on Friday the Department of Labor reported that the U.S. economy added 203,000 jobs in November, beating expectations for a 180,000 increase and up from a downwardly revised 200,000 rise the previous month. Additionally, in the private sector, 196,000 jobs were added last month, compared to expectations for a 180,000 rise, after an increase of 214,000 in October. The report also said the U.S. unemployment rate fell to 7.0% in November from 7.3% in October, beating expectations for a downtick to 7.2%.
Also on Friday, the preliminary Thomson Reuters/University of Michigan consumer sentiment index increased to 82.5 in December from 75.1 the previous month, far surpassing expectations for a 76.0 reading.
The above numbers showed that the US is making decent progress on the employment front and demonstrating that the US economy is recovering better than expected. On the one hand, they pushed the price of light crude higher on sentiments that the U.S. economy is gaining steam and will demand more fuel and energy going forward. On the other hand, the monetary implications of such improving data fueled expectations that the Federal Reserve will begin scaling back its $85 billion in monthly bond purchases in 2014, which capped further gains.
Please note that this week, investors will be focusing on retail sales data to further gauge the strength of the economy and the need for stimulus. Market players will also look ahead to a raft of Chinese economic data later in the week, including reports on inflation, industrial production and retail sales.
Crude Oil
To see what the crude oil market itself can tell us, let's jump straight into the technical part of this week‘s Oil Investment Update. Just like in previous weeks, we’ll take a look at charts in different time horizons to have a more complete picture of the current situation in the market.
Let’s start with a look at the monthly chart of light crude (charts courtesy by http://stockcharts.com).
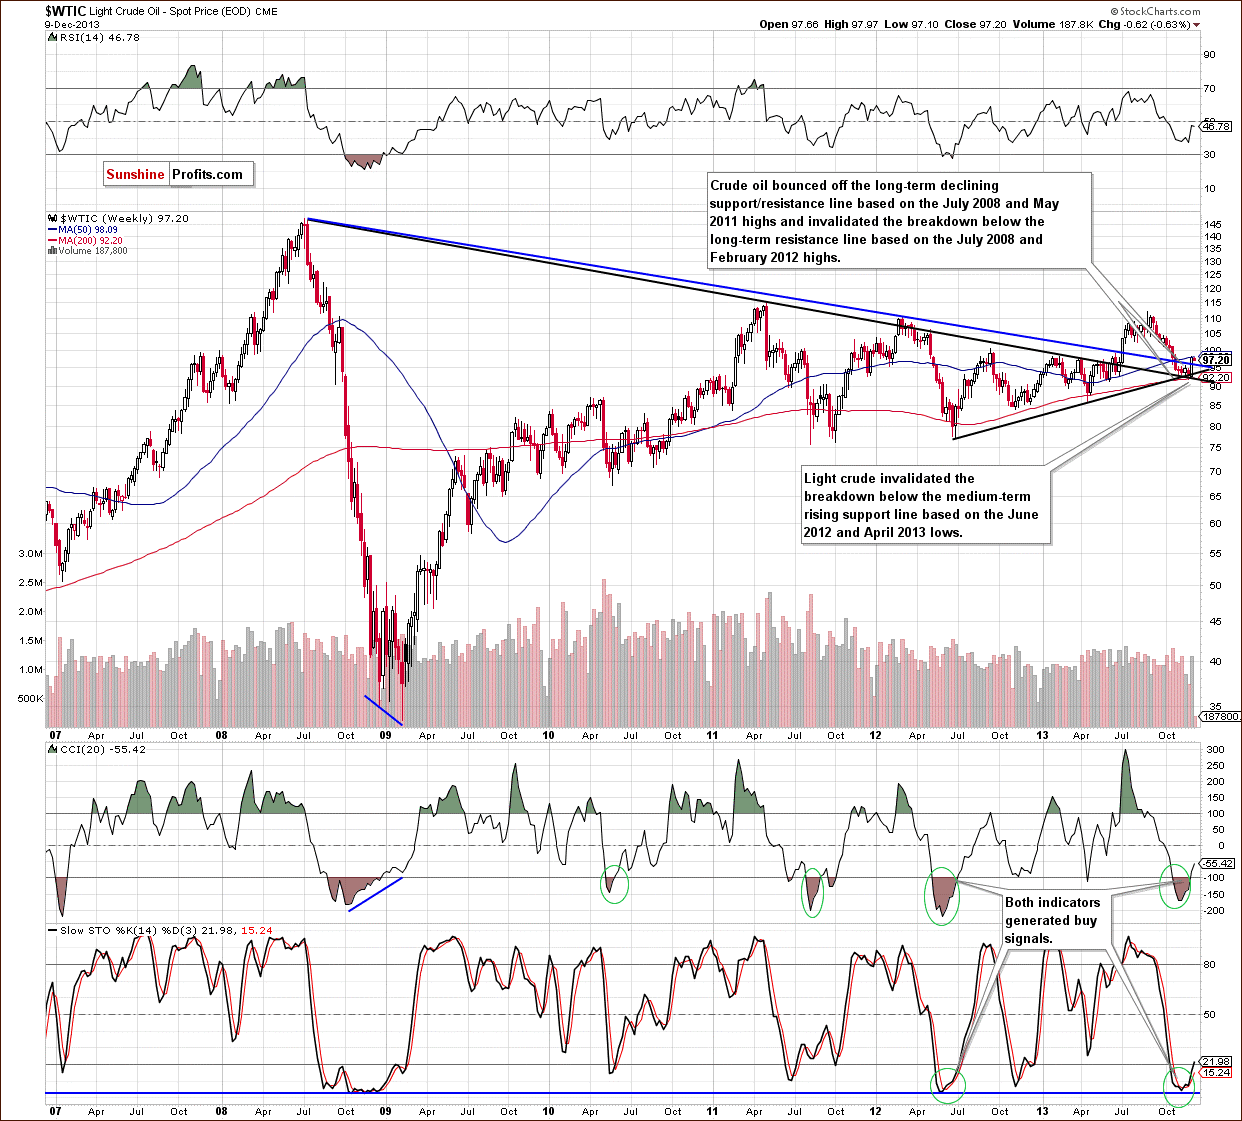
The situation in the long-term chart has improved recently. As you can see on the above chart, crude oil bounced off the long-term declining support line based on the July 2008 and May 2011 highs and invalidated the breakdown below the long-term support/resistance line based on the July 2008 and February 2012 highs. The recent upward move materialized on high volume, which is a strong bullish sign and confirms the strength of buyers. On top of that, the CCI and Stochastic Oscillator generated buy signals, which is another positive sign.
From this point of view, the situation is mixed with bullish bias.
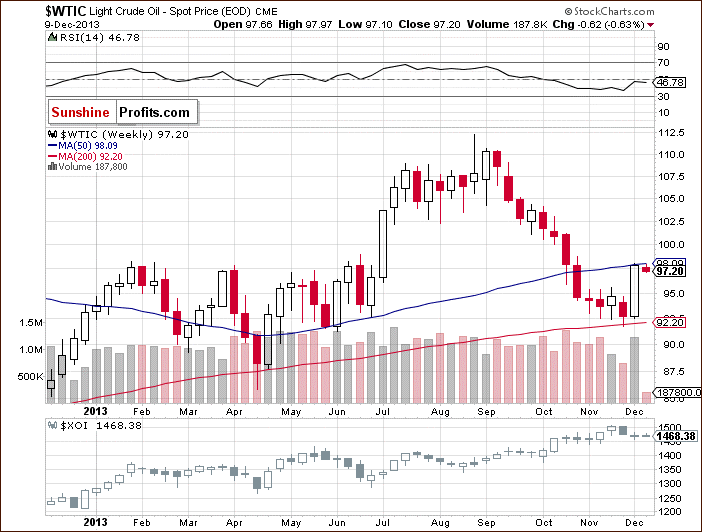
Now, let’s zoom in on our picture of the oil market and see the weekly chart.
In our last Oil Investment Update, we wrote the following:
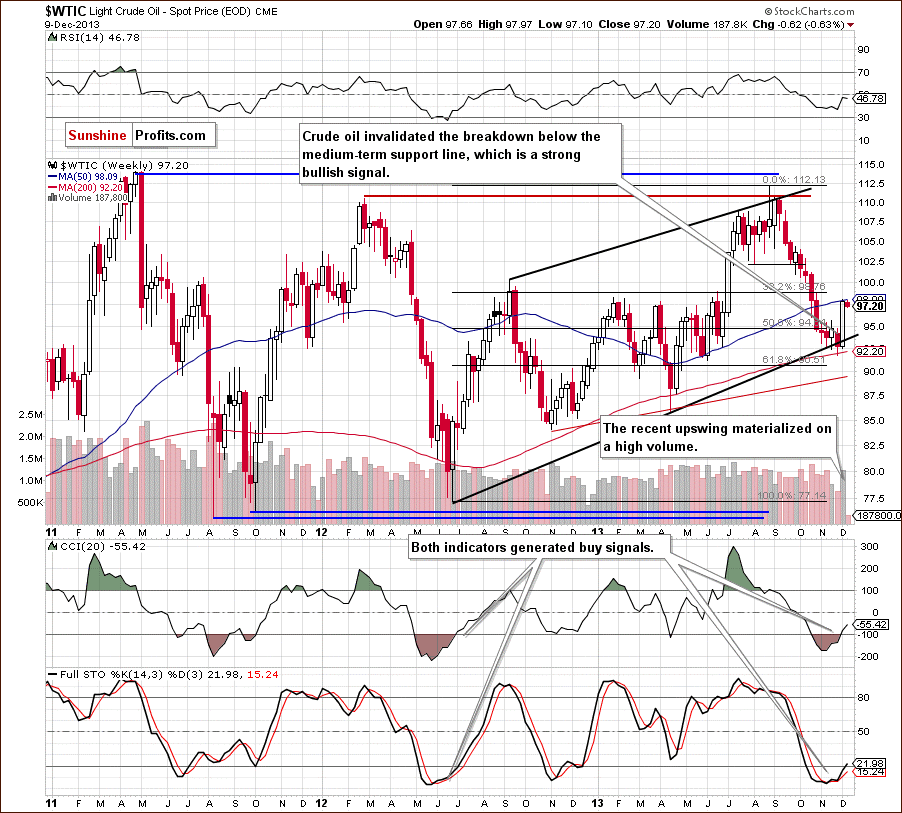
(…) crude oil reached its 200-week moving average and pulled back. Despite this fact, it closed the previous week below the medium-term support line, which is not a positive sign for oil bulls. However, the breakdown is not confirmed at the moment.
As you can see on the above chart, light crude bounced off in the previous week and invalidated the breakdown, which is a strong bullish sign. In this way, crude oil reached its first resistance created by the 50-week moving average. Therefore, pause or a pullback should not surprise us. Please note that both indicators on the above chart generated buy signals, which supports the bullish case.
Now, let’s check the short-term outlook.
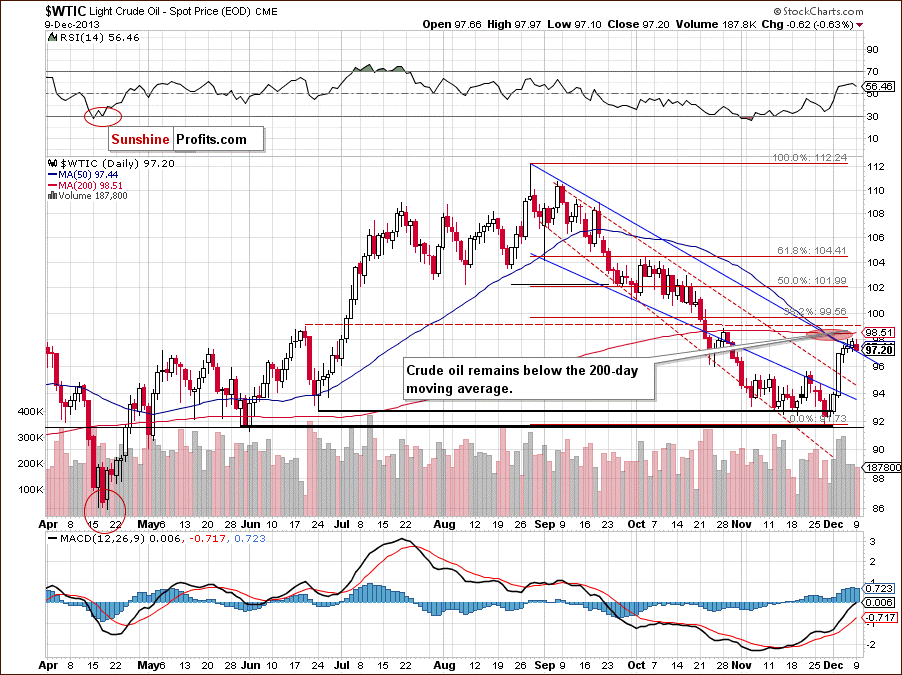
As you can see on the above chart, the situation improved significantly in the previous week. After the breakout above the upper line of the declining trend channel (in terms of daily closing prices) crude oil extended gains and broke above the upper border of the declining trend channel (in terms of intraday highs). In this way, light crude broke above both major short-term resistance levels. Additionally, the breakout materialized on relatively high volume, which confirmed the strength of the buyers.
Looking at the above chart, we see that crude oil also broke above the 50-day moving average and almost reached the 200-day moving average. As a reminder, this moving average stopped growth at the end of October. At this point it’s worth noting that Friday’s breakout materialized on lower volume (compared with previous days), which was not a bullish sign. On Monday, the proximity to the 200-day moving average encouraged oil bears to act and resulted in a decline to the previously-broken upper border of the declining trend channel (in terms of intraday highs). Please note that despite yesterday’s drop, the breakout above this line was not invalidated and it still serves as support. If it’s broken, the next support will be around $95.30.
Summing up, looking at the above charts, we clearly see that the situation improved significantly in the previous week. Crude oil not only broke above both short-term resistance lines, but also invalidated breakdowns below the long- and the medium-term support lines, which is a strong bullish sign. On top of that, recent upward move materialized on high volume, which confirmed the strength of buyers. Taking into account the fact that crude oil reached its 50-week and 200-day moving averages, a short-term pullback seems likely. However, based on the size of last week's rally and the accompanying volume, it seems that it will be just a pause / pullback, not another big move lower.
Having discussed the current outlook for crude oil, let’s examine the NYSE Arca Oil Index (XOI) to find out what the current outlook for oil stocks is.
Oil Stocks
Just like a week ago, we begin with the long-term chart.
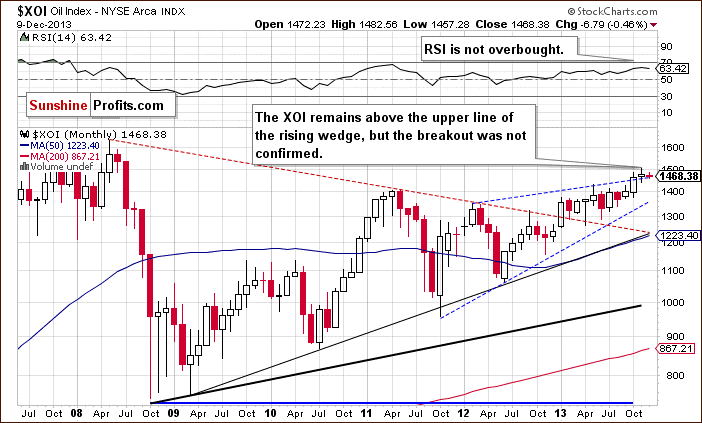
On the above chart, we see that the situation hasn’t changed much recently. Despite last week’s drop, the XOI remains above the upper line of the rising wedge. Please note that from this perspective the breakout is not yet confirmed.
The RSI is not overbought at the moment and, from this point of view, the situation remains bullish.
To see the current situation more clearly, let’s zoom in on our picture and move on to the weekly chart.
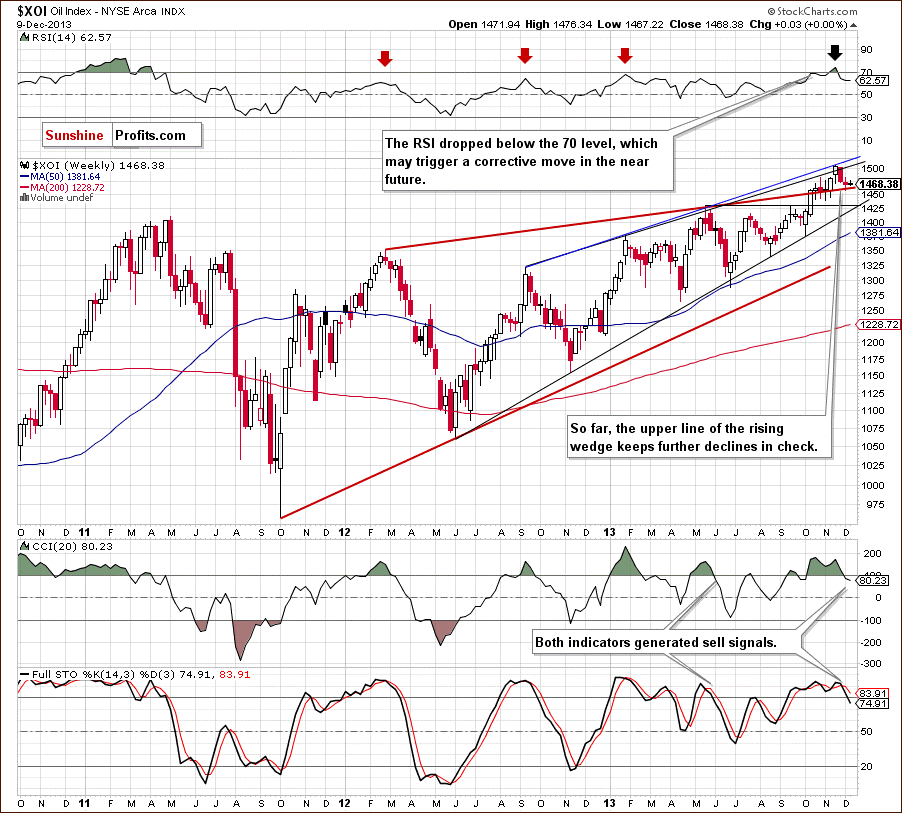
In our last Oil Investment Update, we wrote the following:
(…) the breakout above the upper line of the smaller rising wedge is invalidated, which is a bearish sign by itself. Therefore, we may see further declines in the coming week and the first target for the sellers will be the upper line of the rising wedge (marked with the red bold line) around 1,463.
Looking at the above chart, we see that we had such price action in the previous week. The oil stock index extended its decline and dropped below the support line. However, this deterioration was only temporary. The XOI rebounded and closed the week above the upper line of the rising wedge, which still serves as support.
Nevertheless, taking into account the position of the RSI and the sell signals generated by two other indicators, we may see further deterioration this week. Please note that if this support line is broken, the next target for sellers will be around 1,439, where the bottom of the previous correction is.
From the technical point of view, the medium-term uptrend remains in place at the moment, and the situation is still bullish.
Now, let’s turn to the daily chart.
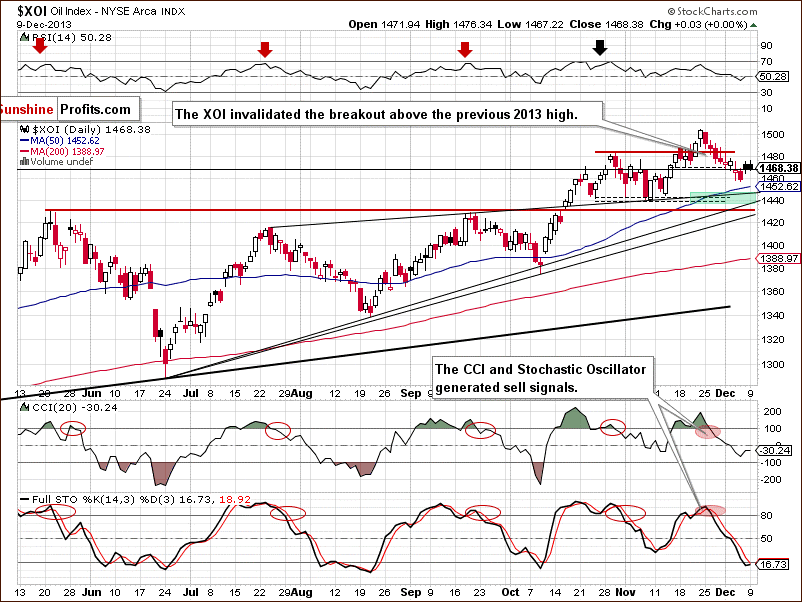
Looking at the above chart, we see that the XOI declined in the previous week once again and dropped below the bottom of the recent corrective move (at 1,470). In this way, the oil stock index also slipped below the upper line of the rising wedge (marked with the black thin line on the weekly chart), however, the breakdown was quickly invalidated, which was a positive sign. This strong support encouraged buyers to act and triggered a corrective upswing, which took the XOI above 1,470. Although the breakdown below the bottom of the recent corrective move was invalidated, the oil stock index still remains below the previous 2013 high. Additionally, sell signals generated by the indicators remain in place and encourage sellers to act.
At this point, it’s worth noting that recent days have formed a consolidation on the above chart.
Quoting our yesterday’s Oil Trading Alert:
(…) If the XOI moves above 1,475, we may see further improvement and an attempt to move above 1,483 (the previous 2013 top). On the other hand, if oil stocks drop below 1,457, we will likely see further deterioration. In this case, the first downside target will be the 50-day moving average (currently at 1,450). If it’s broken, we may see a downward move to a support zone created by the upper line of the rising wedge (marked with the thin black line) and the bottom of the correction that we saw at the beginning of November (around 1,440-1,446).
Looking at the above chart, we see that the XOI rose to its intraday high at 1,476 on Monday and broke above the upper line of the consolidation range. However, the breakout was quickly invalidated and oil stocks came back to the consolidation range. Taking this fact into account, what we wrote in our Monday’s Oil Trading alert remains up-to-date.
Summing up, from the long- and medium- term perspectives, the outlook for oil stocks remains bullish and the uptrend is not threatened at the moment. However, taking into account the medium- and short-term sell signals, further deterioration should not surprise us – especially if the XOI drops below the major medium-term support line.
Crude Oil - Oil Stocks Link
Having discussed the current situation in crude oil and the oil stock index, let’s comment on the relationship between them.
In our previous Oil Investment Update we wrote the following:
(…) two weeks back crude oil and oil stocks moved higher together. Last week, they both moved lower (…) does it mean that the strong negative correlation reversed as we have seen similar price action in both oil and oil stocks in the recent two weeks? Not necessarily. Although, the WTI and the XOI are moving in the same direction at the moment, after weeks of negative correlation it’s still too early to say if this is a meaningful reversal of the tendency or just a temporary phenomenon.
When we take a look at the above chart and compare the price action in both cases in the previous week, we see that the recent positive correlation was only temporary and we saw a return to a negative relationship between them. Last week, the XOI dropped below 1,470 and extended its decline. Meanwhile, light crude rebounded sharply and rose to its five-week high. If this relationship remains in place this week, and the oil stock index drops once again, will likely see higher values of crude oil. On the other hand, if the sellers fail and the oil index rebounds, we may see a downswing in light crude.
Ratio Analysis
Once we know the current relationship between crude oil and oil stocks, let’s take a closer look at the oil-to-oil-stocks ratio. Today, we focus on the short-term picture.
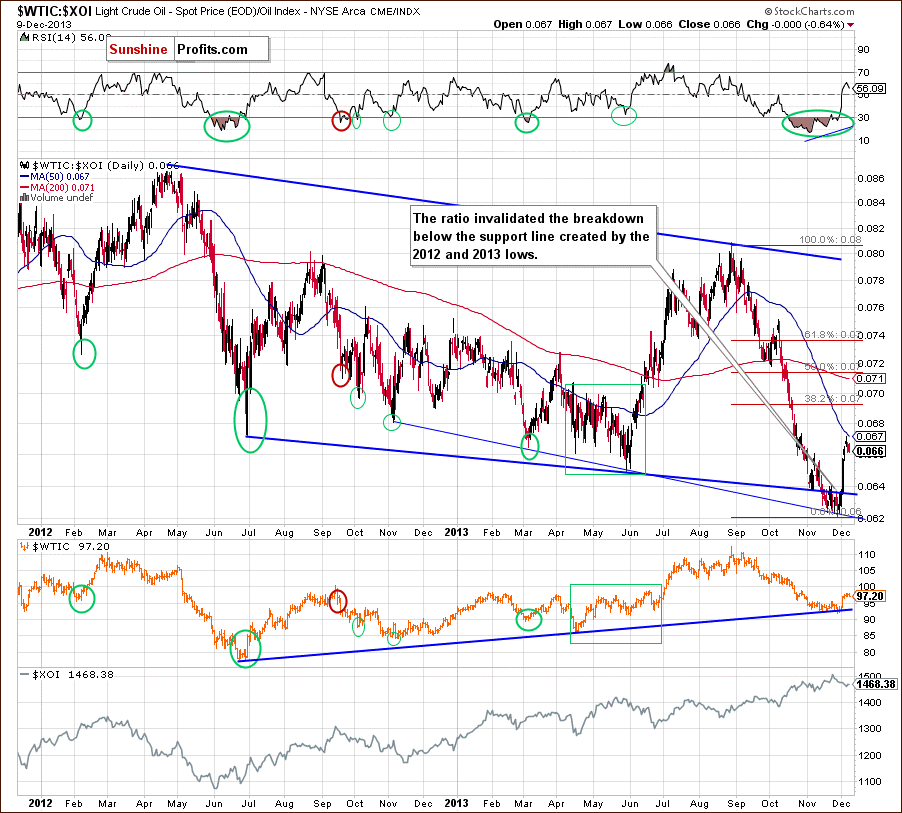
Quoting our previous Oil Investment Update:
(…) although the ratio reached the next long-term support line (marked with the thin blue line on the previous chart), it seems that as long as the breakdown below the bold blue support line is not invalidated, another downswing cannot be ruled out.
Looking at the above chart, we see that the ratio rebounded sharply in the previous week and invalidated the breakdown below the support line based on the 2012 and 2013 lows, which is a strong bullish sign.
Last week, the ratio reached its 50-day moving average and reversed the course – similarly to what we saw in April, May and June. However, we should keep in mind that back then, new lows in ratio didn’t trigger a fresh low in crude oil. Therefore, if history repeats itself once again, we may see lower values of light crude in near future, but another big move lower doesn’t seem likely.
Having discussed the above, we’ll examine the oil-stocks-to-oil ratio. What impact could it have on future oil moves? Let’s start with the long-term chart.
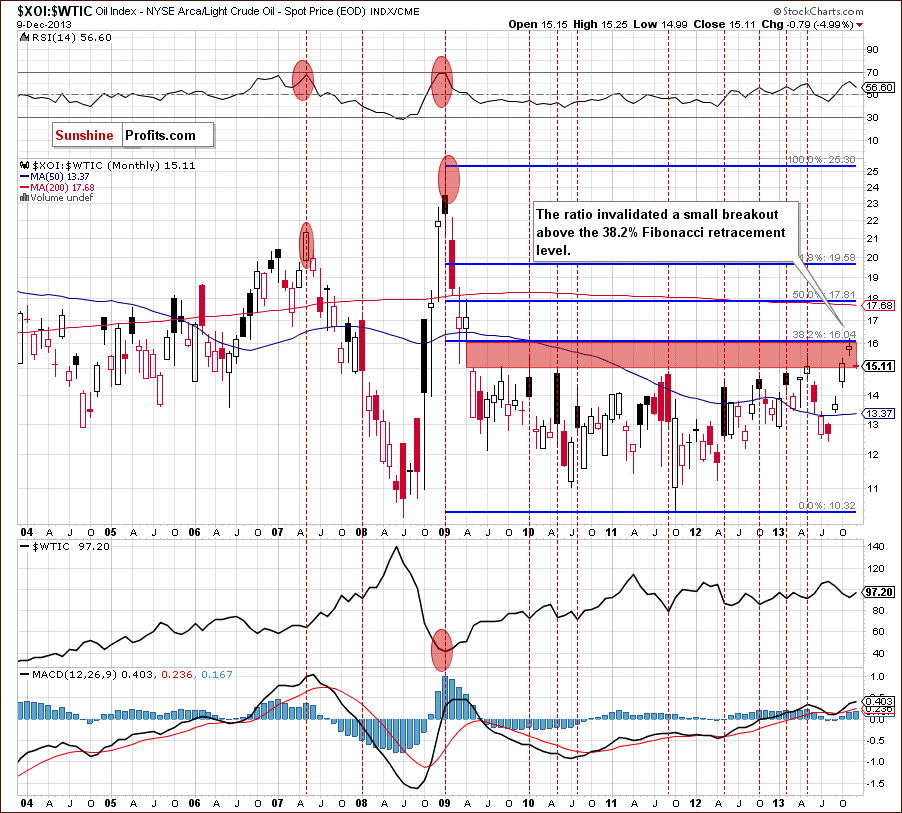
Looking at the above chart, we see that the ratio reached the 38.2% Fibonacci retracement level (based on the entire 2009-2011 decline) and invalidated a small breakout above this strong resistance level, which was a bearish signal. This circumstance triggered a downswing, which took the ratio to the lower line of the gap between the April 2009 low and May 2009 high (marked with the red rectangle), which is not supporting further growth. From this perspective, the implications for oil are bullish.
Now, let’s zoom in on our picture and examine the weekly chart.
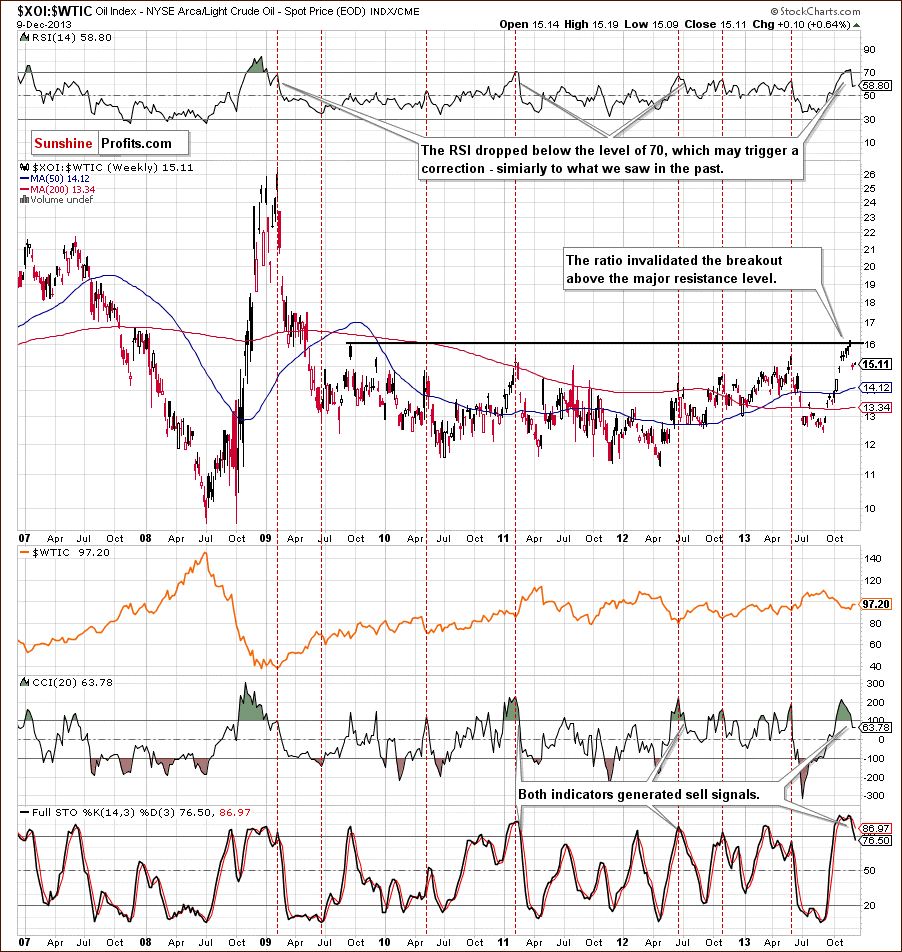
After an invalidation of the breakout above the resistance level created by the September 2009 high, which is slightly below the 38.2% Fibonacci retracement (marked on the previous chart), the ratio declined, which triggered an upswing in crude oil. Additionally, the RSI dropped below the level of 70, which suggests further deterioration in the ratio. We saw similar situations in the past and in all previous cases such circumstances had a positive impact on the price of light crude.
When we factor in the position of the CCI and the Stochastic Oscillator, we clearly see that both indicators generated sell signals, which is another bearish signal. From this perspective, the implications for crude oil are also bullish.
Now, let’s check the short-term outlook.
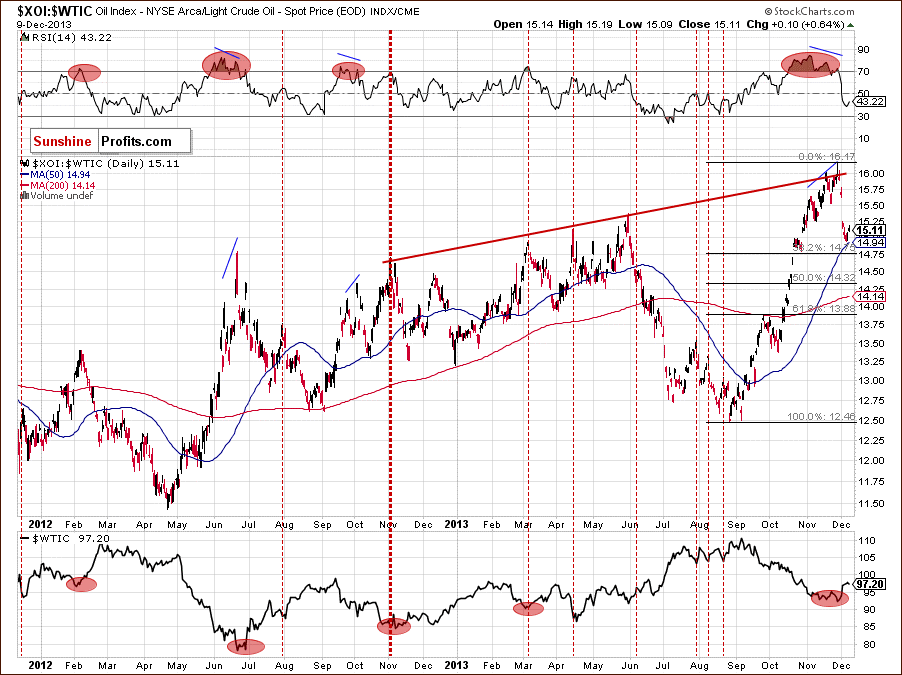
Looking at the above chart, we see that last week the ratio bounced off the medium-term rising resistance line based on the November 2012 and May 2013 highs (marked with the red line) and declined, which was in perfect tune with an upswing in crude oil.
With this downward move, the ratio reached its 50-day moving average and approached the 38.2% Fibonacci retracement level. This strong support zone triggered a corrective upswing in the recent days, which preceded a decline in light crude. Taking into account the fact that the correction is still shallow, we may see further improvement in the ratio and deterioration in crude oil.
When we take a closer look at the chart above, we notice that earlier this year we had similar situation in April. At that time, although we saw a corrective upswing in the ratio, it didn’t pushed light crude to a new low. If history repeats itself, we may see further improvement in crude oil after a corrective downswing.
Combining the long-, medium- and the short-term pictures, we clearly see that the ratio invalidated a breakout above a strong resistance zone created by the long-, medium- and short-term lines. This is a strong positive signal for oil bulls, which suggests that further growth in crude oil is just around the corner.
Before we finish this section, we would like to focus on the oil-to-gold ratio.
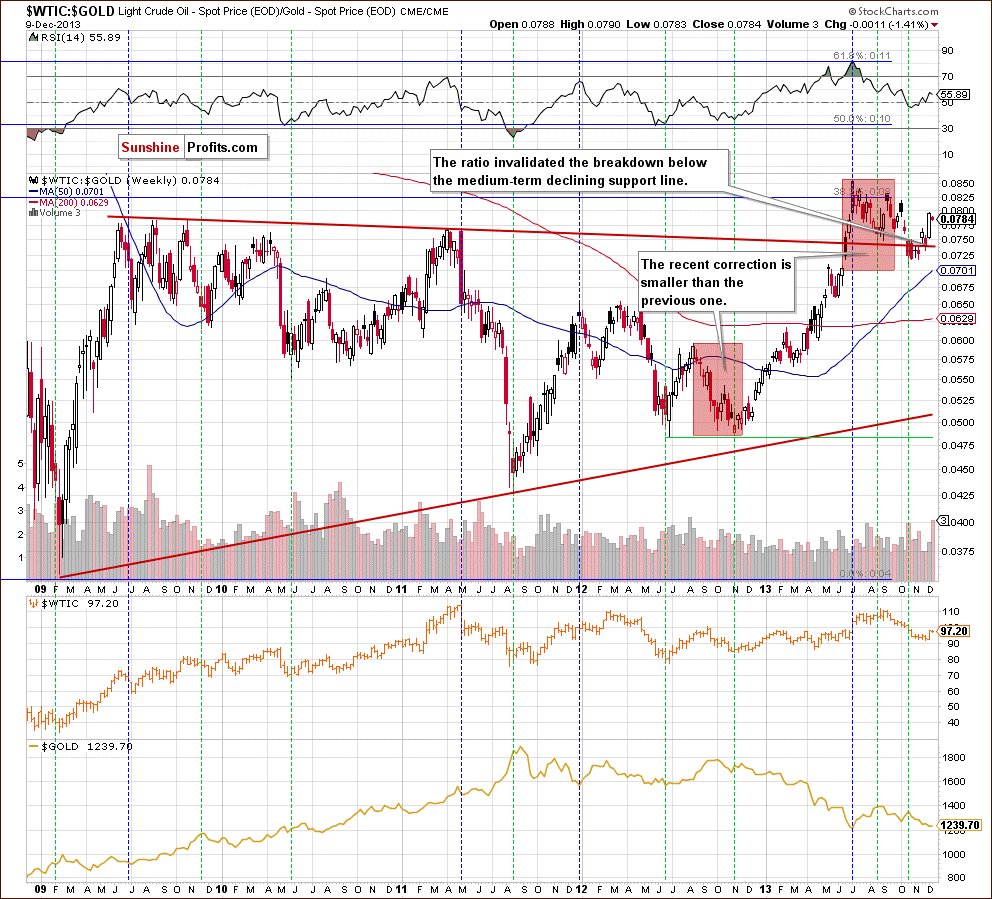
As you can see on the weekly chart, the ratio’s 2012 low was in tune with the bottom of a correction in crude oil. In November 2012, the ratio declined to its previous low, which triggered a corrective move in light crude. After that, we saw a post-double-bottom rally, which supported higher prices of crude oil.
Looking at the above chart, we see that the ratio’s 2013 top wasn’t in perfect tune with light crude’s 2013 high. However, when we take a closer look, we notice that the ratio’s September high was visibly lower than the previous one. Meanwhile, crude oil was trading near its 2013 high. This negative divergence between the ratio and the price of light crude was a negative sign and resulted in a decline in the following weeks.
With this downward move, the ratio dropped below long-term declining support line, which was a bearish sign. However, as it turned out in recent weeks, the breakdown was invalidated, which is a bullish signal for light crude.
Additionally, the recent correction is smaller than the previous one (August-November 2012), which suggests that another move to the upside is quite likely. As mentioned earlier, the rising ratio has had a positive impact on the price of crude oil since the beginning of the year. We can assume that higher values of the ratio will likely support the price of light crude.
What’ interesting, earlier this year the rising ratio had a negative impact on the price of gold. The ratio’s 2013 high was in tune with gold’s low in July. After that, this negative correlation between the ratio and gold pushed the yellow metal higher. There was a short period of time (in September), when they both dropped together, however, as it turned out, it was just a temporary phenomenon and the October decline in the ratio triggered an upward move in gold.
As you can see on the above chart, the negative correlation between the ratio and gold remains in place at the moment. Since the beginning of November the rising ratio has pushed the yellow metal lower and it seems that if this relationship remains in place in the coming days/weeks, we will likely see further deterioration in gold.
Finishing today’s Oil Investment Update, we would like to draw your attention to our last interesting chart.
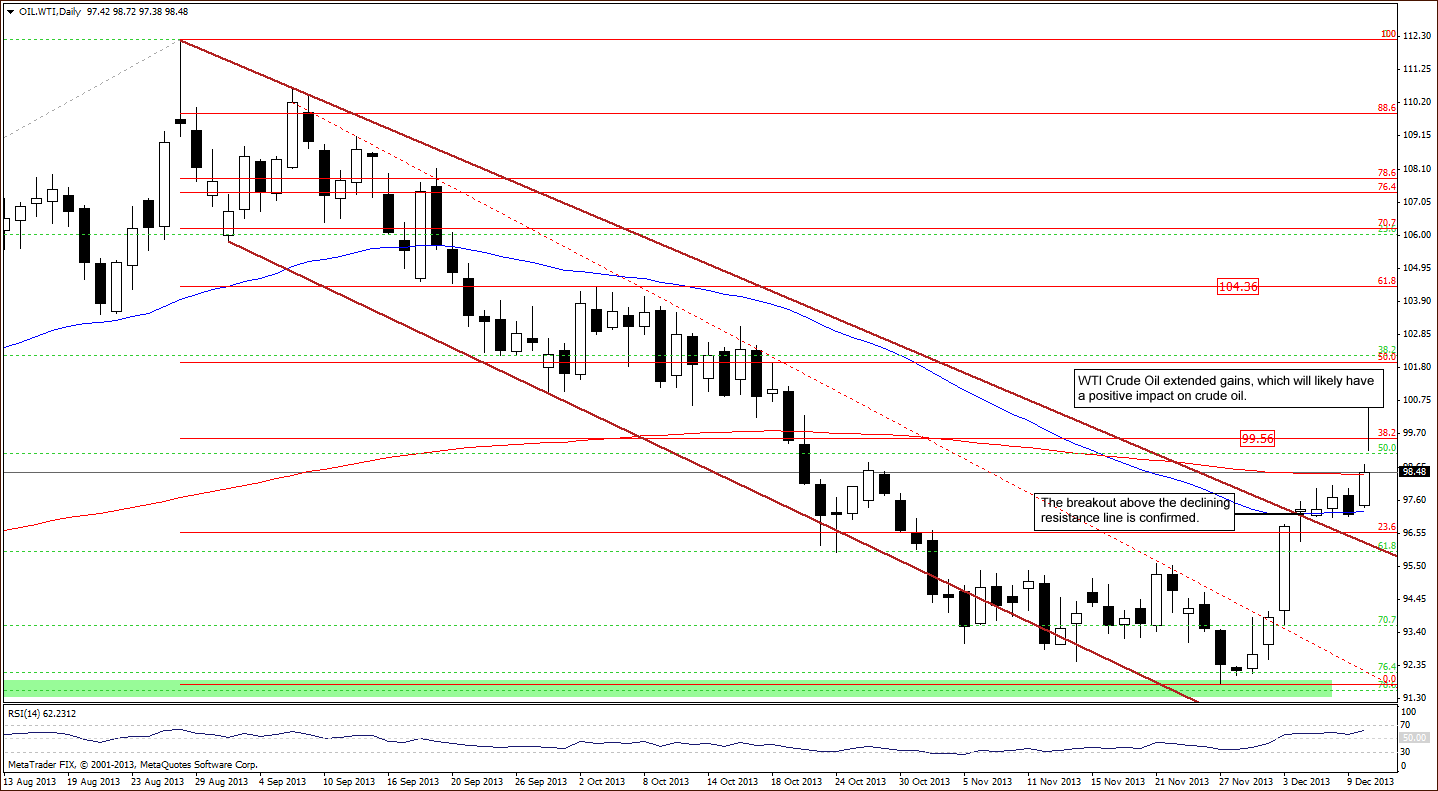
Looking at the above chart, it seems that WTI Crude Oil is a step ahead of crude oil. As you can see on the daily chart, the breakout above the upper line of the declining trend channel (in terms of daily closing prices) took place on Dec. 2. We saw similar price action in the case of crude oil only on the next day. Additionally, on Dec. 4, WTI Crude Oil broke above the upper border of the declining trend channel (in terms of intraday highs). What happened with light crude at the same time? It was still trading below this resistance line. Taking the above into account, we can conclude that if we see further improvement in WTI Crude Oil, we will likely see similar price action in crude oil in the following days.
Summary
From today’s point of view, we see that the biggest event of the previous week for crude oil investors was a sharp corrective upswing, which pushed light crude not only above both short-term resistance lines, but also invalidated two important breakdowns – below the long-term resistance line and the medium-term rising support line. With this upward move, crude oil reached its resistance zone created by the 200-day and 50-week moving averages, which may encourage oil bears to trigger a corrective move in the coming days. However, based on the size of last week's rally and the accompanying volume, it seems that it will be just a pause / pullback, not another big move lower, which is in tune with the oil-to-oil-stocks price action.
At this point, it’s worth mentioning that the WTIC:XOI ratio invalidated the breakdown below the support line based on the 2012 and 2013 lows, which is another positive factor supporting the bullish case.
Speaking of the relationship between the WTI and the XOI… We see that the recent price action was not an important reversal of the tendency where oil and oil stocks move in opposite directions. Nevertheless, we should keep an eye on this relationship in the following days to find more clues about future price movements in crude oil and oil stocks.
Very short-term outlook: bullish
Short-term outlook: bullish
MT outlook: mixed with bullish bias
LT outlook: mixed with bullish bias
Trading position (short-term): Long. Stop-loss order for this position: $91.55. Stop-loss order for WTI Crude Oil: $91.30. We will keep you informed should anything change, or should we see a confirmation/invalidation of the above.
This completes this week’s Oil Investment Update. Our next Oil Investment Update is scheduled for Tuesday, Dec. 17, 2013. Oil Trading Alerts subscribers will additionally receive similar but shorter alerts on a daily basis (or more than once a day when the situation requires it).
Thank you.
Nadia Simmons
Sunshine Profits' Crude Oil Expert
Oil Investment Updates
Oil Trading Alerts

