
- Fundamentals, Technical Analysis and Crude Oil
- Crude Oil
- Oil Stocks
- Crude Oil - Oil Stocks Link
- Ratio Analysis
- Oil Stocks – Stocks Link
- Summary
Fundamentals, Technical Analysis and Crude Oil
November was another hard month for oil bulls. Market participants pushed crude oil down 3.6% as rising supplies weighted on the price. With this downward move, light crude hit a fresh monthly low of $91.77 and broke not only below the short-term support, but also the medium-term one. Although we noticed a pullback which took the price to slightly below $94 on Friday, light crude posted its seventh weekly loss in eight weeks.
The most important factors driving prices lower in recent weeks were rising crude oil supplies, the U.S economic numbers, which fueled the idea that the Federal Reserve will taper its stimulus program (sooner than expected) and weakening tensions between Iran and the West.
Nevertheless, the key word here is "inventories". The price of light crude has been under strong selling pressure in recent weeks as traders view the market as adequately supplied. Production in the U.S. has soared to near 20-year highs due mainly to hydraulic fracturing and horizontal drilling techniques, which have enabled energy producers to extract supplies trapped in shale-oil fields. As a result, domestic stockpiles have grown by 35.8 million barrels, or 10%, over the past 10 weeks and, as of Nov. 22, stood at 391.4 million barrels, their highest level since Jun. 21. On top of that, U.S. inventories are the highest for this time of year since 1930. This sharp increase has helped send U.S. prices lower for three consecutive months.
In our Wednesday’s Oil Trading Alert, we wrote the following:
(…) today the U.S. Energy Information Administration (EIA) report could show crude stockpiles rose by 900,000 barrels. Please note that if we see such (or lower) increase, the price of light crude will likely move higher – similarly to what we saw a week ago. However, if the data is better-than-expected, crude oil will probably re-test the November low.
What was the EIA data release? The EIA said in its weekly report that crude oil supplies grew by 3 million in the week ended Nov. 22, which was significantly above expectations. We didn’t have to wait long for the results of this very bearish report. Investors pushed the sell button and sent crude oil to the lowest level in almost six months.
Taking into account the significant impact of inventories on the price, this week we will keep an eye on data from the American Petroleum Institute late on Tuesday and weekly oil inventory data from the Energy Information Administration on Wednesday.
Will this week’s data be as bearish as last week’s? As is well known, more refineries come back from seasonal maintenance. Therefore, crude stockpiles could begin falling and product stockpiles could grow. If this happens (maybe not this week, but likely this month), the price of light crude will likely find supporting fundamental factors. On a side note, historically, refineries try to reduce their crude stockpiles before year-end tax assessments based on storage levels.
And speaking of the production... Last week the OPEC members disagreed over whether to cut the cartel's oil output in the coming months, amid booming U.S. production and the potential return of Iranian crude to world markets. Oil investors are looking ahead to a meeting of the Organization of the Petroleum Exporting Countries in Vienna later this week. OPEC is forecast to keep its supply target unchanged at 30 million a day on Dec. 4. While OPEC hasn't changed its production ceiling in two years, there are rumors that some members are pushing for a cut in output next year. What could happen if we see production cutbacks?
Before we try to answer this question, last week‘s historic nuclear deal between Iran and six world powers is worth a mention. Despite the fact that this agreement eased Middle East geopolitical tensions and raised expectations of increased global production, it turned out that this accord had a limited impact on the physical market. Oil investors remained skeptical about how quickly Iran can ramp up production and increase its exports following this diplomatic deal. From this point of view, it seems that a short-term deal is not enough to talk about a new flood of Iranian oil coming into the market.
Taking this fact into account, it seems that even if OPEC cuts its production next year, it will likely have little impact on crude oil, because the major problem is in the United States. The continuous rise in stockpiles, even though refineries ramp up runs to meet winter demand, clearly shows that there is just too much local production.
This week, investors will be closely watching U.S. manufacturing activity on Monday, the new-home sales report on Wednesday, U.S jobless claims and the second look at third-quarter gross domestic product scheduled for Thursday, and also nonfarm payrolls and the unemployment rate on Friday. These U.S. data will give a clearer view of the strength of the economy and the demand outlook for the world's biggest oil consumer.
The Fed, which holds its next meeting on Dec. 17-18, said that the timing of its tapering depends on the health of the labor and housing markets. This is why the above-mentioned numbers are so important. However, it’s hard to assume how investors will react this time. In the previous month, stronger than expected U.S. economic data, fueled speculation that the Fed may start to roll back its monetary stimulus in December (instead of March) and weighed on most commodities. As a reminder, the Fed’s stimulus program is viewed as a key driver in boosting the price of commodities as it tends to depress the value of the dollar. Therefore, a cutback in stimulus by the Fed later this year would reduce the supply of dollars and make dollar-denominated assets such as oil more expensive for holders of other currencies. From this point of view, it would be a strong bearish factor for crude oil. On the other hand, stronger than expected figures suggest economic improvement, raising the prospect for stronger oil demand in the world's biggest energy consumer, and laying the groundwork for higher prices. Taking the above into account, we can conclude that, as in the case of U.S. inventories, you should focus on whether the data are better or weaker than expected and try to puzzle out the impact of the data on the economy's progress.
Crude Oil
To see what the crude oil market itself can tell us, let's jump straight into the technical part of this week‘s Oil Investment Update. Just like in previous weeks, we’ll take a look at charts in different time horizons to have a more complete picture of the current situation in the market.
Let’s start with a look at the monthly chart of light crude (charts courtesy by http://stockcharts.com).
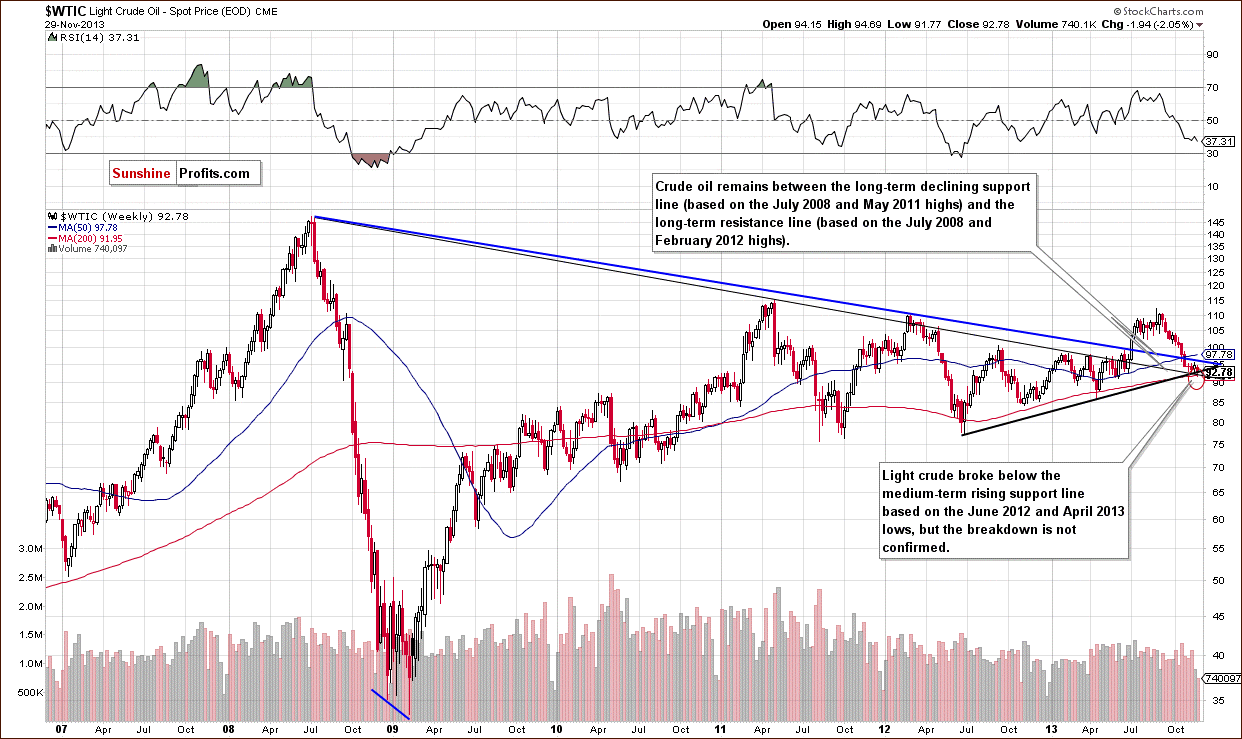
The situation in the long-term chart hasn’t changed much recently. In spite of a drop to a fresh monthly low, crude oil still remains between two long-term declining support/resistance lines.
As we wrote in our previous Oil Investment Update:
(...) When we take the blue one (based on the July 2008 and February 2012 highs) into account, we see that the breakdown below this line is confirmed, which is a strong bearish signal.
On the other hand, if we take into account the black long-term support line (based on the July 2008 and May 2011 highs), we see that light crude still remains above it and the situation is not as bearish as it might seem at first glance.
From this perspective, the picture remains unclear.
Now, let’s zoom in on our picture of the oil market and see the weekly chart.
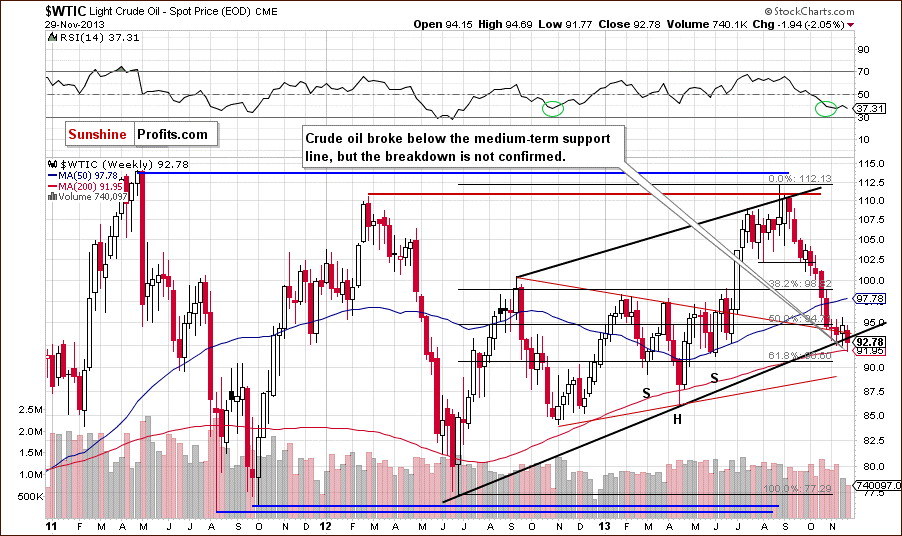
As you can see on the above chart, after three unsuccessful attempts to break below the medium-term support line (marked with the black bold line) oil bears showed their claws and finally pushed the price of light crude below this important support level in the previous week.
In our last Oil Investment Update, we wrote the following:
„(...) if this strong support is broken, the first price target for the sellers will be the 200-week moving average, and the next one - the 61.8% Fibonacci retracement level based on the entire 2012-2013 rally (slightly above $90).”
Looking at the above chart, we clearly see that crude oil reached the first price target and pulled back. Despite this fact, it closed the previous week below the medium-term support line, which is not a positive sign for oil bulls. However, the breakdown is not confirmed at the moment.
Now, let’s check the short-term outlook.
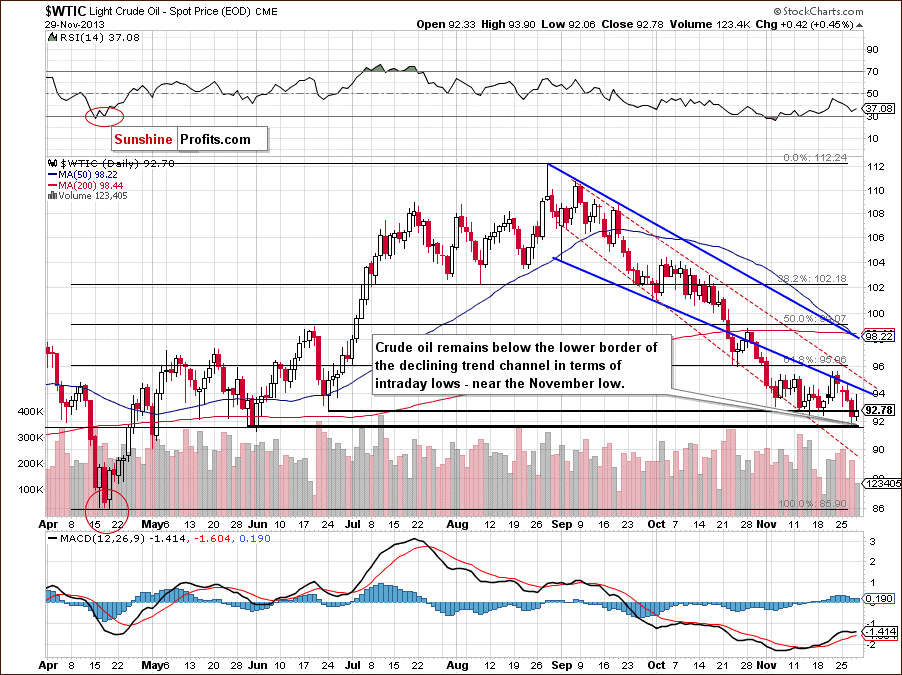
As you can see on the above chart, the situation deteriorated in the previous week. After an invalidation of the breakout above the lower border of the declining trend channel (in terms of intraday lows), crude oil declined.
As we wrote in our Wednesday’s Oil Trading Alert:
(…) buyers didn’t manage to break above this strong resistance(…) crude oil bounced off the lower border of the declining trend channel and dropped below $94. From this point of view, it seems that yesterday’s pullback (after the open) might be a confirmation of a breakdown that we saw on Friday. In this case, we may see further deterioration and a re-test of the November low.
As you can see on the above chart, we had such price action on the following day. Oil bulls didn’t manage to hold the November low and the price hit a fresh monthly low of $91.77. With this downward, move light crude dropped to the next support level created by the May low (in terms of daily closing prices). Looking at Friday’s session, we see that crude oil rebounded, but this pullback is too small to say that the worst is behind oil bulls. Taking into account the upper shadow of Friday’s candlestick, we clearly see that the proximity to the lower border of the declining trend channel still has a negative impact on the price. Therefore, our last week’s assumption: “as long as this strong resistance is in play, further growth is limited and a bigger pullback is unlikely” remains in place.
Before we summarize this section, please note that slightly below the November low is the 78.6% Fibonacci retracement level (at $91.54) based on the entire April-August rally, which reinforces this area and serves as additional support. However, if it is broken, we might see a decline to the lower border of the declining trend channel in terms of daily closing prices (marked with the red dashed line) around $89 per barrel.
Summing up, looking at the above charts, we clearly see that the situation deteriorated in the previous week. Crude oil not only hit a fresh monthly low but also broke below the medium-term support line, which is a bearish sign. Nevertheless, the breakdown is not confirmed and light crude remains above the long-term declining support line and the 78.6% Fibonacci retracement (based on the entire April-August rally). As long as these support levels are in play and the breakdown is not confirmed, a bigger medium-term decline seems limited.
Having discussed the current outlook for crude oil, let’s examine the NYSE Arca Oil Index (XOI) to find out what the current outlook for oil stocks is.
Oil Stocks
Just like a week ago, we begin with the long-term chart.
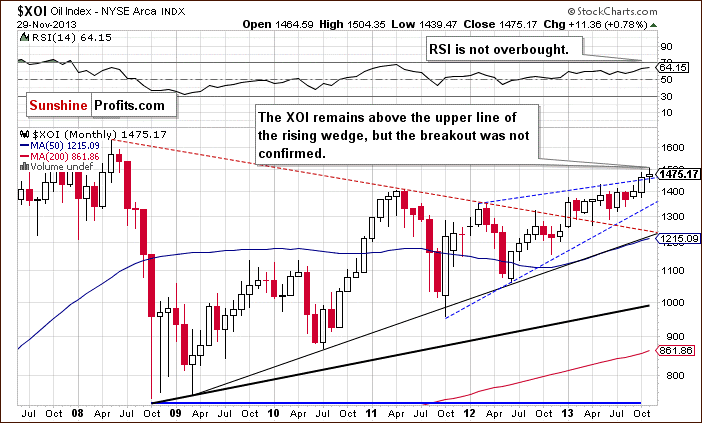
On the above chart, we see that the situation hasn’t changed much recently. The XOI remains above the upper line of the rising wedge, but the breakout is not yet confirmed.
The RSI is not overbought at the moment and, from this point of view, the situation remains bullish.
To see the current situation more clearly, let’s zoom in on our picture and move on to the weekly chart.
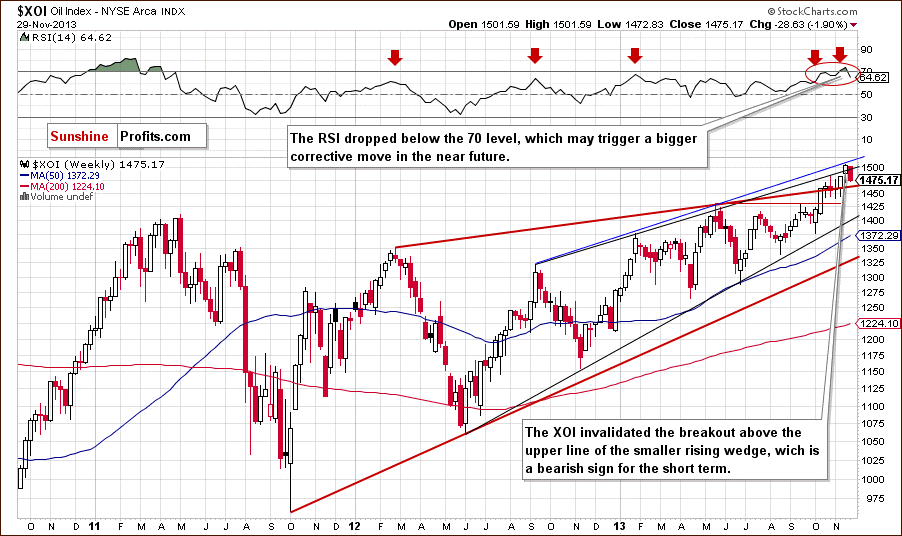
In our last Oil Investment Update, we wrote the following:
(...) the blue medium-term resistance line encouraged sellers to act and triggered a corrective move which pushed the XOI below the upper line of the smaller rising wedge (marked with the black line). Nevertheless, it’s too early to say that last week’s breakout above this line was invalidated. However, if we see a weekly close below this resistance (currently around 1,495) the breakout will be invalidated and the implications will be bearish.
As you can see on the above chart, we had such price action in the previous week and the breakout above the upper line of the smaller rising wedge is invalidated, which is a bearish sign by itself. Therefore, we may see further declines in the coming week and the first target for the sellers will be the upper line of the rising wedge (marked with the red bold line) around 1,463. If this support doesn’t encourage buyers to act, the next support will be around 1,439, where the bottom of the previous correction is.
From the technical point of view, the medium-term uptrend remains in place at the moment, and the situation is still bullish.
Now, let’s turn to the daily chart.
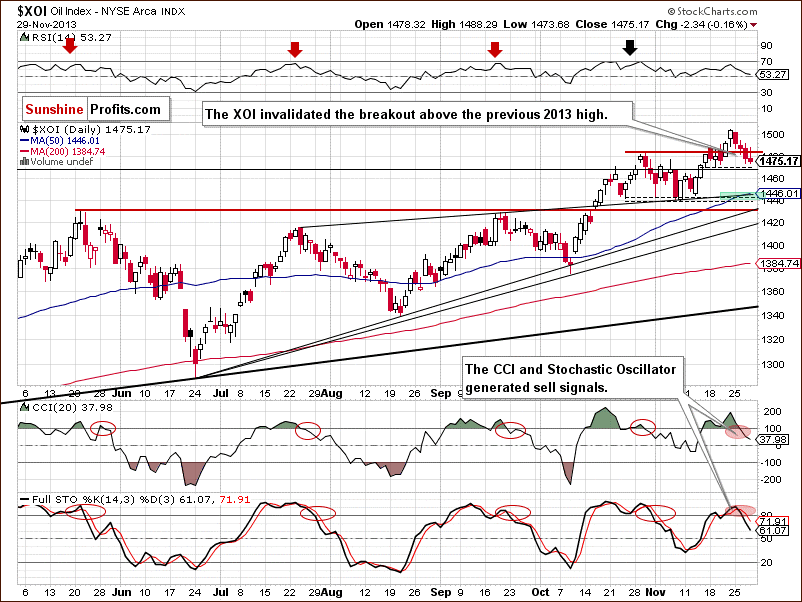
Looking at the above chart, we see that the XOI declined in the previous week and almost reached the bottom of the recent corrective move. In this way, the oil stock index corrected 50% of its November rally and, from this point of view, the correction is still shallow. Taking this fact into account and combining it with the proximity to the support level, we may see a pullback in the coming days.
However, we should keep in mind that this downswing pushed the XOI below the previous 2013 high and the breakout above this level was invalidated, which by itself is a bearish sign. On a side note, an invalidation of the breakout above the previous annual high was the first step to declines in the WTI in August.
Additionally, when we take a closer look at the position of the indicators we clearly see that they generated sell signals. We saw similar situation at the beginning of the month. Back then, it had a negative impact on the XOI and we saw a correction which took oil stocks to the bottom of the previous corrective move. If history repeats itself once again, we may see similar price action in the coming week.
Please note that if the XOI drops below 1,470, we will likely see further deterioration. In this case, a downside target will be around 1,445 (marked with the green rectangle), where the upper line of the rising wedge intersects with the 50-day moving average and the bottom of the correction that we saw at the beginning of November.
Summing up, from the long- and medium- term perspectives, the outlook for oil stocks remains bullish and the uptrend is not threatened at the moment. However, taking into account the short-term picture, we see that the sellers triggered another correction and further deterioration should not surprise us – especially if the XOI drops below 1,470.
Crude Oil - Oil Stocks Link
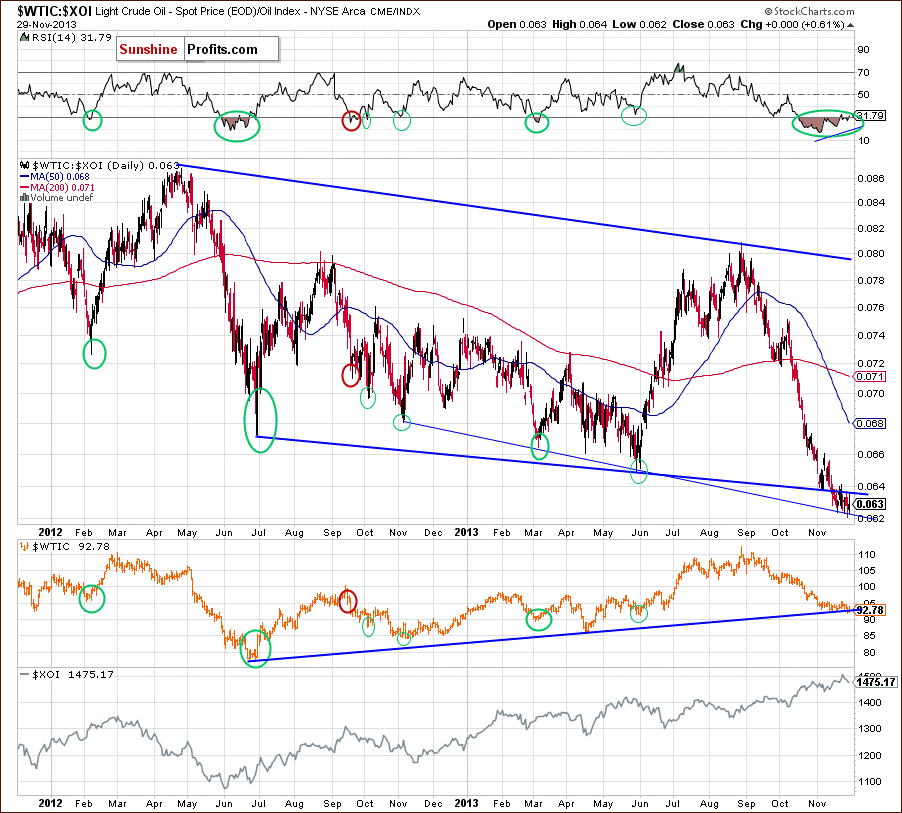
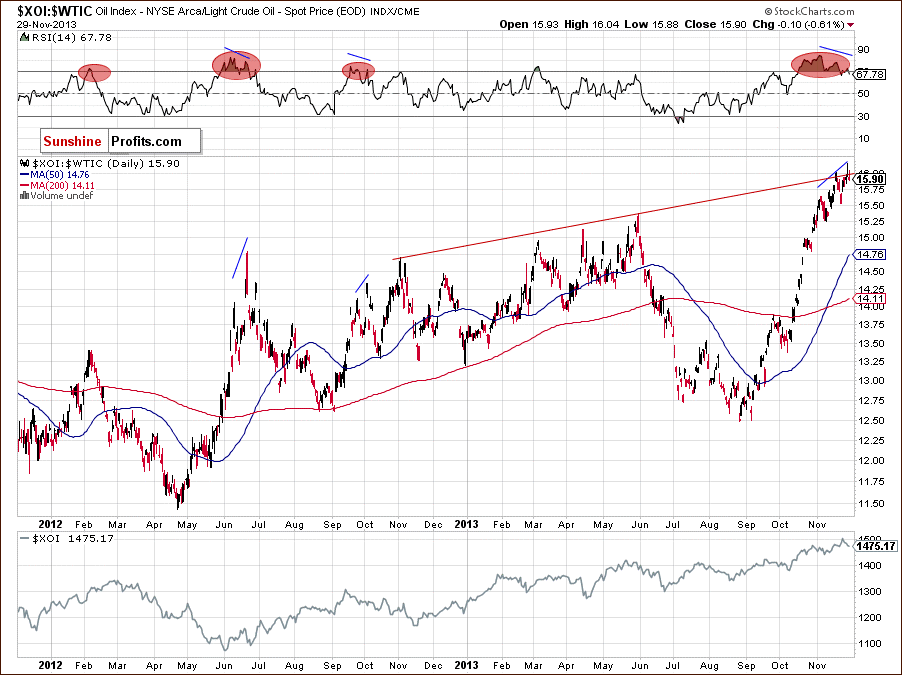
Having discussed the current situation in crude oil and the oil stock index, let’s comment on the relationship between them. Normally (historically), crude oil and oil stocks either rallied together or declined together. At this time, we have a lasting anomaly - oil declines while oil stocks rally. You can see this situation more clearly on the chart below.
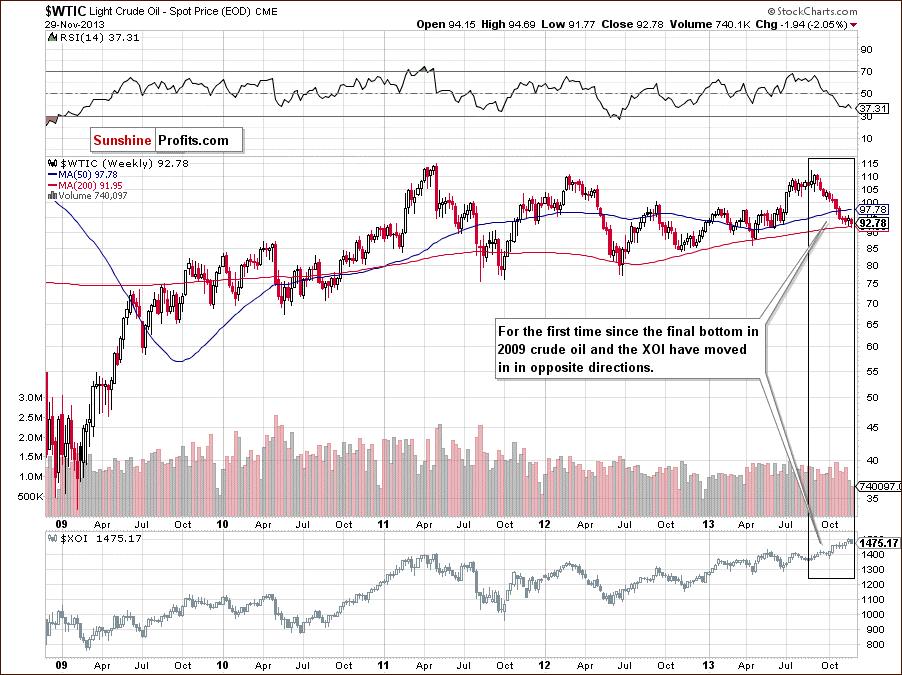
As you can see on the above chart, since the final bottom in 2009 crude oil and the oil stock index have generally moved together. We wrote more about their relationship in our first Oil Investment Update at the end of August:
(…) At the beginning of 2012 both WTI and the XOI formed their tops in the same month (February). However, the oil index hit its bottom earlier and when we saw a recovery in oil stocks, crude oil was still declining. It’s also worth noting that in September there were new local tops, but light crude erased fewer losses than the oil index. Although both WTI and the XOI formed their local bottoms in November, the following months showed that oil stocks were much stronger. At the beginning of this year we saw a breakout above the previous local top on the XOI chart, but we didn’t see such price action in WTI (light crude climbed above the September 2012 high in July). What’s interesting, the oil index extended gains and broke above the 2012 top in May. Meanwhile, light crude is still trading below this resistance level.
In the following Oil Investing Updates, we pointed to the growing disparity between crude oil and the oil stock index. Finally, we noticed a negative divergence, which has intensified in recent months. As a reminder, in the middle of October we saw a sharp pullback in the XOI, which resulted in the highest weekly close since June 2008. At the same time light crude declined, closed at its lowest level since June and hit a new October low. We saw similar situation in November - oil stocks continued their rally and hit a fresh 2013 high on Nov. 22, while crude oil declined once again and reached a new monthly low.
Once we know this, let’s examine the connection between them in the short term.
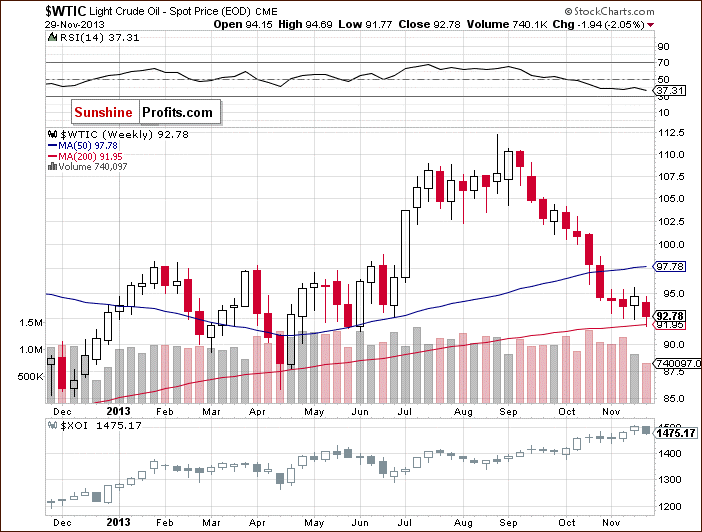
When we take a look at the above chart and compare the price action in both cases, we see that oil stocks and crude oil moved lower together in the previous week. Despite this similar price action, oil stocks remain strong compared with light crude. Although they didn’t continue their rally, the oil stock index still remains near the 2013 high. Meanwhile, light crude declined once again and hit a fresh monthly low of $91.77, which clearly shows its weakness in comparison with oil stocks.
Looking at the above chart, we see that two weeks back crude oil and oil stocks moved higher together. Last week, they both moved lower. At this point, you might ask an important question: does it mean that the strong negative correlation reversed as we have seen similar price action in both oil and oil stocks in the recent two weeks? Not necessarily. Although, the WTI and the XOI are moving in the same direction at the moment, after weeks of negative correlation it’s still too early to say if this is a meaningful reversal of the tendency or just a temporary phenomenon.
However, taking the above into account, we should consider two scenarios.
The first of them assumes that the positive correlation is only temporary and we’ll see a return to a negative relationship between them once again. In this case, if the XOI drops below 1,470 and extends its decline, we will likely see higher values of crude oil. On the other hand, if the sellers fail and the oil index rebounds, we may see further deterioration in light crude.
The second scenario assumes that the positive correlation will remain in place. In this case, if the XOI drops below 1,470 and extends its decline, we will likely see a decline in crude oil as well. Taking into account the fact that oil remains weaker compared with oil stocks, it seems that if we see a correction in the XOI, light crude will likely accelerate its decline. However, if the oil index rebounds, we’ll see another pullback in light crude.
Ratio Analysis
Once we know the current relationship between crude oil and oil stocks, let’s take a closer look at the oil-to-oil-stocks ratio. Today, we begin with the short-term chart.
The situation has deteriorated. Although the long-term support line based on the 2012 and 2013 lows encouraged the buyers to act and resulted in a pullback, this improvement was only temporary. In early November, the ratio reversed course and declined below this long-term support, which triggered a downswing in crude oil.
As you can see on the above chart, the WTIC:XOI ratio verified the breakdown below the support line based on the 2012 and 2013 lows, so crude oil could become even more oversold relative to the oil stocks - which might happen, if the breakdown below the medium-term support line for crude oil is confirmed.
Let’s zoom out our picture and focus on the long-term chart.
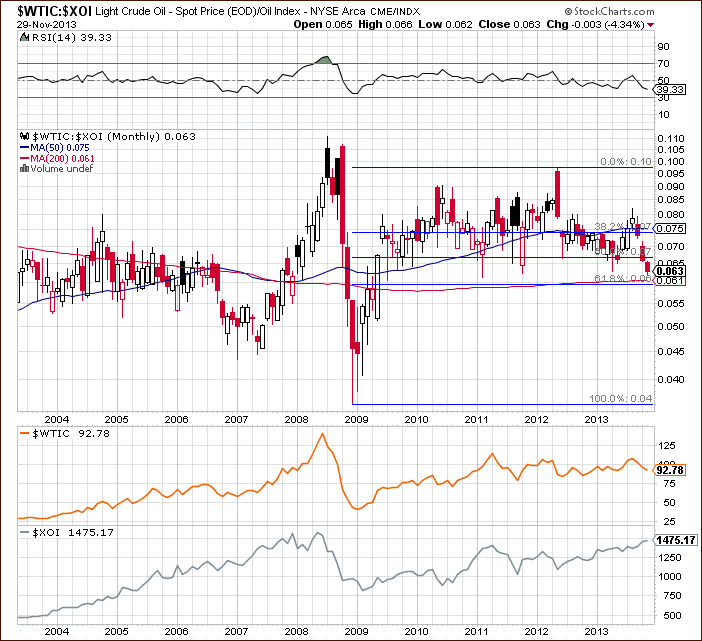
From a long-term point of view, we have the 61.8% Fibonacci retracement level based on the 2008 - 2012 rally in the WTIC:XOI ratio visibly below the current value of the ratio, which further supports our earlier remarks.
Connecting the long- and the short-term picture, we can conclude that although the ratio reached the next long-term support line (marked with the thin blue line on the previous chart), it seems that as long as the breakdown below the bold blue support line is not invalidated, another downswing cannot be ruled out.
Having discussed the above, we’ll examine the oil-stocks-to-oil ratio. What impact could it have on future oil stocks’ moves? Before we try to answer this question, we want to emphasize a strong positive correlation between the ratio and the oil stock index in recent months. When we compare the situation in both cases, we clearly see that the entire Sept.-Nov. rally in the XOI was in perfect tune with the ratio’s rally. Please note that in 2012 and also at the beginning of 2013, higher values of the ratio didn’t correspond to the price action in the oil socks index as precisely as they do now (we marked these cases with green rectangles on the weekly chart). If this strong positive relationship between the XOI and the ratio remains in place, we can find interesting tips analyzing the charts below. Let’s start with the long-term chart.
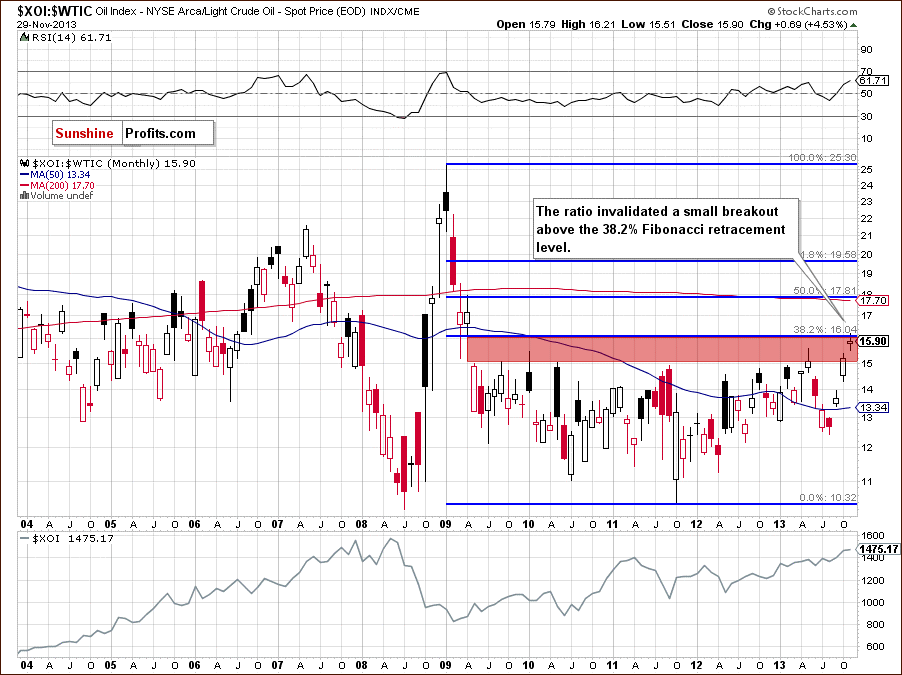
Looking at the above chart, we see that the ratio reached the 38.2% Fibonacci retracement level (based on the entire 2009-2011 decline). As you can see, there was a small breakout above this strong resistance level, but it was invalidated, which is a bearish signal. Additionally, the ratio still remains in the gap between the April 2009 low and May 2009 high (marked with the red rectangle), which is not supporting further growth. From this perspective, the implications for oil stocks are bearish.
Now, let’s zoom in on our picture and examine the weekly chart.
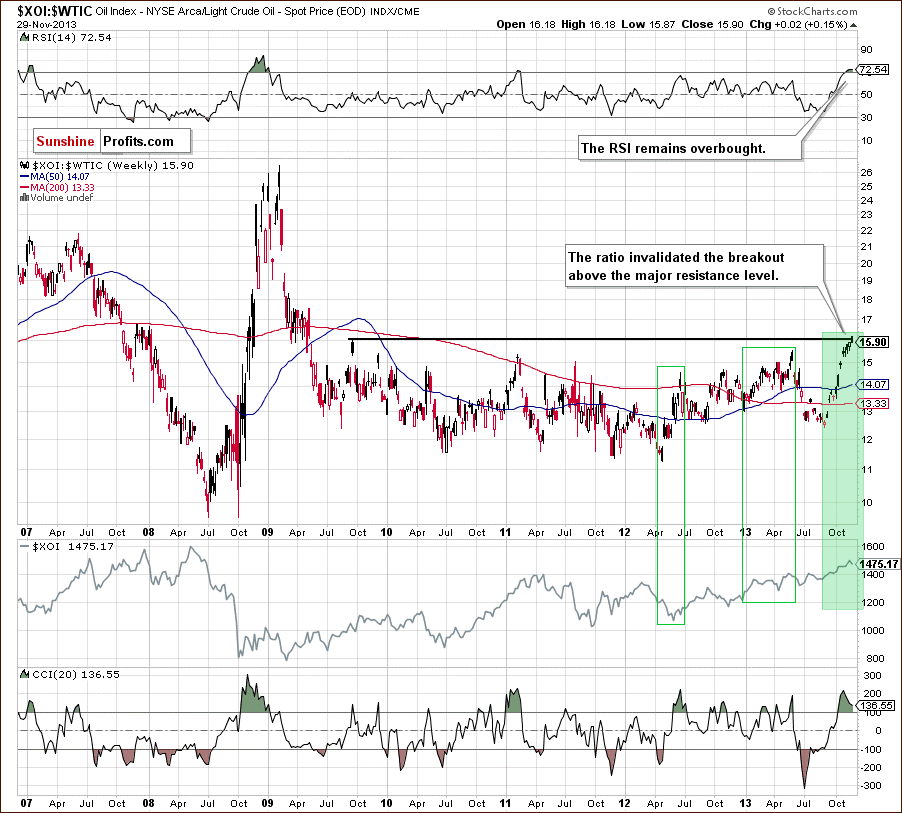
The first thing that catches the eye on the above chart is an invalidation of the breakout above the resistance level created by the September 2009 high, which is slightly below the 38.2% Fibonacci retracement (marked on the previous chart). An invalidation by itself is a bearish signal, which, in combination with the position of the RSI, suggests further deterioration in the ratio.
When we factor in the position of the CCI, we clearly see that the indicator is extremely overbought. On top of that, there is a negative divergence between this indicator and the recent upswing in ratio, which is another bearish signal. From this perspective, the implications for the oil stock index are also bearish.
Now, let’s check the short-term outlook.
Looking at the above chart, we see that last week the ratio moved higher and broke above the previous high. With this upward move, the ratio broke above the medium-term rising resistance line based on the November 2012 and May 2013 highs (marked with the red line). However, the breakout was invalidated, which does not bode well for the ratio.
Additionally, we clearly see a deepening divergence between the RSI and the ratio. At this point it’s worth noting that a similar divergence between the RSI and the XOI triggered a correction in the previous week in the oil stock index. Therefore, taking into account strong positive correlation between the ratio and oil stocks, if the ratio declines in the coming days, the XOI will likely extend its decline.
Connecting the long-, medium- and the short-term pictures, we clearly see that the ratio reached a strong resistance zone created by the long-, medium- and short-term lines. Although we saw breakouts above them, they all were invalidated. This is a strong negative signal for oil stocks holders, which suggests that further declines are just around the corner.
Oil Stocks – Stocks Link
Before we summarize, we would like to focus on the relationship between oil stocks and the general stock market once again. Let’s start with the weekly chart.
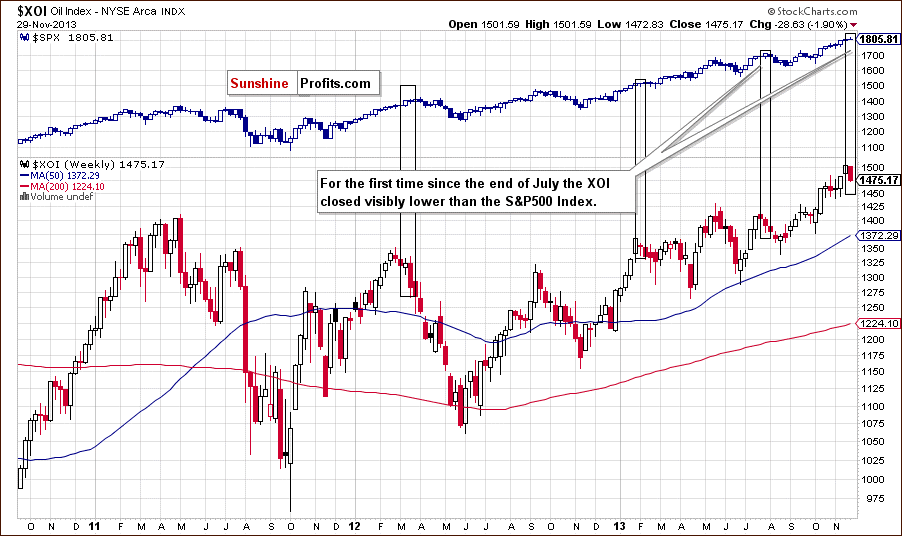
Looking at the above chart, we see that in the second half of the month there was similar price action in both indices. They moved higher and hit fresh annual highs. They also broke above their psychological barriers - 1,500 in the case of the oil stock index and 1,800 in the case of the S&P500. However, this strong positive correlation between them waned in the previous week. As you can see on the above chart, for the first time since the end of July, the XOI closed visibly lower than the S&P500 Index.
In our first comment on the relationship between the oil stock index and the S&P500, we wrote that there were periods of time when the latter was stronger than the former. Such divergence triggered declines in both indices several times in the past. If history repeats itself, we may see a similar situation in the coming week (or weeks). Taking into account the previous cases and the fact that oil stocks remain weaker compared with stock, it seems that if we see a correction in the S&P 500 Index, the XOI will likely accelerate its decline.
Summary
From today’s point of view, we see that the biggest event of recent days for crude oil investors was a breakdown below the major medium-term support line. Please note that this line is also a lower border of the rising trend channel and if the breakdown is confirmed, a bigger medium-term decline seems quite likely. Nevertheless, the breakdown is not confirmed at the moment and light crude remains above the long-term declining support line and the 78.6% Fibonacci retracement (based on the entire April-August rally). As long as these supports are in play, space for another decline seems limited.
At this point, it’s worth mentioning that the WTIC:XOI ratio verified the breakdown below the support line based on the 2012 and 2013 lows, so crude oil could become even more oversold relative to the oil stocks - which might happen if the breakdown below the medium-term support line in the price of crude oil is confirmed.
And speaking of the relationship between the WTI and the XOI… We clearly see that we have had some interesting action in recent weeks - oil declined while oil stocks rallied as you could see very clearly on the long-term chart. And last week they both moved lower. As mentioned earlier in this Oil Investment Update, it’s too early to claim that the recent price action is an important reversal of the tendency where oil and oil stocks moved in opposite directions (or at least not directly in the same direction). We should keep an eye on this relationship in the following days to find more clues about future price movements in crude oil and oil stocks.
Very short-term outlook: bearish
Short-term outlook: bearish
MT outlook: bearish
LT outlook: unclear
Trading position (short-term): The best approach at this time in our view is to wait and see how crude oil reacts to the current combination of the long-term support levels. If they are broken, we will likely see a major decline and we will likely suggest opening short positions. If we see a strong bounce and a beginning of a rally, we will suggest going long. We will keep you informed should anything change, or should we see a confirmation/invalidation of the above.
This completes this week’s Oil Investment Update. Our next Oil Investment Update is scheduled for Tuesday, Dec. 10, 2013. Oil Trading Alerts subscribers will additionally receive similar but shorter alerts on a daily basis (or more than once a day when the situation requires it).
Thank you.
Nadia Simmons
Sunshine Profits' Crude Oil Expert
Oil Investment Updates
Oil Trading Alerts

