
- Is the Final Bottom in Crude Oil Already In?
- Crude Oil
- Oil Stocks
- Crude Oil - Oil Stocks Link
- Ratio Analysis
- Summary
Looking at the chart of crude oil from today’s point of view, we can finally see a small improvement. After sixth straight weeks of losses, light crude posted its first weekly gain in seven weeks, as stronger-than-expected U.S. economic data eased concerns over the health of the world’s largest oil consumer. Although crude oil dropped to a fresh monthly low in the previous week, the long-, medium- and short-term support finally encouraged oil bulls to act. We noticed a pullback, which took light crude to its first important resistance. Despite yesterday’s drop, the buyers managed to stop further deterioration and hold the November low. Taking this fact into account, oil investors are probably asking the same question once again: Is the final bottom of the recent corrective move already in or not?
In our previous Oil Investment Update, we focused on major factors which had an impact on the price of crude. As a reminder, the first of them was an increase in U.S. crude oil inventories and the second one was the Fed and its stimulus program.
A week ago we wrote that investors should not push the sell button in a hurry after a message that the inventories had risen, but rather focus on whether the data were better or weaker than expected. What did happen in the previous week? On Wednesday, crude oil increased after the U.S. Energy Information Administration (EIA) data showed that crude supplies rose less than analysts had expected. The EIA said in its weekly report that crude stockpiles climbed by 375,000 barrels, meanwhile, analysts expected a rise of 700,000. These circumstances confirm our assumption and provide a valuable clue for this week.
This much lower-than-expected rise in U.S. crude inventories had a positive impact on light crude and pushed the price above $94 per barrel. However, crude oil reversed course after Federal Reserve officials said they expect to begin scaling back the central bank's economic stimulus program "in coming months." Nevertheless, the Fed said it would keep short-term interest rates near zero at least until the jobless rate falls to 6.5%, as long as inflation doesn't rise above 2.5%.
At this point, it’s worth mentioning that earlier this month positive data added to ongoing speculation that the Fed may start tapering its stimulus program. Meanwhile, on Thursday crude oil posted its biggest one-day gain since Oct. 2 after stronger-than-expected U.S. economic data. As a reminder, the Department of Labor reported that the number of individuals filing for initial jobless benefits in the U.S. last week fell by 21,000 to a seasonally adjusted 323,000, beating expectations for a decline of 9,000. On top of that, crude oil prices climbed to their highest levels of the session after preliminary data showed that U.S. manufacturing activity improved to an eight-month high of 54.3 in November from a reading of 51.8 in October. These stronger than expected figures suggested economic improvement, raised the prospect for stronger oil demand in the world's biggest energy consumer, and put the groundwork for higher prices.
This week, investors will be closely watching a flurry of U.S. data to further gauge the strength of the economy and the need for stimulus from the Federal Reserve. Please note that the U.S. is to release a series of reports on the housing sector, as well as data on consumer confidence and durable goods orders. Additionally, investors will get the number of individuals filing for initial jobless benefits.
Crude Oil
Having discussed the above, let’s now move on to the technical part of this week‘s Oil Investment Update and focus on the technical changes in the crude oil market. Just like a week ago, we take a look at charts in different time horizons to have a more complete picture of the current situation in the market.
Let’s start with a look at the monthly chart of light crude (charts courtesy by http://stockcharts.com).
The situation in the long-term chart hasn’t changed much recently, and what we wrote in our last Oil Investment Update is still up-to-date today.
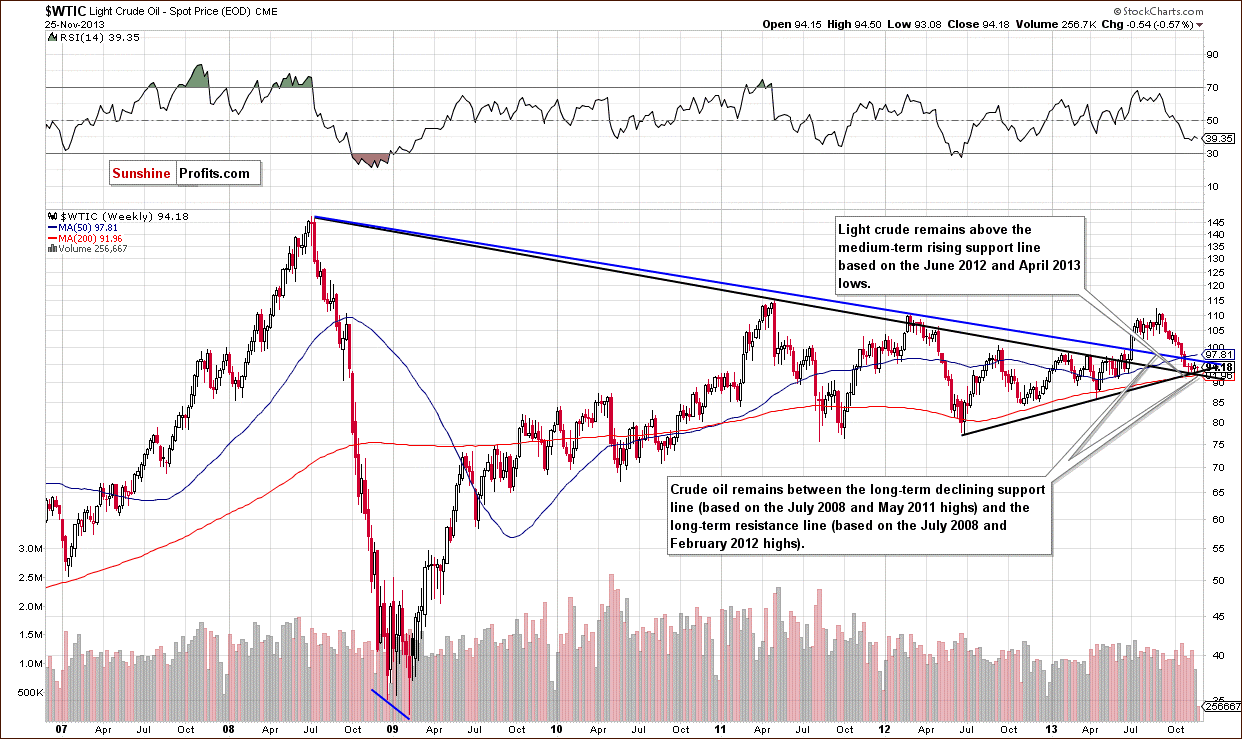
(…) crude oil still remains between two long-term declining support/resistance lines. When we take the blue one (based on the July 2008 and February 2012 highs) into account, we see that the breakdown below this line is confirmed, which is a strong bearish signal.
On the other hand, if we take into account the black long-term support line (based on the July 2008 and May 2011 highs), we see that light crude still remains above it and the situation is not as bearish as it might seem at first glance.
From this perspective, the picture remains unclear.
Now, let’s zoom in on our picture of the oil market and see the weekly chart.
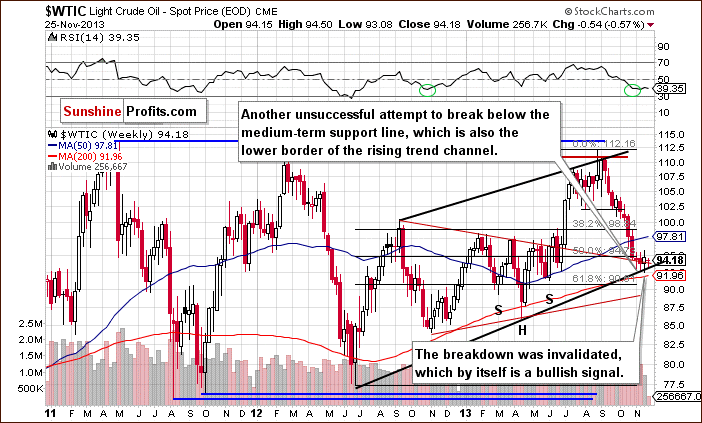
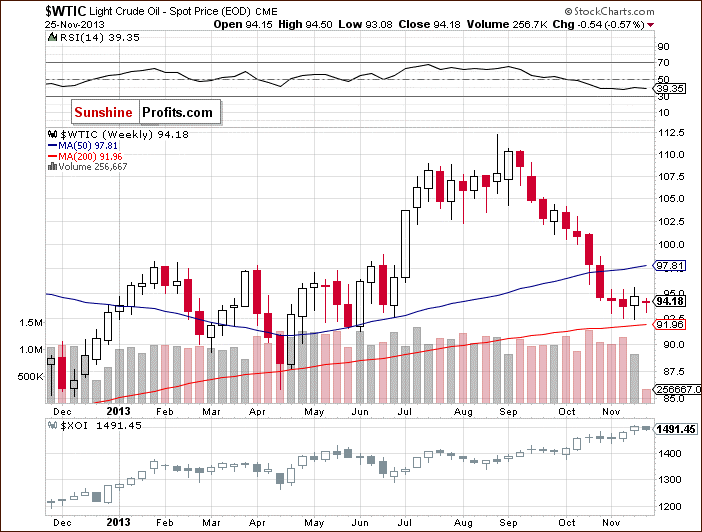
Looking at the above chart, we see that there was another attempt to break below the medium-term support line (marked with the black bold line) in the previous week. However, similarly to what we had seen in previous cases, oil bears failed and the price of light crude bounced off this strong support, which clearly shows the importance of this level for oil bulls.
Yesterday, light crude re-tested the strength of this support once again, but as you can see on the above chart, the buyers didn’t give up and pushed the price higher. Taking this fact into account, we can conclude that as long as crude oil remains above this medium-term support line, which is also the lower border of the rising trend channel, space for further declines seems limited.
Please note that if this strong support is broken, the first price target for the sellers will be the 200-week moving average, and the next one - the 61.8% Fibonacci retracement level based on the entire 2012-2013 rally (slightly above $90).
The RSI remains at levels that we saw in October 2012. Back then, such a low reading on the RSI preceded a move up in crude oil. If history repeats itself once again, we may see further increases to at least the 50-week moving average (currently at $97.81).
Now, let’s check the short-term outlook.
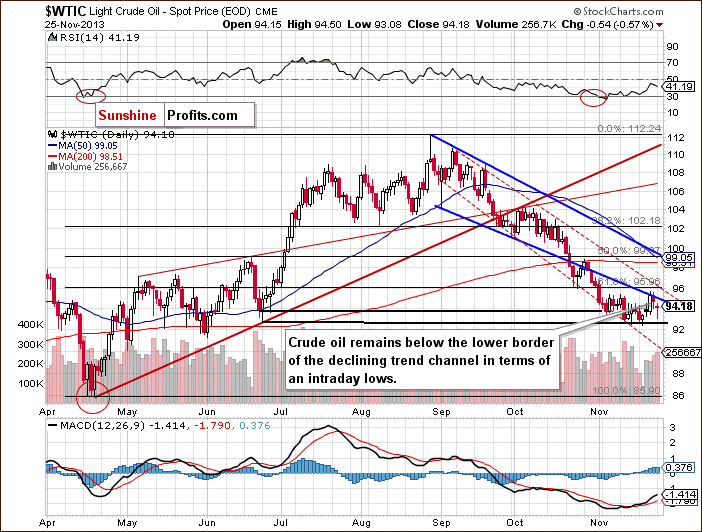
As you can see on the above chart, at the beginning of the previous week light crude hit a fresh monthly low of $92.43. Although crude oil rebounded in the following days, the lower border of the declining trend channel in terms of intraday lows stopped further growth at the end of the week.
As we wrote in our Monday’s Oil Trading Alert:
On Friday, after the market open buyers tried to push the price of light crude higher, but their attempts failed and crude oil didn’t even reach Thursday’s top. This show of weakness encouraged oil bears to trigger a downswing, which took light crude to its daily low of $94.05. As you can see on the above chart, this downward move resulted in a drop below the lower border of the declining trend channel (in terms of intraday lows) and the breakout above this line was invalidated. This is not a positive sign for oil bulls – especially when we take into account the fact that Friday’s downswing materialized on relative high volume. Therefore, further deterioration should not surprise us.
Looking at the above chart, we see that yesterday crude oil declined and dropped to its daily low of $93.08, which is slightly above the November low. However, this deterioration was temporary. Crude oil rebounded quickly and closed the day above $94. Despite this upswing, light crude still remains below the lower border of the declining trend channel in terms of intraday lows, which serves as major short-term resistance. Nevertheless, if oil bulls do not give up and the price comes back in the range of the declining trend channel (in terms of intraday lows), light crude will likely re-test the strength of the resistance level created by the Nov. 21 high. If it is broken, the first target for the buyers will be the upper border of the declining trend channel in terms of daily closing prices (currently around $96).
Summing up, looking at the above charts, we clearly see that there are positive factors which still support the bullish case. In spite of a drop to a fresh monthly low, crude oil still remains above the long- and medium-term support lines. Additionally, all attempts to move below the lower border of the rising trend channel (on the weekly chart) failed and last week’s breakdown was invalidated, which by itself is a bullish sign. On top of that, if we see an upward move above the Nov. 21 high, we may consider a double bottom pattern. All the above provide us with bullish implications and, from this point of view, a bigger rally or a correction to the upside is still likely to be seen.
Having discussed the current outlook for crude oil, let’s examine the NYSE Arca Oil Index (XOI) to find out what the current outlook for oil stocks is.
Oil Stocks
Just like a week ago, we begin with the long-term chart.
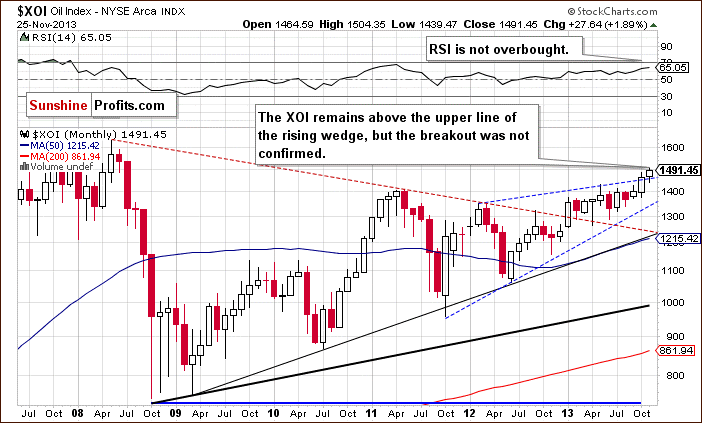
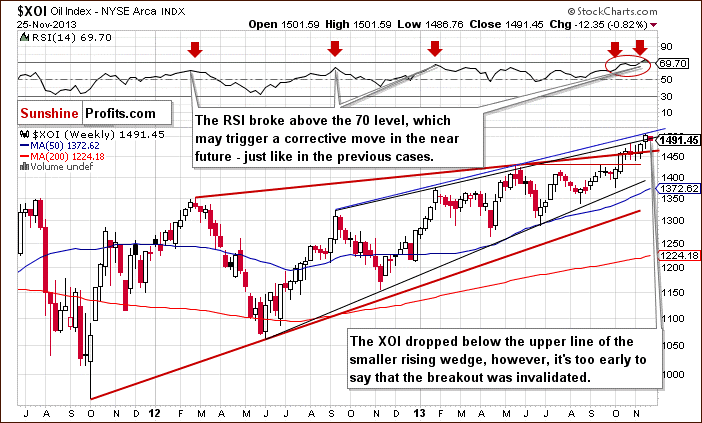
On the above chart, we see that the situation has improved recently. The XOI remains above the upper line of the rising wedge, however, the breakout is not yet confirmed.
The RSI is not overbought at the moment and, from this point of view, the situation is very bullish.
To see the current situation more clearly, let’s zoom in on our picture and move on to the weekly chart.
Quoting our Monday’s Oil Trading Alert:
Looking at the weekly chart we see that the oil stock index reached another medium-term resistance line created by the September 2012 and May 2013 highs (marked with the blue line). Additionally, the RSI reached its highest level since the beginning of the year and is overbought. Please note that earlier this year, lower readings on the RSI triggered downswings in the XOI. Therefore, from this perspective, another corrective move might be just around the corner.
As you can see on the weekly chart, the blue medium-term resistance line encouraged sellers to act and triggered a corrective move which pushed the XOI below the upper line of the smaller rising wedge (marked with the black line). Nevertheless, it’s too early to say that last week’s breakout above this line was invalidated. However, if we see a weekly close below this resistance (currently around 1,495) the breakout will be invalidated and the implications will be bearish.
From the technical point of view, the medium-term uptrend is not threatened at the moment, and the situation remains bullish.
Now, let’s turn to the daily chart.
Looking at the above chart, we see that at the beginning of the previous week, the XOI hit a new annual high at 1,489. Although we saw a correction which took the oil stock index to its weekly low at 1,470, the buyers didn’t give up and pushed the XOI higher in the following days. This upward move resulted in a fresh annual high at 1,504 on Friday.
As we wrote in our yesterday’s Oil Trading Alert:
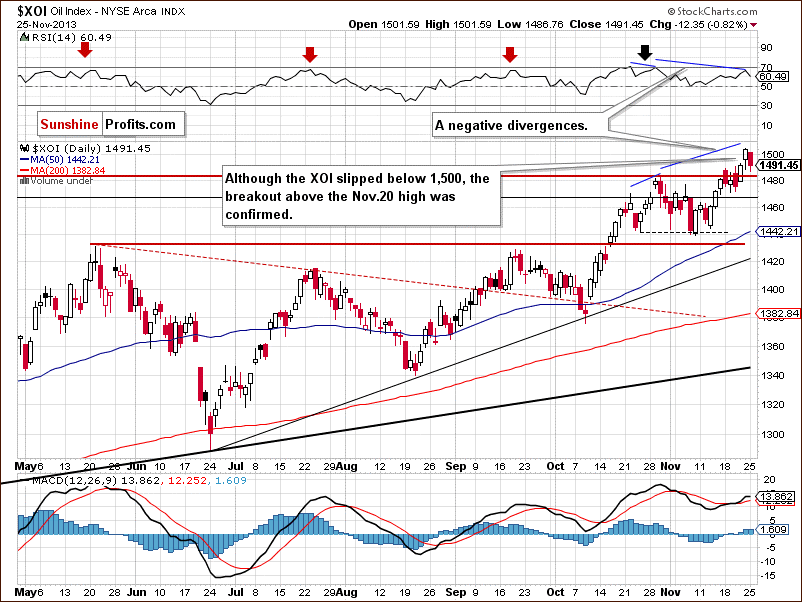
(…) In this way, the oil stock index broke above the major medium-term resistance level (the upper line of the smaller rising wedge – marked with the black line). On top of that, the XOI moved above the psychological barrier at 1,500, which is a strong bullish sign. However, both breakouts are not confirmed at the moment. From this point of view the short-term picture is very bullish.
Nevertheless, as mentioned earlier in this section, the medium-term resistance line created by the September 2012 and May 2013 highs encouraged sellers to act and triggered a corrective move which took the XOI below 1,500. In this way, the breakout above the psychological barrier was invalidated, which is a bearish sign. In spite of this drop, yesterday’s correction is still shallow and another move to the upside is still likely to be seen.
Please note that as long as the oil stock index remains above the October high, space for further declines seems limited.
Summing up, from the long-, medium- and short-term perspectives, the outlook for oil stocks remains bullish and the uptrend is not threatened at the moment. However, taking into account the combination of strong medium-term resistance levels and the position of the weekly RSI, we should keep an eye on the oil stock index because the sellers may lock profits and trigger another correction in the coming days.
Crude Oil - Oil Stocks Link
Having discussed the current situation in crude oil and the oil stock index, let’s comment on the relationship between them.
When we take a look at the above chart and compare the price action in both cases, we clearly see that oil stocks and crude oil moved higher together in the previous week. Despite this similar price action, oil stocks remain strong compared with light crude. They continued their rally and hit a fresh 2013 high on Friday. What happened with the price of crude oil at the same time? At the beginning of the previous week, light crude declined once again and reached a new monthly low of $92.43. Although crude oil rebounded in the following days, yesterday’s downswing erased most of last week’s gains and light crude remains near the November low. Meanwhile, in spite of yesterday’s drop, oil stocks remain near the 2013 high, which clearly shows their strength in comparison with crude oil.
Ratio Analysis
Once we know the current relationship between crude oil and oil stocks, let’s take a closer look at the oil-stocks-to-oil ratio. Taking into account the fact that the long- and medium-term picture hasn’t changed recently, today we’ll focus only on the short-term chart.
Quoting our previous Oil Investment Update:
(…) In the recent days, the ratio has moved higher once again and hit a new 2013 high. Despite this increase, we haven’t noticed a new high in case of the RSI. When we take a closer look at the above chart, we clearly see a negative divergence between the ratio and the position of the indicator. At this point, it’s worth mentioning that there were similar situations in the past – for example in June and October 2012. Back then, such divergences preceded declines in the ratio and had a positive impact on crude oil.
As you can see on the above chart, in the previous week the ratio moved lower, which was in perfect tune with an upswing in crude oil. Although we've seen a pullback in the recent days (which corresponds to the decline in light crude) the ratio hasn’t reached the previous high. Therefore, if we do not see another upswing, we may consider a double top formation. This bearish pattern will be confirmed if we see a drop below 15.53. In this case, we will likely see further deterioration in the ratio, which will likely trigger an upswing in light crude.
Please note that the RSI dropped below the 70 level. However, earlier this year, lower readings on the indicator triggered downswings in the ratio and indicated the bottoms of correction moves.
In our two previous Oil Investment Updates, we focused on the relationship between oil stocks and the general stock market. Back then, we wrote that a strong positive correlation remained in place not only on a short-term basis, but also in the medium and long term. Taking this fact into account we've decided to examine the relationship between the general stock market and crude oil to check if it confirms or invalidates the conclusions of the above analysis of the oil-stocks-to-oil ratio.
Let’s start with the monthly chart.
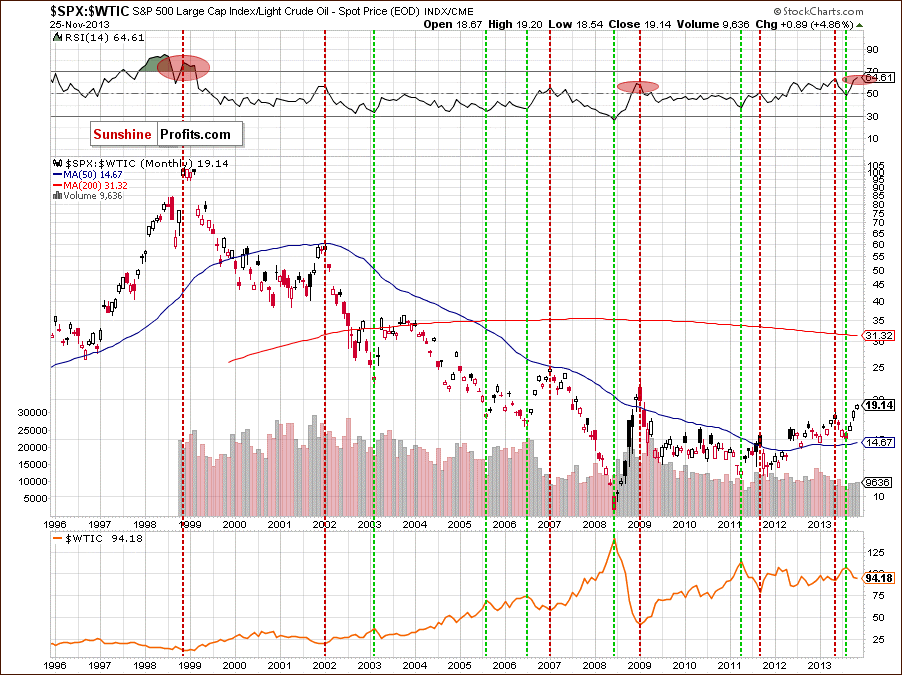
Similarly to what we saw in the case of the oil-stocks-to-oil ratio, the first thing that catches the eye on the above chart is a strong negative correlation between the ratio and the price of light crude. When we go back to 1999, we clearly see that the annual low in crude oil was preceded by the ratio’s 1999 high. We could see this strong relationship also in 2009, when the annual low in crude oil corresponded to the ratio’s 2009 high (marked with a red ellipse). In the following months, the ratio declined heavily, which led to higher oil prices.
Just like in the oil-stocks-to-oil ratio, the stocks-to-oil ratio’s 2011 high was in tune with the bottom of the corrective move that we saw in crude oil. We noticed similar price action also in May 2013. In both cases, declines in the ratio triggered increases in light crude. What’s interesting, the ratio’s lows corresponded to crude oil highs (marked with the green lines). We saw such situations in 2003, 2005, 2008, 2011 and also in 2013.
Looking at the above chart, we see that the RSI has reached its highest level since 1999. Although it is not overbought, we can notice that lower readings on the indicator triggered downswings in the ratio, which resulted in higher prices of light crude.
Taking the above into account, if history repeats itself once again and the ratio declines, we will likely see improvement in crude oil.
Now, let’s zoom in our picture and examine the weekly chart.
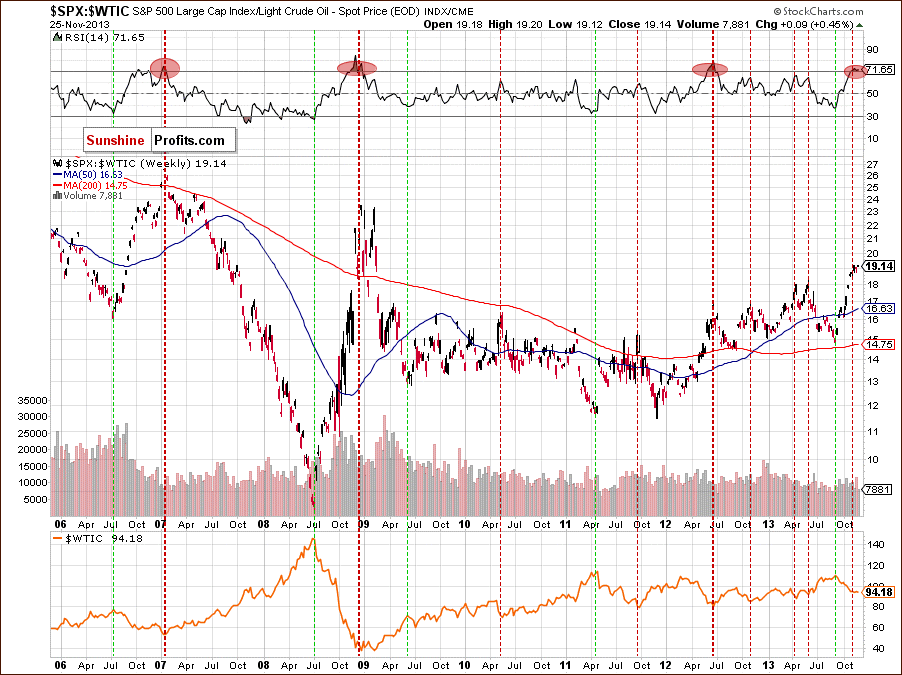
Looking at the above chart, we see the same price action - most of the ratio’s tops have corresponded to the crude oil’s lows. In this case, the ratio’s lows didn’t indicate crude oil’s lows precisely. However, major lows in 2008, 2009, 2011 and 2013 were in tune with major light crude’s tops.
When we take a closer look at the position of the RSI, we clearly see that the indicator has moved above the 70 level. We saw such situations in 2007, 2008 and again in 2012. Back then, such high readings on the RSI preceded moves down in the ratio and up in crude oil. If history repeats itself once again, we may see a move higher in crude oil in the near future.
Now, let’s check the short-term outlook.
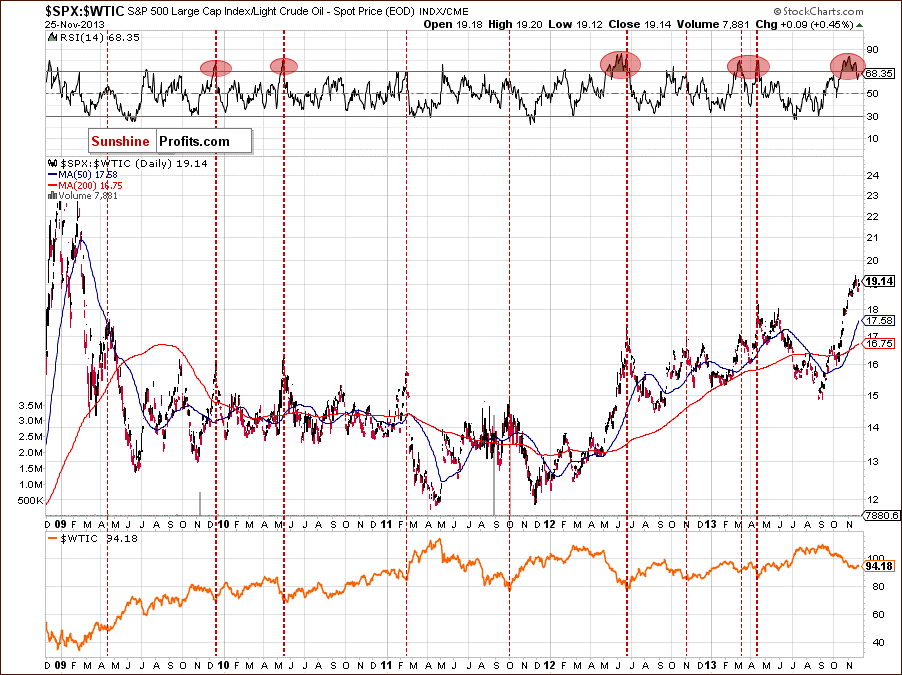
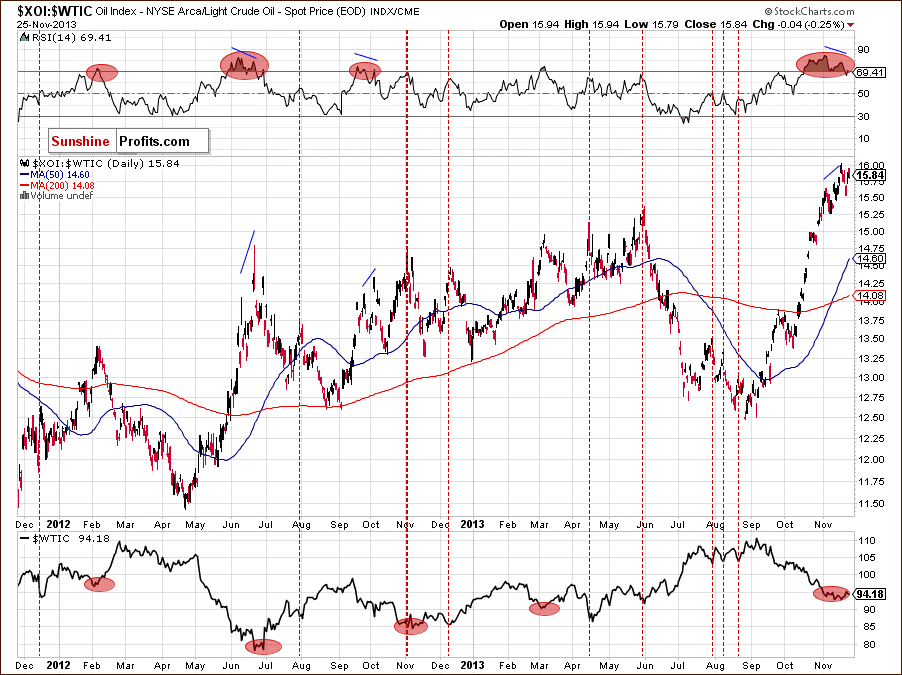
On the above chart, we see that the ratio has rallied since September, which is in perfect tune with declines in crude oil. At the beginning of the previous week, the ratio moved higher once again and hit a new 2013 high. Despite this increase, we didn’t notice a new high in case of the RSI. When we take a closer look at the above chart, we clearly see a negative divergence between the ratio and the position of the indicator.
At this point, it’s worth mentioning that there were similar situations in the past – for example in June 2012 and March 2013. Back then, such divergences preceded declines in the ratio and had a positive impact on crude oil.
Please note that lower readings on the RSI in May and August triggered downswings in the ratio and pushed the price of light crude higher. Taking the above facts into account, we can assume that a bigger pullback in crude oil is just around the corner.
Summary
From today’s point of view, we see that the situation in crude oil hasn’t changed much since our last Oil Investment Update was published. Although light crude hit a new monthly low in the previous week, it still remains above very important support levels created by the long-, medium, and short-term support lines. Additionally, yesterday oil bulls managed to stop further deterioration (slightly above the November low) and pushed the price higher.
The stocks-to-oil ratio is oversold (not only on a short-term basis, but also from the medium-term perspective) as indicated by the RSI, which may trigger a correction in the ratio and an upward move in crude oil in the near future.
All the above provides us with bullish implications and, from this point of view, a move to the upside is still likely to be seen. Considering yesterday’s drop, we see that the major medium-term support encouraged the buyers to act and the November low is still in play and serves as support level. If oil bulls do not give up and the price comes back in the range of the declining trend channel (in terms of intraday lows), we will likely see a bigger pullback in the coming days.
Just like a week ago, the biggest event of the recent days, in case of oil stocks, has been the sharp pullback which pushed the oil stock index to a new 2013 high at 1,504. At this point, it’s worth noting that although we’ve seen a rally in the recent days, the oil stock index hasn’t managed to break above the blue resistance line (slightly above the upper line of the smaller rising wedge). So far, this line has stopped growths and triggered a shallow correction. Therefore, it seems that as long as the oil stock index remains below this level, further increases may be limited – especially when we factor in the position of the weekly RSI.
Very short-term outlook: mixed
Short-term outlook: bearish
MT outlook: bearish
LT outlook: unclear
Trading position (short-term): If we see a confirmed breakout in crude oil above the lower border of the declining trend channel in terms of intraday lows (marked with the blue bold line), we will consider opening long positions. Taking into account the long-, medium- and short-term support lines, we do not suggest opening short positions at the moment. We will keep you informed should anything change, or should we see a confirmation/invalidation of the above.
This completes this week’s Oil Investment Update. Our next Oil Investment Update is scheduled for Tuesday, Dec. 3, 2013. Oil Trading Alerts subscribers will additionally receive similar but shorter alerts on a daily basis (or more than once a day when the situation requires it).
Thank you.
Nadia Simmons
Sunshine Profits' Crude Oil Expert
Oil Investment Updates
Oil Trading Alerts

