
Crude Oil
The most important event of the previous months is behind us. After weeks of uncertainty around the U.S. central bank's bond-buying program we finally know the Federal Reserve’s decision. Most economists expected that the U.S. central bank will announce a $10 billion or even $20 billion reduction. Meanwhile, investors heard two words: no taper. The central bank assured that there would be no changes to its monetary stimulus program. This unexpected statement triggered an enthusiasm among investors and resulted in a rally in the commodities. After Ben Bernanke’s words, the price of light crude increased sharply to over $108 per barrel and gained over 2%. However, during this euphoric rally, investors overlooked that it was fueled by a weaker economic outlook from the Fed.
On Wednesday, the Fed cut its economic forecast for the third time this year, which triggered concerns about future energy demand in the following days. Investors realized that the world’s largest economy isn’t yet strong enough to withstand the withdrawal of monetary stimulus.
These circumstances in conjunction with the information that Libyan oil production increased resulted in a quick profit-taking during the last two sessions of the week. In this way, light crude has declined sharply and erased all September’s gains.
At this point we should throw in a few sentences about Libya. As we wrote in our first Oil Update for September, Libya’s output had collapsed to below 200,000 bpd as a result of oil worker strikes and civil unrest. Earlier this month, this supply cut was one of the factors, which fueled the price of light crude. Therefore, last week’s news about a recovery in Libyan oil production had a negative impact on the price of light crude.
Please note that Libya's crude oil production has recovered to 620,000 barrels per day, compared with its pre-war capacity of 1.6 million bpd, as major western fields ramped up output after protesters agreed to reopen them.
Another factor, which also influenced the price of light crude, was a positive tone in U.S.-Iranian relations.
Last week, Iranian President Hassan Rouhani said his country was not seeking war and would never seek to develop a nuclear weapon. According to Reuters, he is expected to meet in New York this week aimed at setting the right tone for further nuclear talks with world powers which he hopes will bring relief from sanctions. At this point, it’s worth noting that western sanctions on Iran's nuclear program have sharply reduced Tehran's oil revenues. Please note that exports from Iran, one of the largest crude producers, dropped to around 1 million barrels per day in 2012 due to tightening sanctions.
These circumstances also have been creating concerns that supplies from other producers nearby could be impacted.
Keeping in mind these factors and their impact on the price of light crude, let’s now move on to the technical part of our Oil Update. Just like a week ago, we take a look at the charts from different time perspectives to have a more complete picture of the current situation in the oil market.
Let’s start with a look at the monthly chart of light crude (charts courtesy by http://stockcharts.com).
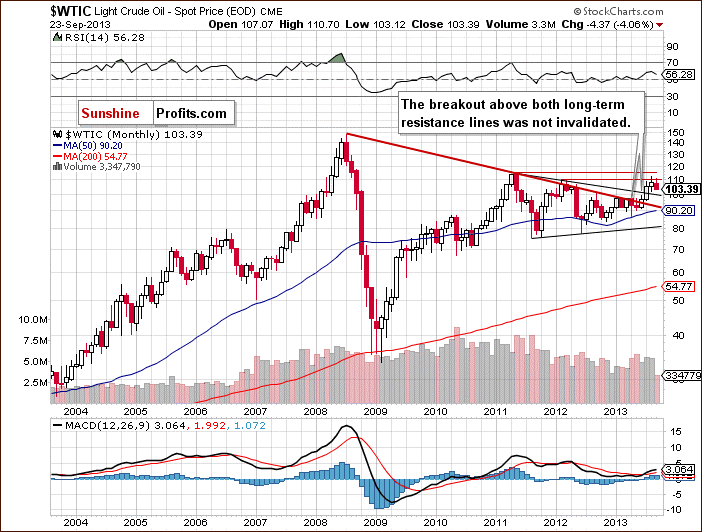
The situation in the long-term chart hasn’t changed much recently.
As we wrote in our last Oil Update:
(…) light crude still remains above the two long-term declining resistance lines: one of them (bold red line) is based on the July 2008 and the May 2011 highs, and the second one is based on the September 2012 and March 2013 highs (the upper black line).
From this perspective the picture is bullish and the breakout above these two long-term declining resistance lines hasn’t been invalidated.
Now, let’s zoom in on our picture of the oil market and see the weekly chart.
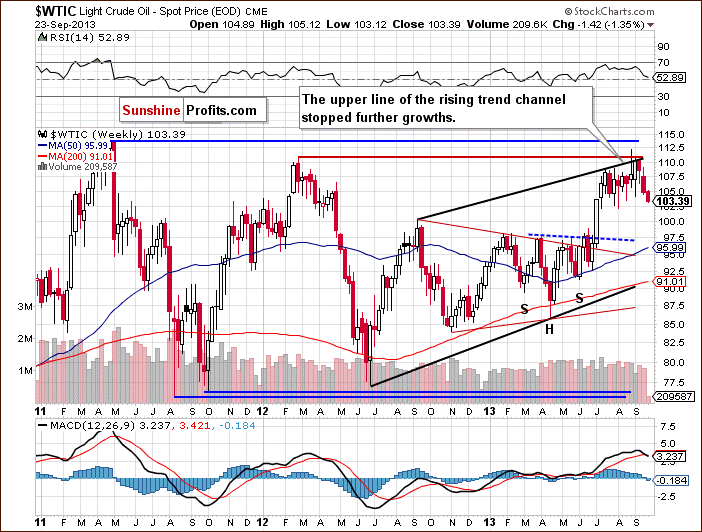
On the above weekly chart, we see that after three unsuccessful attempts to break above the strong resistance zone based on the March 2012 top and the upper border of the rising trend channel, oil bulls lost their power.
Just like in the previous week, oil bears noticed the opportunity to go short and triggered another corrective move, which pushed the price of crude oil slightly above the September low. On Monday, we saw further deterioration and light crude dropped to its lowest level since August 5.
From this point of view, the situation is somewhat mixed. On the one hand, crude oil still remains in the upper part of the rising trend channel, which is a bullish factor. On the other hand, three unsuccessful attempts to break above this level resulted in a decline to a new September‘s low, which doesn’t look so bullish.
Now, let’s check the short-term outlook.
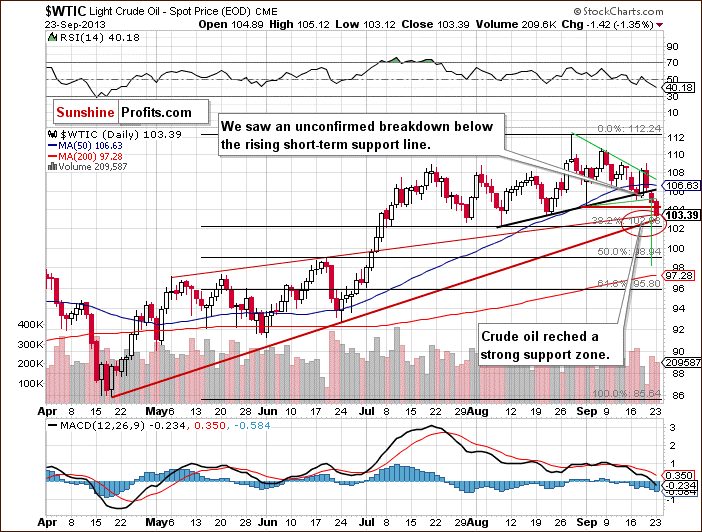
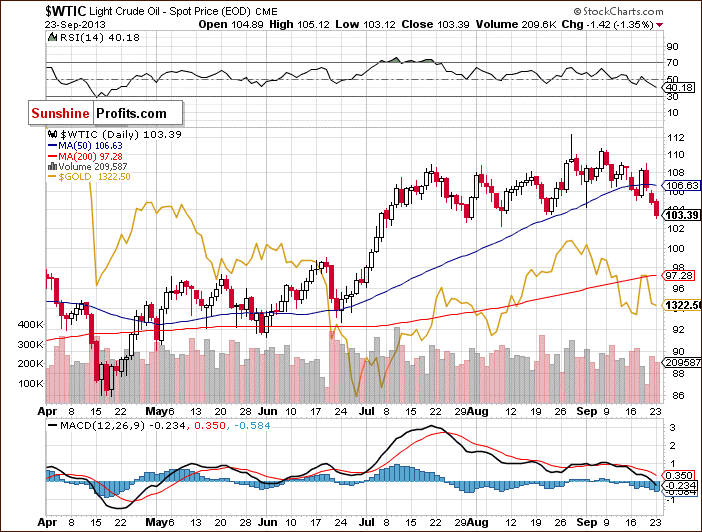
On the above chart we see that the situation has deteriorated since our last Oil Update was published. Since the beginning of the previous week the price of light crude has dropped and reached below the 50-day moving average. Last Tuesday, we saw also a breakdown on an intraday basis below the short-term rising support line based on the August lows.
In spite of this downward move, oil bears failed and crude oil rebounded sharply on Wednesday to almost $109. However, this improvement was only temporary and light crude gave up earlier gains in the following days. Additionally, the price of crude oil declined below the 50-day moving average and the previously mentioned rising support line once again, which is not a good sign for oil bulls. Nevertheless, the breakdown is not confirmed so far.
At this point, it’s worth mentioning that when we take a closer look at the daily chart we see a triangle (marked with green). As you see, there was a breakdown below the lower border of this pattern on Friday, which is a bearish signal. However, we would prefer to see an additional confirmation in the form of 2 more closing prices below the lower border of the triangle pattern before writing that lower oil values are very likely. If the nearest support levels do not encourage oil bulls to push the price higher, we will likely see further declines. In this case, according to theory, the price target for the pattern will be slightly below $100 per barrel.
The nearest support is the zone (between $102.22 and $103.50) based on the bottom of the previous corrective move (the August 21 low) and the August low. Please keep in mind that this area is reinforced by the upper and the lower line of the rising wedge and also by the 38.2% Fibonacci retracement level, which together form a strong support zone.
Summing up, although there was a downward move in the recent days, which took the price of light crude to a new September low, technically, the situation hasn’t changed much. As long as crude oil remains above the previously mentioned strong support zone the uptrend is not threatened.
Once we know the current outlook for crude oil, let’s examine the NYSE Arca Oil Index (XOI) to find out what the current outlook for the oil stocks is and to check if they confirm or invalidate the above analysis of the crude oil market.
Oil Stocks
Let’s start with the long-term chart.
Quoting our previous Oil Update:
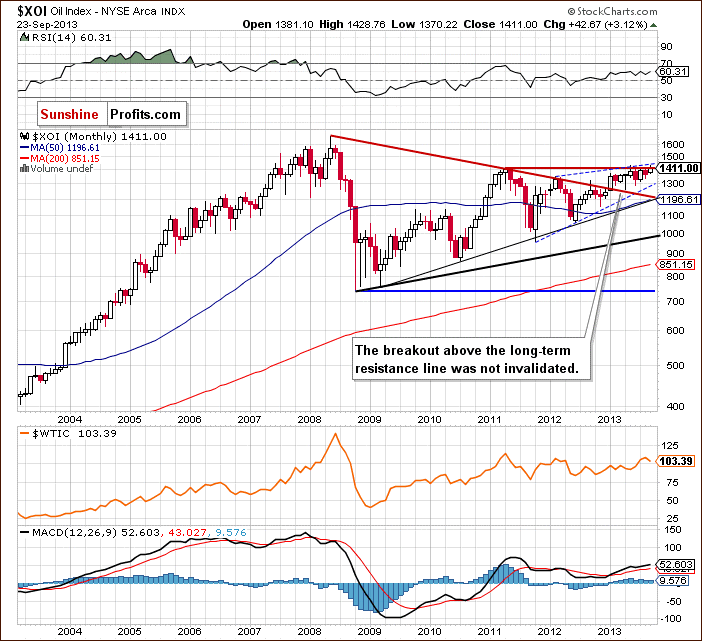
The XOI remains quite close to the May 2011 top and it’s still above the previously-broken long-term declining resistance line based on the 2008 and the 2011 highs and the breakout hasn’t been invalidated. The oil index also remains in the range of the rising trend channel.
Taking the abovementioned observations into account, the situation is still bullish.
(..) we’ve been seeing a consolidation in the recent months and the NYSE Arca Oil Index is trading between the July top and the July low.
When we take a closer look at the above chart, we see that the situation has slightly improved. There was a small unconfirmed breakout above the July top; however, from this perspective it’s barely visible.
To see the above more clearly, let’s zoom in on our picture and move on to the weekly chart.
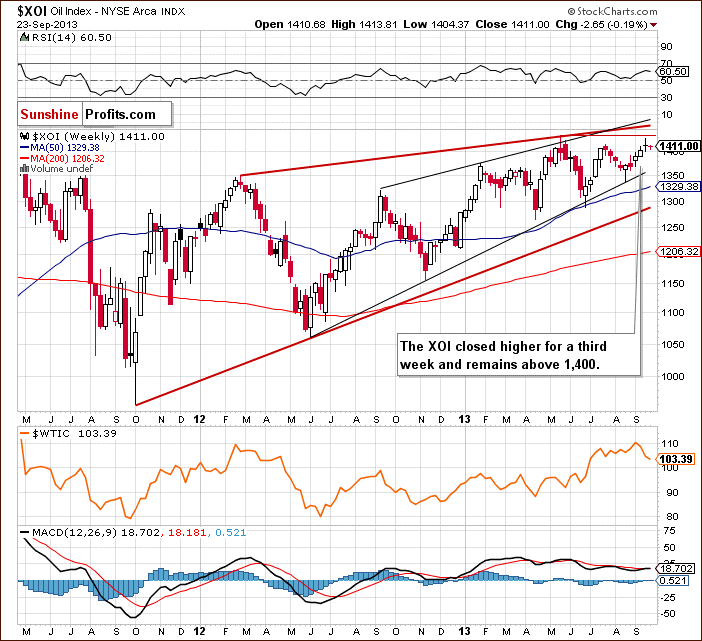
Looking at the above chart, we see that the oil stock index continued its upward move in the previous week and climbed above the July peak, but the breakout is unconfirmed at the moment. In this way the XOI closed higher for a third week and almost reached the May top.
Taking the above into account, we should carefully keep an eye on the oil index. The proximity of the above resistance level may encourage oil bears to go short and trigger a correction. In this case, the first support will be around 1,400.
Please note that even if the buyers do not give up and manage to push the XOI higher, further increases may be retained by the upper line of the rising wedge (currently close to 1,450).
The medium-term uptrend is not currently threatened, and the situation remains bullish.
At this point it’s worth mentioning the relationship between light crude and the oil stocks.
When we take a look at the above chart and compare price action in both cases, we clearly see that oil stocks were stronger in the previous week once again. They closed higher for a third week, broke above the July top and almost reached the May peak. What happened with the price of crude oil at the same time? Light crude declined and closed lower for a second week. Additionally, it dropped to a new September bottom on Monday, which clearly shows its weakness in relation to the oil stocks.
Now, let’s turn to the daily chart.
As you see on the above chart the situation has improved in the previous week.
Quoting our last Oil Update:
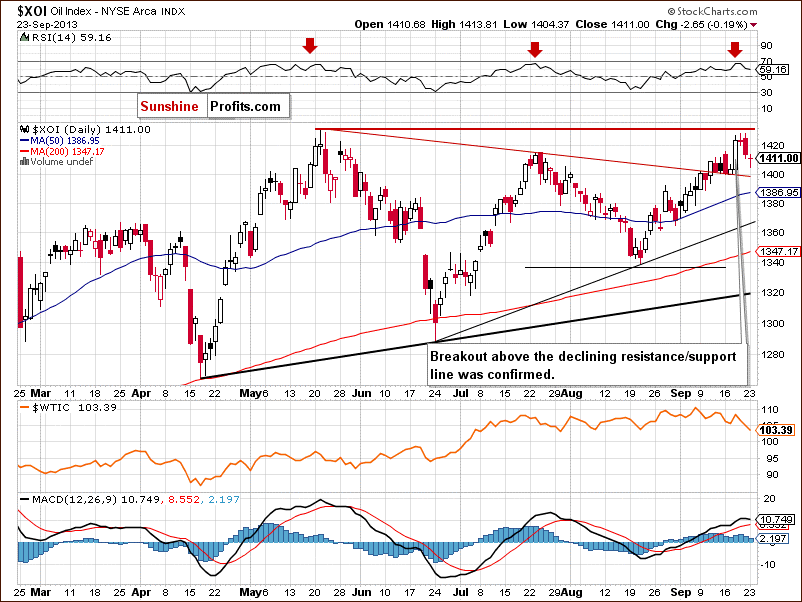
(…) oil bulls managed to push the oil index above the (…) declining line based on the May and July highs. In this way the last resistance level below the July top was broken. In this case, the next target for buyers is the July peak, and then the May top.
The above-mentioned declining resistance/support line stopped oil bears at the beginning of the previous week, which resulted in a rally above the July peak. The breakout is confirmed at the moment, which is a bullish sign. However, the May top still serves as strong resistance and may encourage sellers to go short. If it happens, we could see a double top pattern, which may lead to a corrective move in coming days.
Please note that another bearish factor, which prescribes caution, is the RSI indicator. In the previous week it approached the 70 level and then declined. We saw similar situation in May and again in July. Back then, in both cases, it resulted in a correction, which pushed the XOI lower. If history repeats itself, we will likely see a decline to at least the previously-broken declining resistance/support line, which is the nearest support level.
The second one is the 50-day moving average (currently at 1,386.38). The next support zone is based on the August 27 and August 30 lows (1,361-1,364), and a further one is based on the August 21 bottom and the 61.8% retracement level (1,338-1,339).
Now, let’s comment on the relationship between the WTI and the XOI in the short term. This time, the price action in both cases looked pretty much the same. After weaker beginning of the week we had the Wednesday’s increase. However, it’s worth noting that Wednesday growth pushed the oil stocks to its new 17-week high and in the case of crude oil we saw only a pullback to the previous local top.
Summing up, from the long- and medium-term perspectives the outlook for oil stocks remains bullish and the uptrend is not threatened at the moment. Taking into account the relationship between light crude and the oil stock index in the previous week, we can conclude that the oil stocks remain stronger in relation to crude oil .
Speaking of relationships, let’s take a closer look at the chart below and check the link between crude oil and gold. Let’s examine the daily chart.
Crude Oil – Gold Link
Will gold lead oil higher?
That’s still not likely. Looking at the above chart we see that connection between light crude and gold has changed in the recent days. Although, we saw a clear negative divergence earlier this month, both commodities moved pretty much the same in the previous week.
In the first half of last week they declined together and then rebounded on Wednesday after the FED statement. This improvement didn’t last long anyway and in both cases we saw a downward move in the following days. At this point it’s worth mentioning that the recent decline took crude oil to a new week low, but we didn’t see such price action in gold, which means that the yellow metal was stronger in relation to light crude.
Taking the above into account, it’s worth taking a closer look at the medium-term outlook for gold. Let’s turn to its weekly chart.
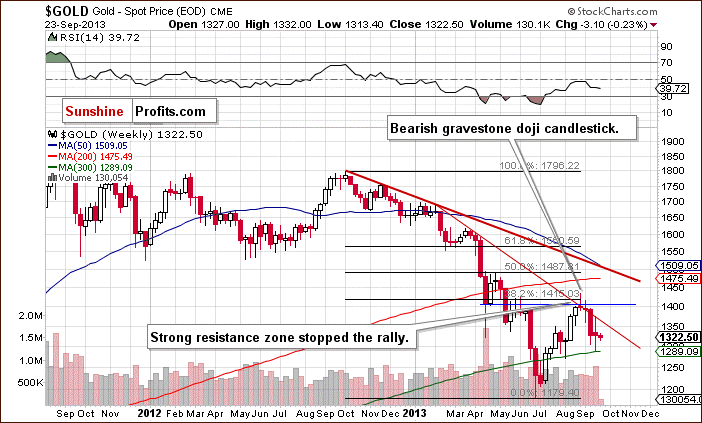
As you see on the above chart, last week, gold reached the 300-week moving average. We saw such a situation at the beginning of August. Back then, it resulted in a rally which pushed the price of gold to its highest level since May. Although we saw similar price action in the previous week, the declining resistance line (based on the October 2012 and February highs) stopped further growths and the yellow metal dropped once again.
Therefore, it doesn’t seem that gold will impact the price of crude oil in a positive way in the coming weeks.
Summary
In the past, we saw negative divergences between WTI and the XOI many times. However, in the previous week, a weakness of oil in relation to oil stocks was even more visible than earlier this month. The oil index closed higher for a third week, broke above the July top and almost reached the May high. Meanwhile, crude oil not only moved away from the August top and dropped for a second week, but it also erased all September’s gains, which confirms the fact that the oil stocks still outperform oil.
Looking at the relationship between crude oil and gold, we noticed that the link between both commodities has changed in the previous week. In spite of the negative divergence that we saw several times in the recent weeks, this time the yellow metal and light crude moved pretty much the same. Additionally, gold was stronger in relation to light crude.
However, we should keep in mind that the recent decline in crude oil is just slightly bigger than the previous ones and the uptrend is not threatened at the moment. At the same time, the downtrend in gold remains in place.
Even though we thought that the situation was bullish in the previous week we didn't think it was certain enough to open long positions - and it was a good choice to stay out, as oil declined by about 1.5% on Friday.
Very short-term outlook: bearish
Short-term outlook: mixed
MT outlook: bullish
LT outlook: bullish
Trading position (short-term): we do not suggest opening short positions at the moment, because although the situation is bearish on a very short-term basis, the trade looks risky based on the strong support zone, which is quite close (thus the decline could be temporary). We will keep you informed should anything change, or should we see a confirmation/invalidation of the above.
This completes this week’s Oil Investment Update. Our next Oil Investment Update is scheduled for Monday, Sep 30, 2013. Oil Trading Alerts subscribers will additionally receive these alerts on a daily basis (or more than once per day – when the situation requires it).
Thank you,
Nadia Simmons

