
In this update I will focus on the gold market and how the situation on other markets might influence it. In the previous update I summarized one of the paragraphs by stating that (...) the signals for the USD market do not automatically translate into signals for gold/silver. Until this situation goes back in the "normal mode", the usefulness of the analysis of the dollar market with PM sector in mind, is very limited. However, there are also other ways to approach the gold market indirectly, besides the popular USD analysis. Charts are courtesy of stockcharts.com
First things first - the Gold Market

Gold has recently reached the support level that I mentioned in the previous Premium Update (thin, solid line), which correspond also to the 200-day moving average. Was that the bottom? Perhaps, but I would like to see a confirmation from other markets that this is indeed it; for instance I would prefer to see gold stocks outperforming the metal itself. This has yet to happen, but I will get back to this in a few moments.
The support level, from which gold has briefly bounced right now, is created i.a. by the descending line drawn from three previous lows. They are rather close to each other, which means that the "strength" of the support level is not very significant. This is partly why I was reluctant to call this level as my prediction in my previous update.
This time, I would like to point your attention to other support levels. Unfortunately we don't have one, single support level that is very likely to stop this decline. Instead we have many smaller signals that point to similar (not precisely, though) price/time points. Since we cannot get from market anything more that it gives us, we must proceed with making the most from what we do get.
Since support and resistance lines are often parallel to each other (thus building a trend channel), we can also draw an additional (dashed) line based on the above resistance line. Another thing is that we have the 50% Fibonacci retracement level just below $850 - as I mentioned previously, prices often correct half of the preceding move before resuming their main direction.
Last, but definitely not the least, support level is the thick trend line which has been verified only very briefly (on an intraday basis) in January. This support level is created by drawing it through 3 important tops, and these tops are at least 2 months away from each other. This is what makes this line a very strong support level and I personally think that it has the highest probability of stopping the decline. Not only would it correspond to a little more than 50% correction (thus making the following rally more sustainable), but it would also verify the breakout above this line.
Even if we do get below the area marked with red ellipse, I currently don't see gold going below $800 and staying there for more than a few days.
The situation on the silver market is very similar to the one mentioned above, so I will not cover it deeply here. I plan to take a closer look on silver technical situation next week.
PM Stocks
Commenting on precious metals stocks is usually necessary to gain more insight into the situation on the metals market, as it is this market which often leads the metals.

The precious metals stocks are right in the middle between their recent resistance and support lines. Taking into account the fact that precious metals stocks often correct in the zigzag (abc) fashion, we may infer that we are halfway through with this decline. This would also correspond to the thin support line marked on the chart above. Today it seems that the HUI Index could bottom just below the $275 level - area marked with a red circle.
I believe that some investors might be concerned that we are forming a head-and-shoulders (reversal) pattern in the PM stocks, so I have prepared another chart which indicates that (although possible, naturally) it is not likely.

Before starting to worry about the possibility of a severe plunge, please consider the chart above. Even if prices break down through the support line, this formation will not be confirmed by the volume, and therefore will be particularly vulnerable to a quick reversal. Again - we may get lower, especially if the general stock market plunges, but I am not suggesting shorting the precious metals sector at this point nor in case it breaks below the abovementioned support level.
As mentioned above, please keep in mind that for gold stocks it is also the general stock market that matters, as far as short term (!) price swings are concerned.

The size of the Thursday's rally and corresponding volume are significant, but does that necessarily mean that we are immediately going higher? Under normal conditions it would be a bullish development, but Thursday was not a very "normal" day in the stock market - it was the last day before a market holiday.
Unfortunately I cannot recall the author of this study, but I remember reading a paper on stock market's performance before market holidays and just after them. I don't want to get into details here but - people tend to be rather optimistic and buy stocks just before holidays, and just after holidays, reality strikes back and market declines erasing previous gains. I have prepared the following chart to see if this theory still translates into real world. You may want to click it to zoom in - it will open in a new tab/window.

Most of the time this theory really does work. Should history repeat itself once again, we may see at least a temporary pullback in the general stocks market, which would most likely drag PM stocks with it. Moreover, there are more factors that make Thursday's rally seem doubtful. Remember the leader / laggard situation which I wrote about last week? This phenomenon is also true on a bigger scale.
In the previous Premium Update, I wrote about leaders and laggards among the gold stock sector, and explained that stocks that underperform the market tend to catch up with a vengeance just before a top. The opposite is true for stocks outperforming the market - they often lag just before a top is put in place.
This time I will use this phenomenon on a sector/market level. In other words, if there are sectors that were performing poorly in recent months and are now catching up with a vengeance, it may mean that we are getting close to a local top. The odds increase if at the same time previously strong sectors suddenly start to lag. By the way, the phenomenon of self-similarity of markets (i.a. in this analysis) is one sometimes referred to as the fractal nature of markets.
On the market level, I believe that most of my readers can agree that the sector with the strong fundamental situation is the commodities sector, and the sector with rather poor fundamentals is the financial sector. Even if you don't agree with this statement, please note that market currently perceives them as such - financial were reluctant to bounce, while commodity stocks have bottomed back in 2008. I will therefore analyze both sectors to look for additional clues regarding the general stock market.
The Financial Sector

The XLF ETF serves as a proxy for the whole sector. It moves in tune with the Philadelphia Banking Index and it allows me to analyze the volume. Breakout on a large volume? Yes, but that didn't necessarily mean higher prices on this particular market. It seems that we need to find additional details to estimate whether this breakout was significant of not.
One of the clues comes from another financial index - the Broker/Dealer Index

Before stating that financials have truly broken into new highs, I would need to see a similar action in XBD. For now, it has closed very little above its resistance level and it did not broken out of its short term trend channel - therefore I view this as a non-confirmation.
One of the strongest stocks in the financial sector has been the Goldman Sachs Group, Inc., however it too seems to have reached a local top.

The volume has been declining along with higher prices and GS has reached its first Fibonacci retracement level after an exhausting rally. Moreover, this level corresponds to one of the previous tops. All of these factors signal that a turnaround may be just around the corner. From a short-term perspective, the situation also favors short-term weakness in the shares of Goldman Sachs Group

Higher prices on lower volume and reaching multi-month resistance level while forming two rising wedges is definitely not a bullish combination. The important point here is also that GS did NOT break out of its recent trend line, just as the XLF ETF might suggest. Since that is the case with one of the strongest stocks among financials, it means that it were other (weaker) stocks that drove the banking index higher - i.e. Citigroup jumped more than 12% on Thursday. All of this suggests that we have a similar situation in the financial sector, as we had in the precious metals stocks several days ago, when I sent out Market Alert about closing our positions. We have leaders that are lagging, we have underperformers that have jumped and additionally we have a non-confirmation from another index. All of this makes the "financial rally" doubtful.
Commodity stocks
However, financials are only one side of the coin in this analysis. Like mentioned earlier, the signal for the whole market is much stronger if it is accompanied by poorly performing strong sectors. We don't need to look far, to see such examples.


We will use two diversified, global resource companies: RTP (Rio Tinto) and BHP (BHP Billiton) as the proxy for the sector. After bottoming before the end of 2008 these stocks have roughly doubled their share price, and they have been performing quite well - until recent days. In fact, in the Premium Update posted on April 3rd I wrote:
Especially the latter (for instance: Rio Tinto - RTP and BHP Billiton - BHP) have experienced a very powerful rally and look like a correction is needed.
We didn't need to wait long for this to prove true - they both declined in the following days. They bounced along with the recent small rally in the general stock market, but unlike the latter, they did not reach new highs on Thursday. This is exactly the type of behavior that I would expect to see, while waiting for confirmation that we are going lower in the short term. Additionally, declining volume from March 25th in RTP suggests that the price pattern that it is probably going to form soon is a bearish head-and-shoulders formation.
Summing up...
The precious metals are now in completing their correction. Since these markets have recently moved rather along with the general stock market it is important to establish the direction in which this market will head next. In my view the odds favor lower prices in the short term, which means that what we have just witnessed on the PM market was not the ultimate bottom yet.
On the other hand, it is possible that the short-term correlation between the general stock market and gold / gold stocks will change and invalidate today's analysis. Naturally, should that take place I will let you know, how I plan to deal with it.
Long-term PM investors (gold, silver, PM stocks) should not be troubled by this correction and wait for signals to add to their positions.
Short-term Speculators/Traders might want to wait for additional signals before entering new positions in the precious metals market. As far as other markets are concerned we are opening speculative short positions (we are buying put options) in GS and RTP for the reasons already mentioned in this essay. You may find more details below.
Speculative positions
GS and RTP are stocks from different sectors, however the move that we are betting on here is determined by the same factor - the general stock market + particularly vulnerable position of both stocks, so we don't need to use our second position sizing model.
Since it is difficult to estimate at which price these stocks will open on Monday, I will make calculations using Thursday prices. This will make the final outcome less precise, but still useful. If stocks open lower and put options are more expensive this will mean that the potential profit is lower, but also that the chance of achieving it is higher (lower stock prices on Monday would mean another confirmation of our predictions).
You will find details of the transaction in the tables below:
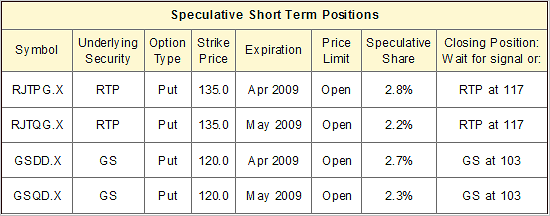

Below you will find our calculations. You may read about the interpretation of the following table here.
Thank you for using the Premium Service! Have a great weekend and a profitable week!
Sincerely,
Przemyslaw Radomski

