
Briefly: In our opinion speculative short positions (full) in gold, silver and mining stocks are justified from the risk/reward perspective. We are lowering the stop-loss levels, which means that we are effectively increasing the part of the gains that is already locked-in and at the same time we’re allowing the profits to increase even more.
The trend was down last week and the surprises had been likely to be seen to the downside – and that was exactly the case. Gold and the rest of the precious metals sector plunged on Friday and ended the week at the level that was only about $2 above the previous lowest weekly close (during the 2011 – today decline so far). What’s next?
We could see some sideways movement in the next few days – a breather – but the size of the decline and the volume that accompanied it strongly suggest that the decline is far from being over.
Let’s take a look at the charts, starting with the long-term gold chart (charts courtesy of http://stockcharts.com).
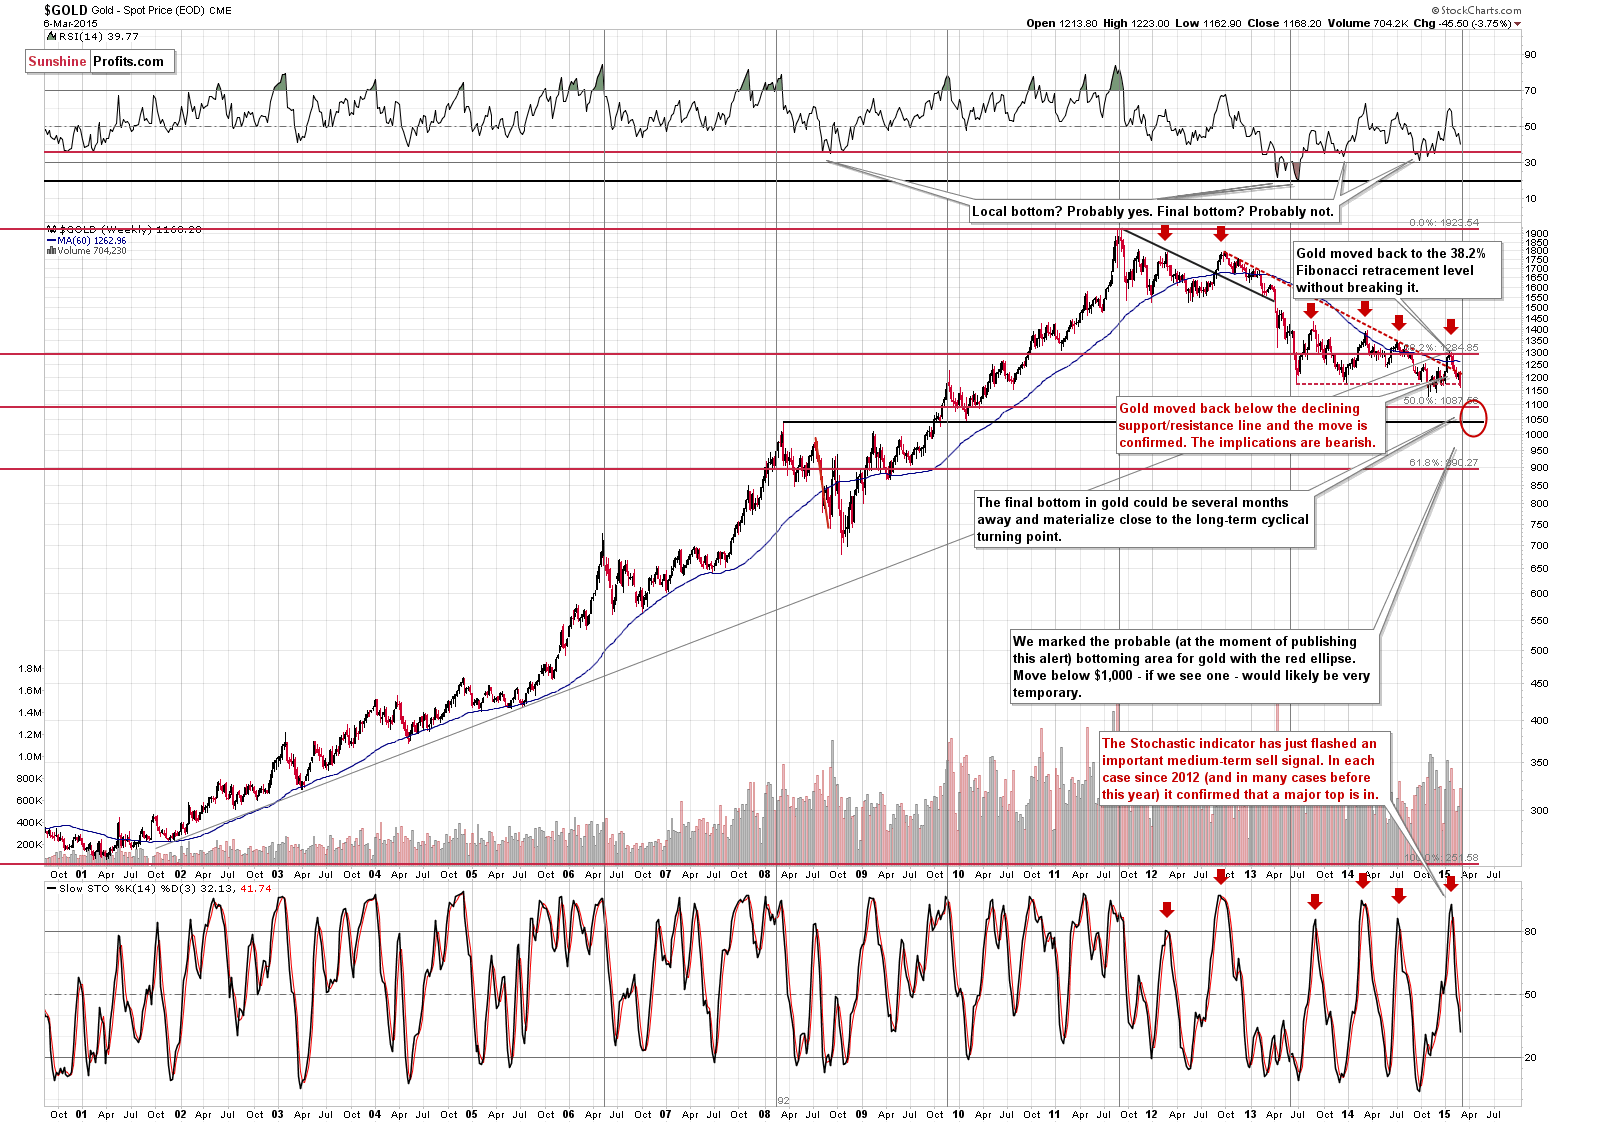
Gold moved decisively lower last week and the final closing price of the week was only $2 higher than the lowest weekly close of the entire 2011-today decline. The previous lowest weekly close formed on Nov. 28 2014 at $1,165.80 and last Friday gold closed at $1,168.20. If gold closes just a little lower this Friday, we’ll have a breakdown in terms of weekly closing prices with very bearish implications for the following weeks.
It could be the case that gold bottoms in the May - June time frame close to the $1,000 level.
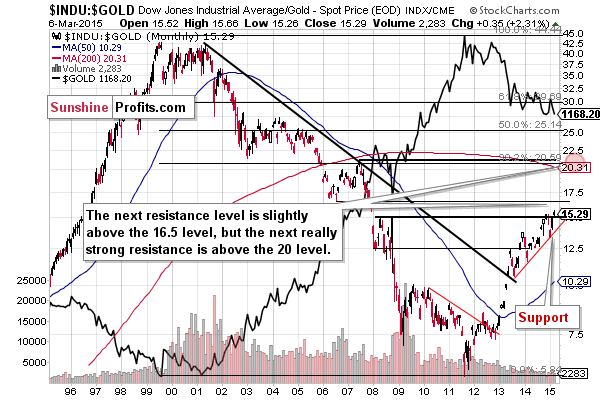
It could be the case – given the previous medium-term trends – that the Down Jones Industrial Average moves higher in the next few months, perhaps even to the 20,000 level. The 2 above-mentioned moves would mean the Dow to gold ratio at the 20 level, which, actually, seems quite likely.
The ratio moved above the 2014 high, which suggests further strength in it and weakness in gold. The next resistance is close to the 16.5 level, but that’s not a very strong resistance. The next significant resistance is at and above the 20 level. That’s where the ratio could move in the coming weeks and months. This target is quite far, but gold could indeed drop quite far as well.
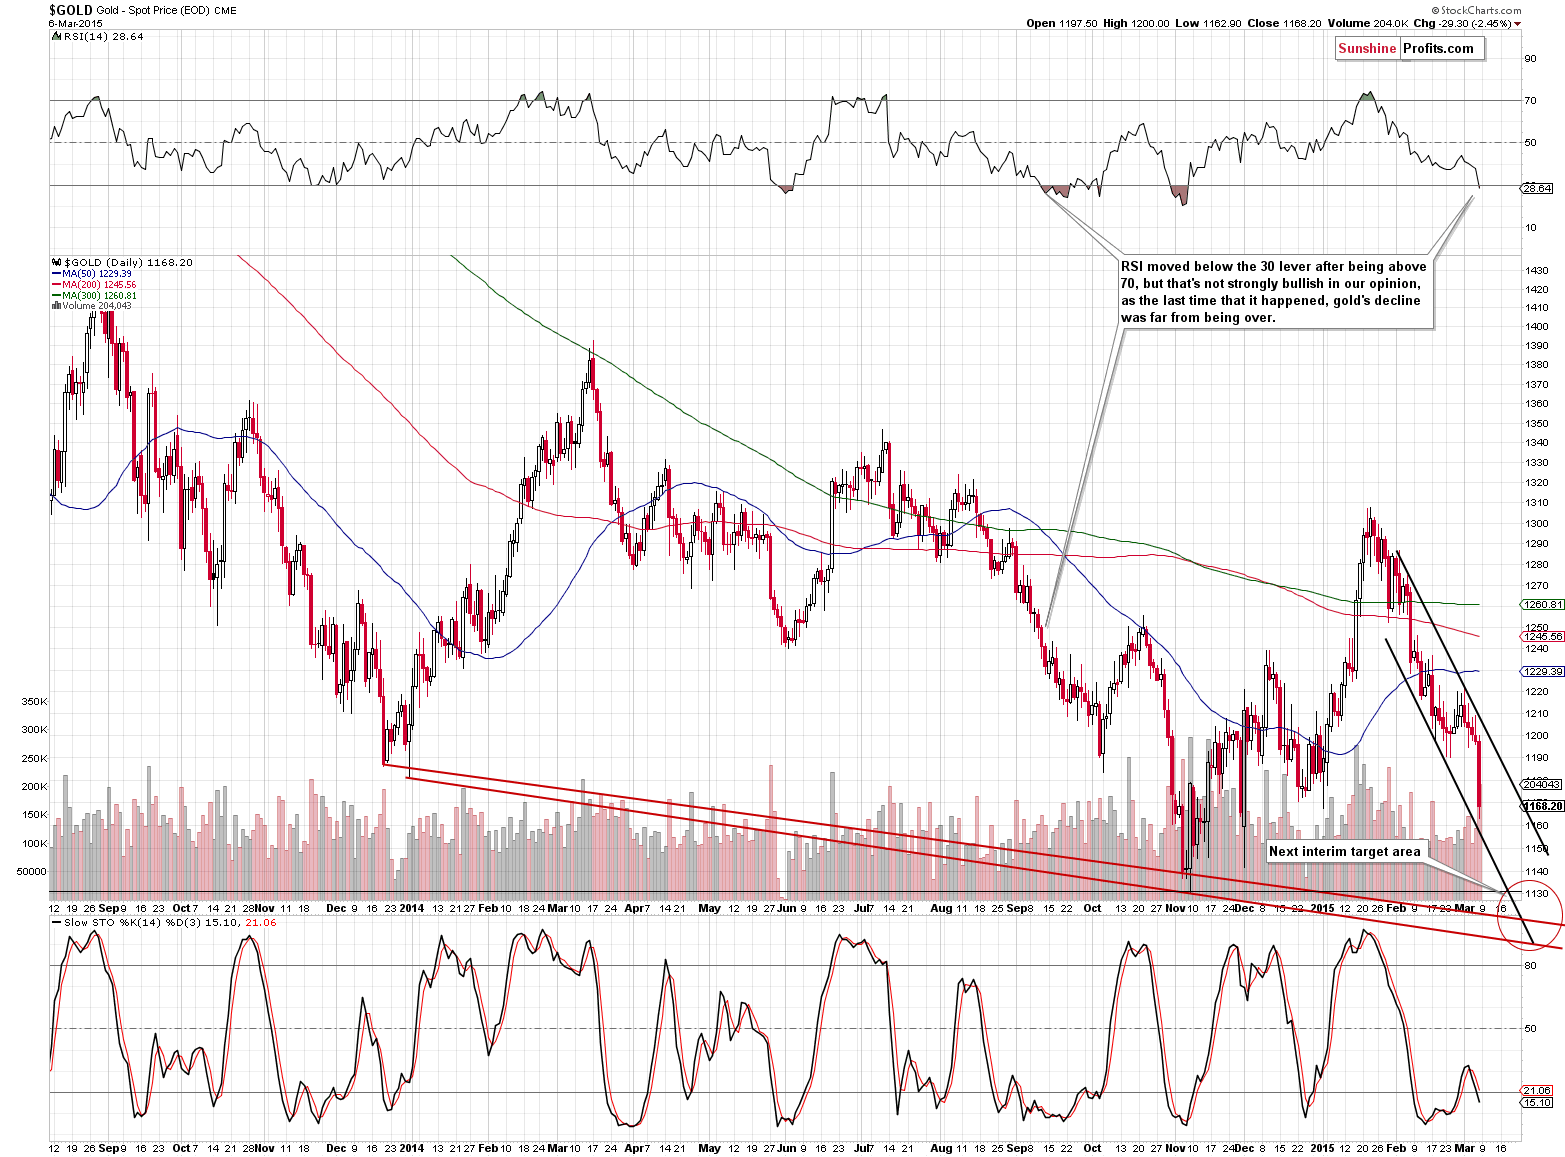
On a short-term basis, we see that gold dropped sharply and significantly on Friday. The volume was high, so it doesn’t seem that the decline was a fake move. Naturally, we could see some sideways trading here (gold is already moving a bit higher today, which is in tune with the above) as gold is likely to take a breather, but it doesn’t seem likely that the decline is over yet.
Gold remains in a declining trend channel and its likely to continue declining without a bigger counter-trend upswing until reaching our next interim target level based on the previous major lows.
Meanwhile, not much changed in the silver market.
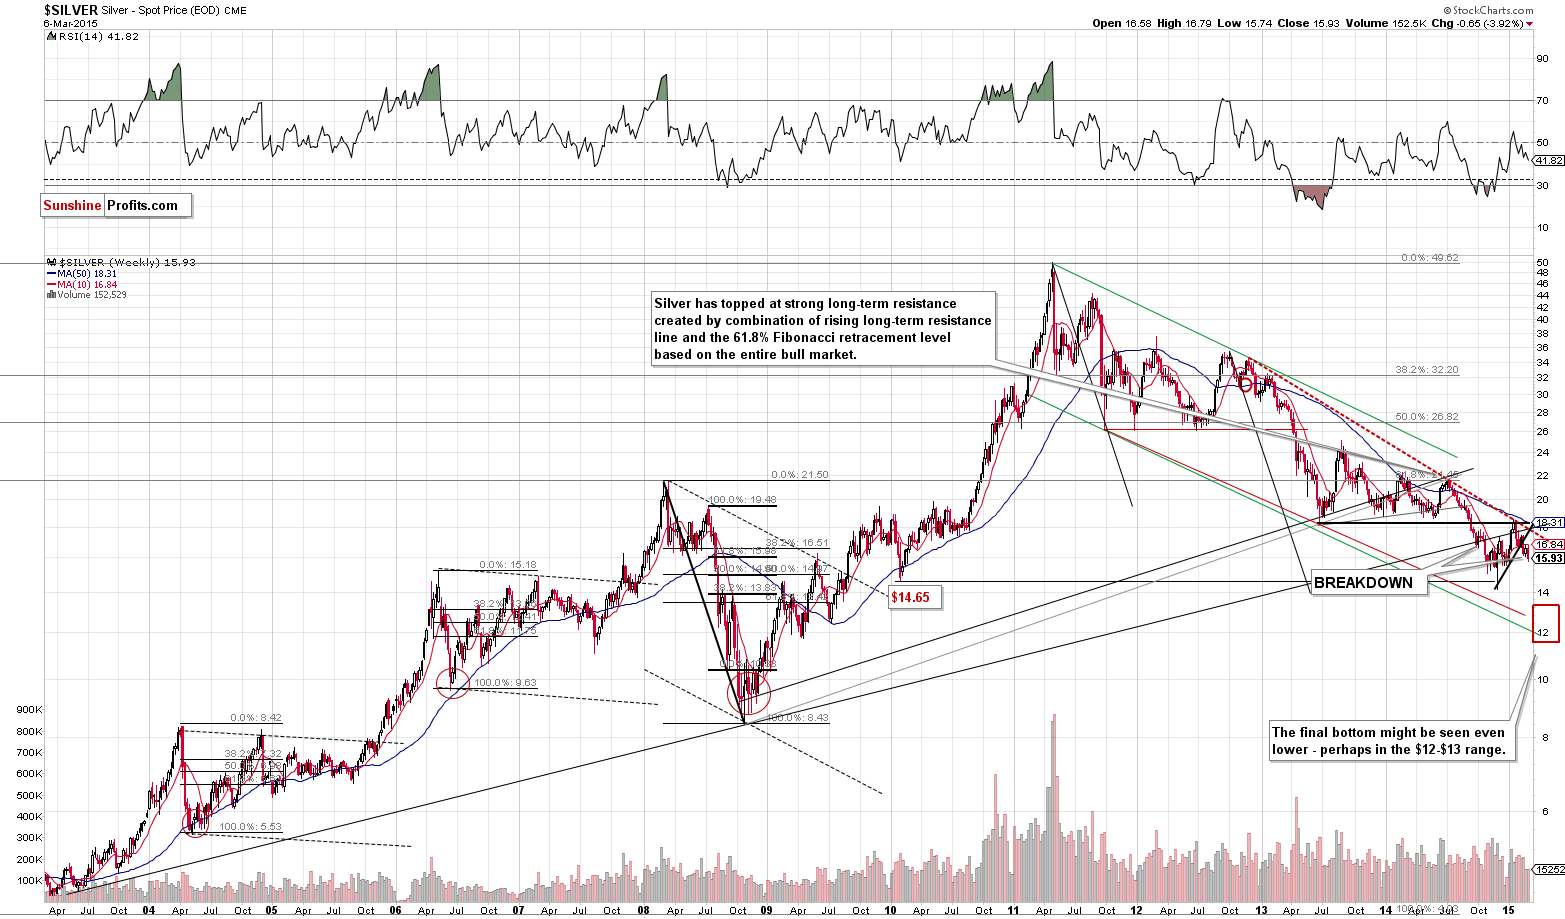
The white metal hasn’t plunged significantly yet, but it is still likely to do so in the following weeks or months i.a. because of its recent breakdown below the rising support line.
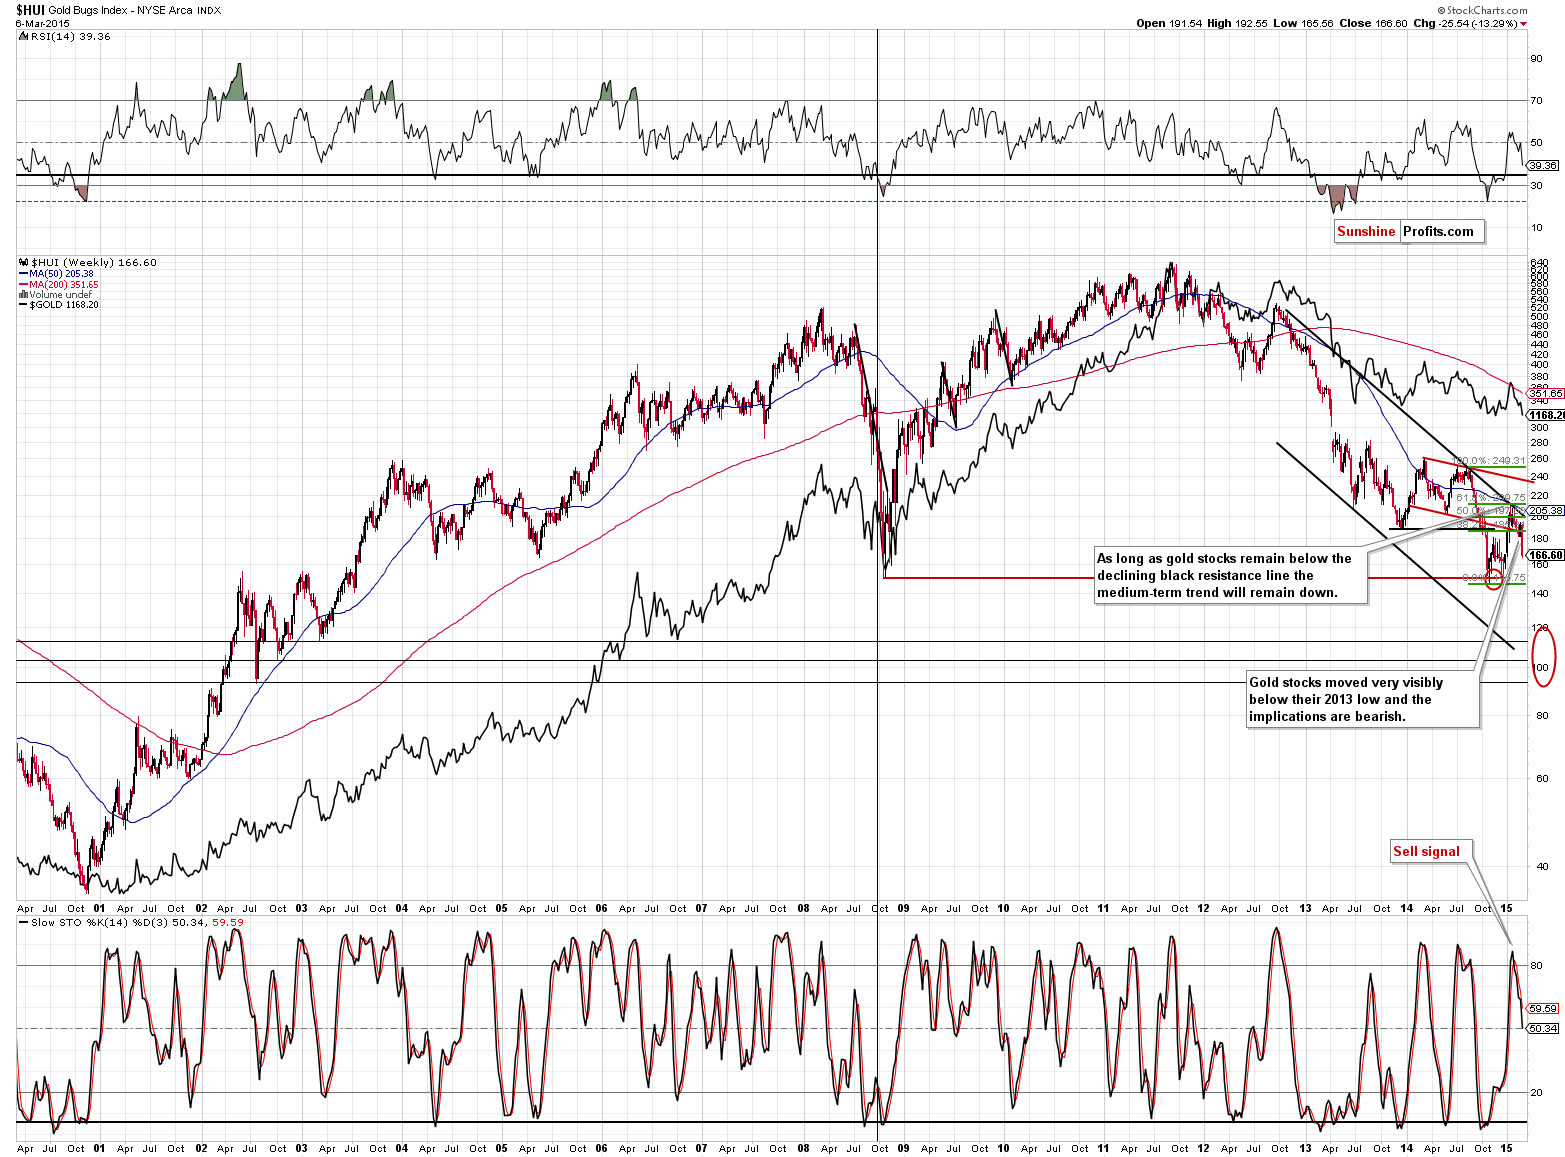
Gold stocks plunged sharply on Friday and are now well below their 2013 lows. It seems that they are back in the decline mode and their previous outperformance was indeed a very temporary phenomenon, as we expected. Once miners move below their 2008 and 2014 lows at about 150, we’ll likely see a slide below 120, perhaps even (very temporarily) below 100. Our target area in this range remains up-to-date.
On the above chart we see that the gold stocks‘ previous outperformance didn’t invalidate any trends - the decline remains in place and the outlook remains bearish.
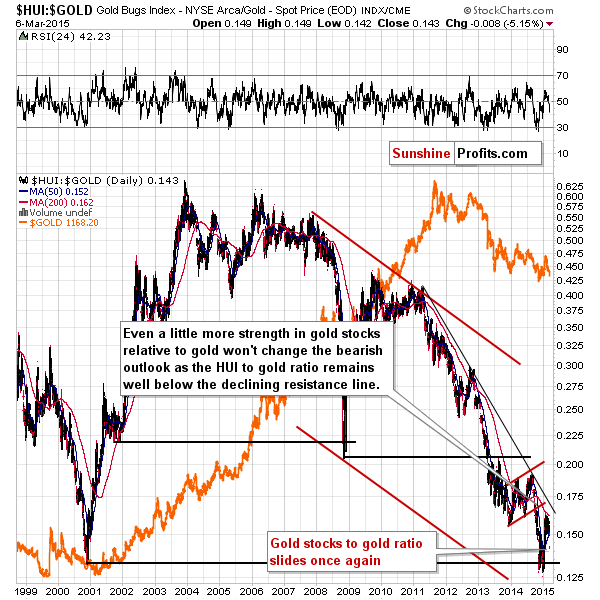
Interestingly, given the current value of the HUI to gold ratio, the size of its decline on Friday and the fact that we are likely to see more declines in the coming weeks, it seems likely that the ratio will move below the previous 2000 and 2014 lows. In other words, gold stocks will quite likely be cheaper relative to gold than they were at any point during this entire bull market. It seems that we will have an extremely favorable buying opportunity in the following months – it’s definitely the right time to be paying attention to what’s going on in the precious metals market.
Summing up, the precious metals sector moved much lower on Friday and it seems that it was another step in the current true direction of the market. We are likely to see a small corrective upswing here, but it doesn’t seem that we will see a more visible correction until we see gold close to its 2014 low. Gold stocks are now once again underperforming gold, which serves as a confirmation that the correction is over and the decline will now continue.
As the prices moved lower and our full trading positions have become more profitable, we are once again adjusting the initial target levels and stop-loss (which is not really an appropriate name at this time, because triggering them would mean exiting the market at a profit) orders and effectively locking-in even bigger profits and at the same time we are allowing them to grow even further.
As always, we’ll keep you – our subscribers – informed.
To summarize:
Trading capital (our opinion): Short positions (full) in gold, silver and mining stocks with the following stop-loss orders and initial (!) target prices:
- Gold: initial target level: $1,135; stop-loss: $1,234, initial target level for the DGLD ETN: $85.48; stop loss for the DGLD ETN $65.45
- Silver: initial target level: $15.10; stop-loss: $17.23, initial target level for the DSLV ETN: $74.05; stop loss for DSLV ETN $48.36
- Mining stocks (price levels for the GDX ETN): initial target level: $17.13; stop-loss: $21.17, initial target level for the DUST ETN: $23.49; stop loss for the DUST ETN $11.35
In case one wants to bet on lower junior mining stocks' prices, here are the stop-loss details and initial target prices:
- GDXJ: initial target level: $22.13; stop-loss: $27.38
- JDST: initial target level: $14.58; stop-loss: $7.10
Long-term capital (our opinion): No positions
Insurance capital (our opinion): Full position
Please note that a full position doesn’t mean using all of the capital for a given trade. You will find details on our thoughts on gold portfolio structuring in the Key Insights section on our website.
As a reminder – “initial target price” means exactly that – an “initial” one, it’s not a price level at which we suggest closing positions. If this becomes the case (like it did in the previous trade) we will refer to these levels as levels of exit orders (exactly as we’ve done previously). Stop-loss levels, however, are naturally not “initial”, but something that, in our opinion, might be entered as an order.
Since it is impossible to synchronize target prices and stop-loss levels for all the ETFs and ETNs with the main markets that we provide these levels for (gold, silver and mining stocks – the GDX ETF), the stop-loss levels and target prices for other ETNs and ETF (among other: UGLD, DGLD, USLV, DSLV, NUGT, DUST, JNUG, JDST) are provided as supplementary, and not as “final”. This means that if a stop-loss or a target level is reached for any of the “additional instruments” (DGLD for instance), but not for the “main instrument” (gold in this case), we will view positions in both gold and DGLD as still open and the stop-loss for DGLD would have to be moved lower. On the other hand, if gold moves to a stop-loss level but DGLD doesn’t, then we will view both positions (in gold and DGLD) as closed. In other words, since it’s not possible to be 100% certain that each related instrument moves to a given level when the underlying instrument does, we can’t provide levels that would be binding. The levels that we do provide are our best estimate of the levels that will correspond to the levels in the underlying assets, but it will be the underlying assets that one will need to focus on regarding the sings pointing to closing a given position or keeping it open. We might adjust the levels in the “additional instruments” without adjusting the levels in the “main instruments”, which will simply mean that we have improved our estimation of these levels, not that we changed our outlook on the markets. We are already working on a tool that would update these levels on a daily basis for the most popular ETFs, ETNs and individual mining stocks.
Our preferred ways to invest in and to trade gold along with the reasoning can be found in the how to buy gold section. Additionally, our preferred ETFs and ETNs can be found in our Gold & Silver ETF Ranking.
As always, we'll keep you - our subscribers - updated should our views on the market change. We will continue to send out Gold & Silver Trading Alerts on each trading day and we will send additional Alerts whenever appropriate.
The trading position presented above is the netted version of positions based on subjective signals (opinion) from your Editor, and the automated tools (SP Indicators and the upcoming self-similarity-based tool).
As a reminder, Gold & Silver Trading Alerts are posted before or on each trading day (we usually post them before the opening bell, but we don't promise doing that each day). If there's anything urgent, we will send you an additional small alert before posting the main one.
=====
Latest Free Trading Alerts:
S&P 500 index broke down below recent consolidation. Is this a new downtrend or just a downward correction within last month's move up?
Stock Trading Alert: Uncertainty Following Friday's Decline - Will Downtrend Continue?
=====
Hand-picked precious-metals-related links:
How The World Is Being Fooled About Chinese Gold Demand
All eyes on India’s gold savings plan
Platinum miners start to dust themselves off
Flipping a coin: rare U.S. coin market hits records
=====
In other news:
ECB Starts Buying German, Italian Government Bonds Under QE Plan
Greece 'threatens' early elections if reforms rejected
Creditors Reject Greece's Reform Proposals
China, central banks are key risks this week
IMF could do more for EU than ECB’s QE
The Fed might knock these Asian currencies
Forecasting Errors Reveal Swedish Riksbank’s Fall From Grace
=====
Thank you.
Sincerely,
Przemyslaw Radomski, CFA
Founder, Editor-in-chief
Gold & Silver Trading Alerts
Forex Trading Alerts
Oil Investment Updates
Oil Trading Alerts

