
On Monday, crude oil lost 0.69% as expectations for an increase in oil supply from Libya and weaker than expected U.S. economic data pushed the price lower. With this drop, light crude extended the previous session‘s losses and hit a fresh monthly low of $93.20 per barrel.
Quoting our last Oil Trading Alert:
(...) at the end of the previous week, Libya’s National Oil Corporation said that exports could soon return to near normal levels after political protesters agreed to stop months of blockages. (...) the resumption of Libya's El Sharara field could lift the country's production to 600,000 barrels per day, which is bearish for crude oil and drove the price lower in recent days.
As it turned out, ongoing expectations of rising Libyan output weighted on the price also on Monday and encouraged oil bears to act.
Also, yesterday the Institute of Supply Management said its non-manufacturing purchasing managers' index fell to 53.0 in December from 53.9 in November, while analysts expected the index to increase to 54.5.
The above data showed that the U.S. non-manufacturing sector's expansion remained on track in December, but slower than expected, which fueled concerns that the U.S. economy still faces potholes along its road to recovery and may demand less fuel and energy than expected.
Having discussed the above, let’s move on to the technical changes in the crude oil market (charts courtesy of http://stockcharts.com).
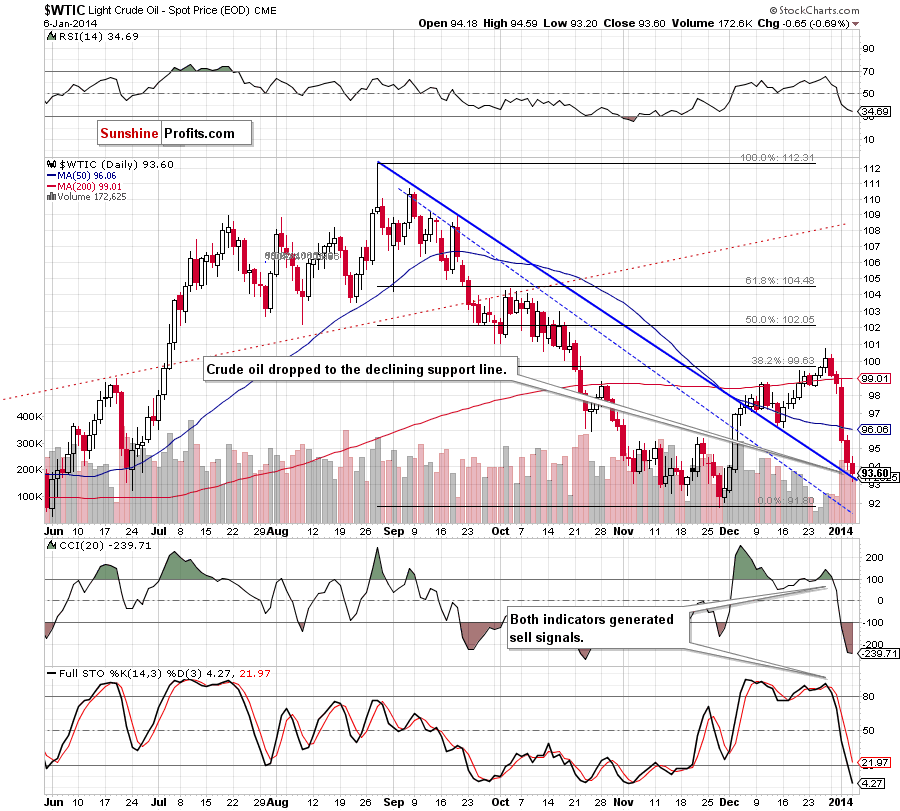
As you can see on the above chart, crude oil reached its strong short-term declining support line(based on the August and September highs and marked with blue), which successfully stopped further deterioration in December. If history repeats itself once again, we will likely see an upward correction in the coming day (or days). Additionally, we see that the recent candlesticks have materialized on decreasing volume, which suggests that the strength of the sellers has waned. Please note that the RSI dropped to its lowest level since mid-November and both other indicators are oversold, which support the bullish case.
Before we discuss the current situation in WTI Crude Oil, we would like to draw your attention to the weekly crude oil chart once again.
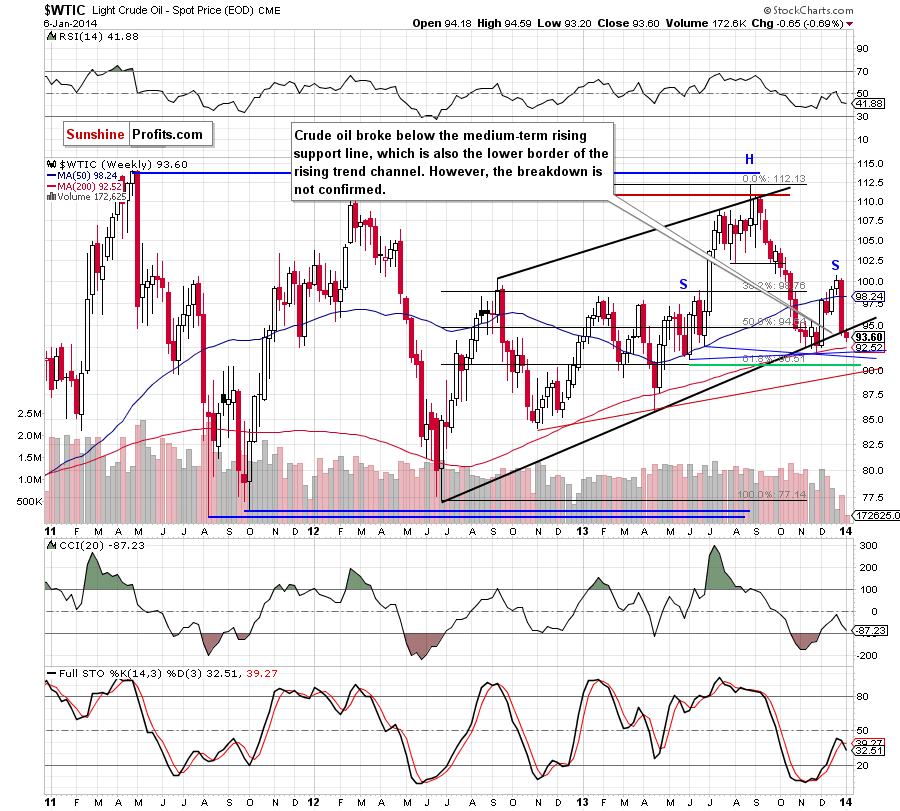
On Monday, crude oil extended its decline and dropped below this line, which is a bearish signal, however, the breakdown is not confirmed at the moment. Please note that we saw a similar phenomenon only once in the past - in November 2013 - and at that time, it was quickly invalidated, and even followed by a sharp rally. At that time, it was the 200-day moving average that stopped the decline and triggered a reversal. Perhaps we will see similar action in the following days. This moving average is about $1 below the current price, so the downside seems very limited, and given the preceding action, in the previous similar case, the upside can be quite significant, even on a short-term basis.
Having discussed the above, let’s take a look at WTI Crude Oil (the CFD).

Looking at the above chart, we see that WTI Crude Oil extended losses and hit a fresh monthly low of $93.19. With this downswing, the CFD broke below the support zone created by the 76.4% and 78.6% Fibonacci retracement levels. However, this breakdown was quickly invalidated, which is a positive sign. Nevertheless, although we saw an upward correction earlier today, it’s too early to say that the worst is already behind oil bulls - especially when we factor in the position of the indicators. Although the RSI declined once again, it still has some space for further drops. Additionally, the CCI and Stochastic Oscillator are oversold, but they haven’t generated buy signals yet. Taking these facts into account, we could see a re-test of yesterday’s low. If it holds, we will likely see further improvement (to the 38.2% Fibonacci retracement based on the recent decline). However, if oil bulls fail we could see a downswing to the next Fibonacci retracement around $92.80.
Once we know the above, let’s take a look at the NYSE Arca Oil Index (XOI) chart.
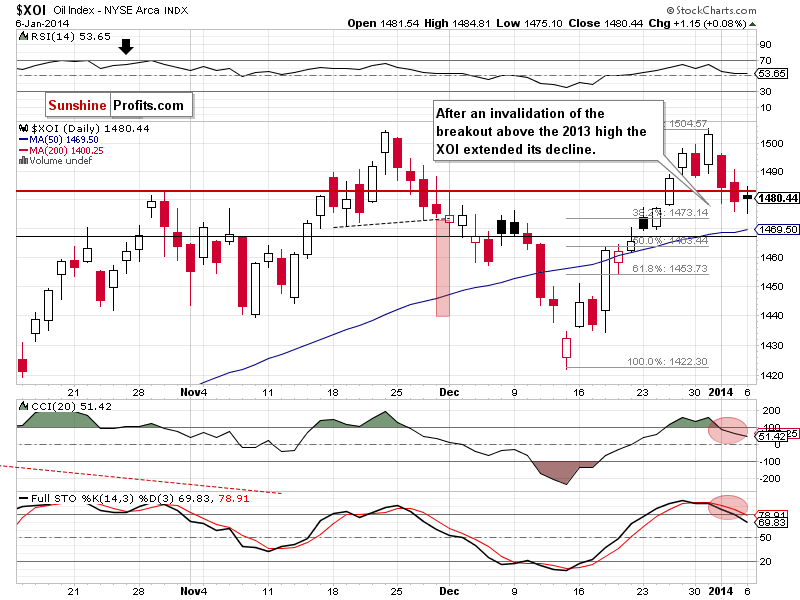
Looking at the above chart, we see that the situation hasn’t changed much. What we wrote in our previous Oil Trading Alert remains up-to-date also today.
(…) the XOI extended its decline on Friday and almost reached the 38.2% Fibonacci retracement level based on the recent rally. Therefore, if this support encourages buyers to push the buy button, we will likely see a corrective move up. On the other hand, if they fail, we will likely see further declines and the next target for the sellers will be the support zone created by the 50-day moving average and the 50% Fibonacci retracement level (between 1,463 and 1,468).
Summing up, although crude oil broke below the 76.4% Fibonacci retracement level and the medium-term rising support line (both breakdowns are not confirmed) it still remains above the short-term declining support line, which successfully stopped declines in December. Additionally, recent candlesticks have materialized on decreasing volume, which suggests that the strength of the sellers has waned. Taking these facts into account, we may see an upward correction in the near future. We are waiting to see a confirmation that the bottom is in, before suggesting going long, or an invalidation of the above-mentioned support lines (the medium- and short-term one) before we consider going short.
Very short-term outlook: bearish
Short-term outlook: bearish
MT outlook: mixed
LT outlook: mixed
Trading position (short-term): We do not suggest opening any positions at the moment. We will keep you informed should anything change, or should we see a confirmation/invalidation of the above.
Thank you.
Nadia Simmons
Forex & Oil Trading Strategist
Oil Investment Updates
Oil Trading Alerts
PS. Every now and then we will make our Oil Trading Alerts available publicly. Our subscribers receive these alerts on each trading day and remain updated via additional alerts if the situation requires it. We encourage you to join them.
Back