

Gold & Silver Trading Alert originally sent to subscribers on August 24, 2015, 8:59 AM
Briefly: In our opinion, long (half) speculative positions in gold, silver and mining stocks are justified from the risk/reward point of view.
Well, not entirely everything, but both the USD Index and – especially – the general stock market declined substantially and so – to a smaller extent – did silver and mining stocks. Gold moved higher. The Friday session was definitely important – but in what way was it important to precious metals investors?
At the first sight, it looked bearish (especially the underperformance of the miners), but looking at Friday’s events from a bigger perspective makes us think that actually not much changed in the precious metals market. The outlook deteriorated, but only a little.
Let’s take a closer look (charts courtesy of http://stockcharts.com).
On Friday we wrote the following:
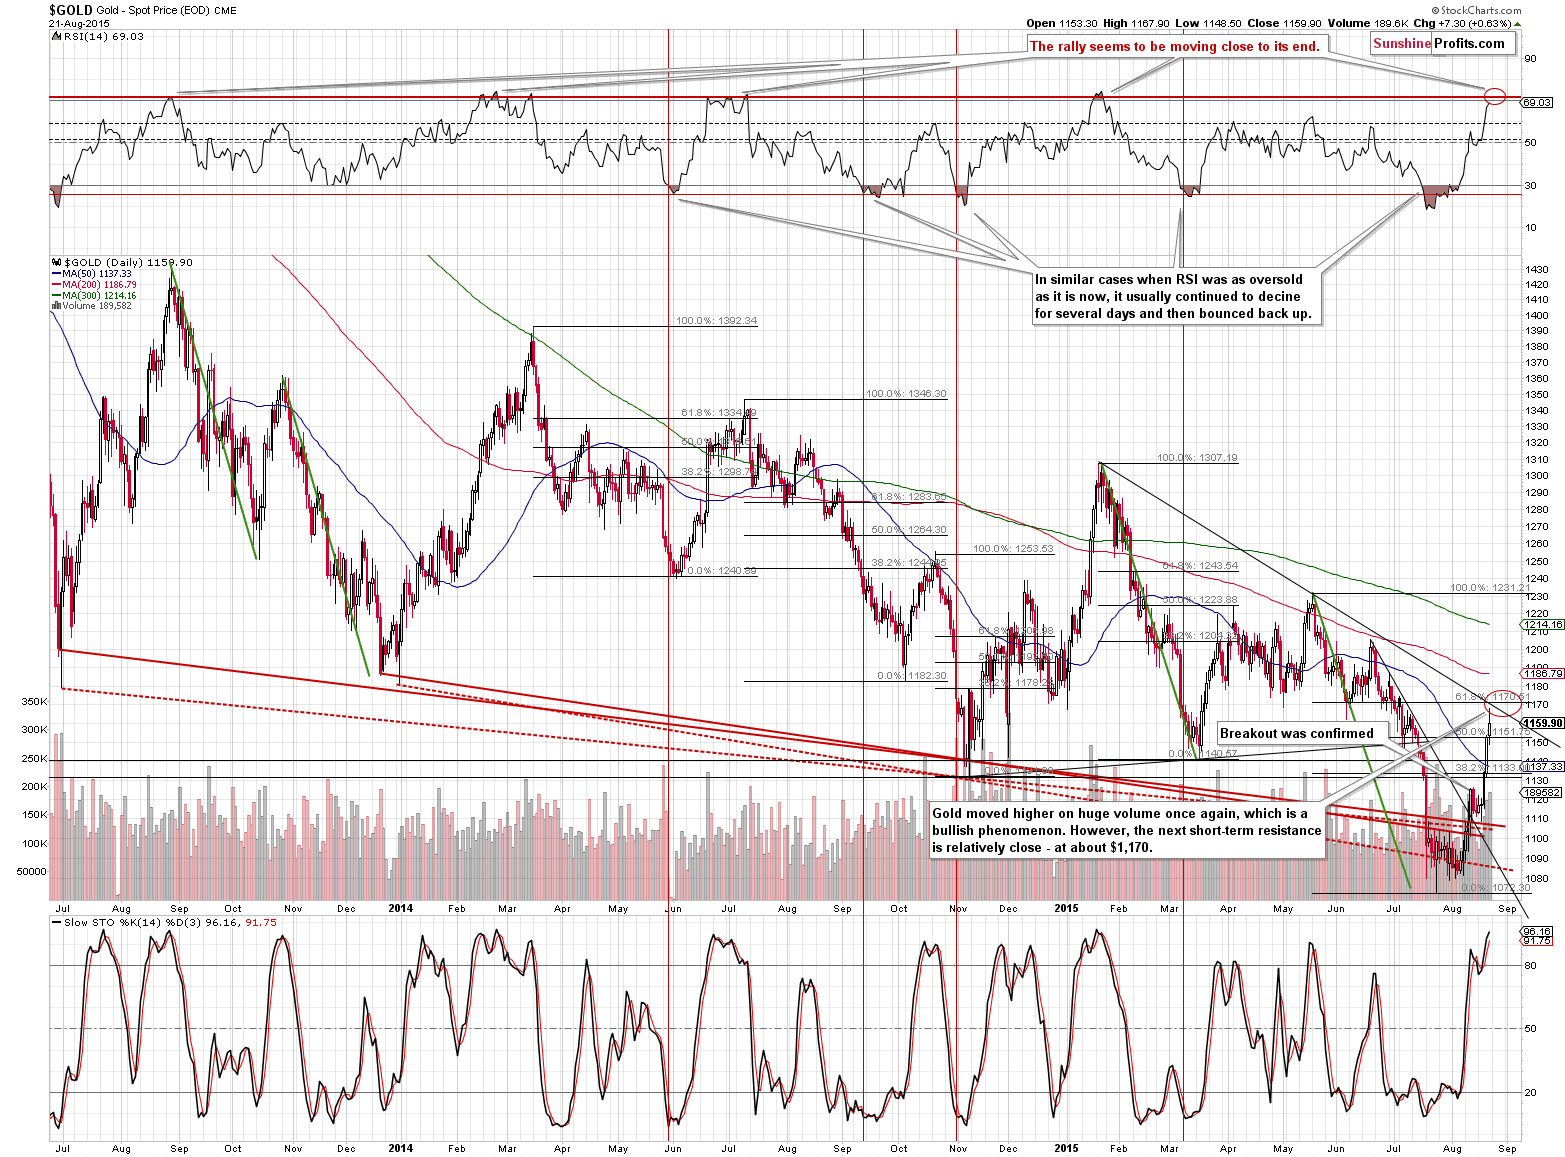
Gold moved higher and on strong volume, which is a very bullish sign for the short term. The fact that gold moved above the 2014 low also bodes well for the precious metals sector in general.
However, more significant resistance levels remains just above where gold is right now. The 61.8% Fibonacci retracement and the declining resistance line coincide at about $1,170, which is our current target for the yellow metal. The RSI indicator moved above our previous interim target area and at this time it’s likely to move slightly above 70 before topping. This means that gold is likely to move higher but not significantly so.
The above is generally up-to-date. Gold once again moved higher on strong volume and the RSI is moving to our target area but not yet at it. Gold moved very close to our short-term target level, but we are not closing the speculative long position just yet. Why?
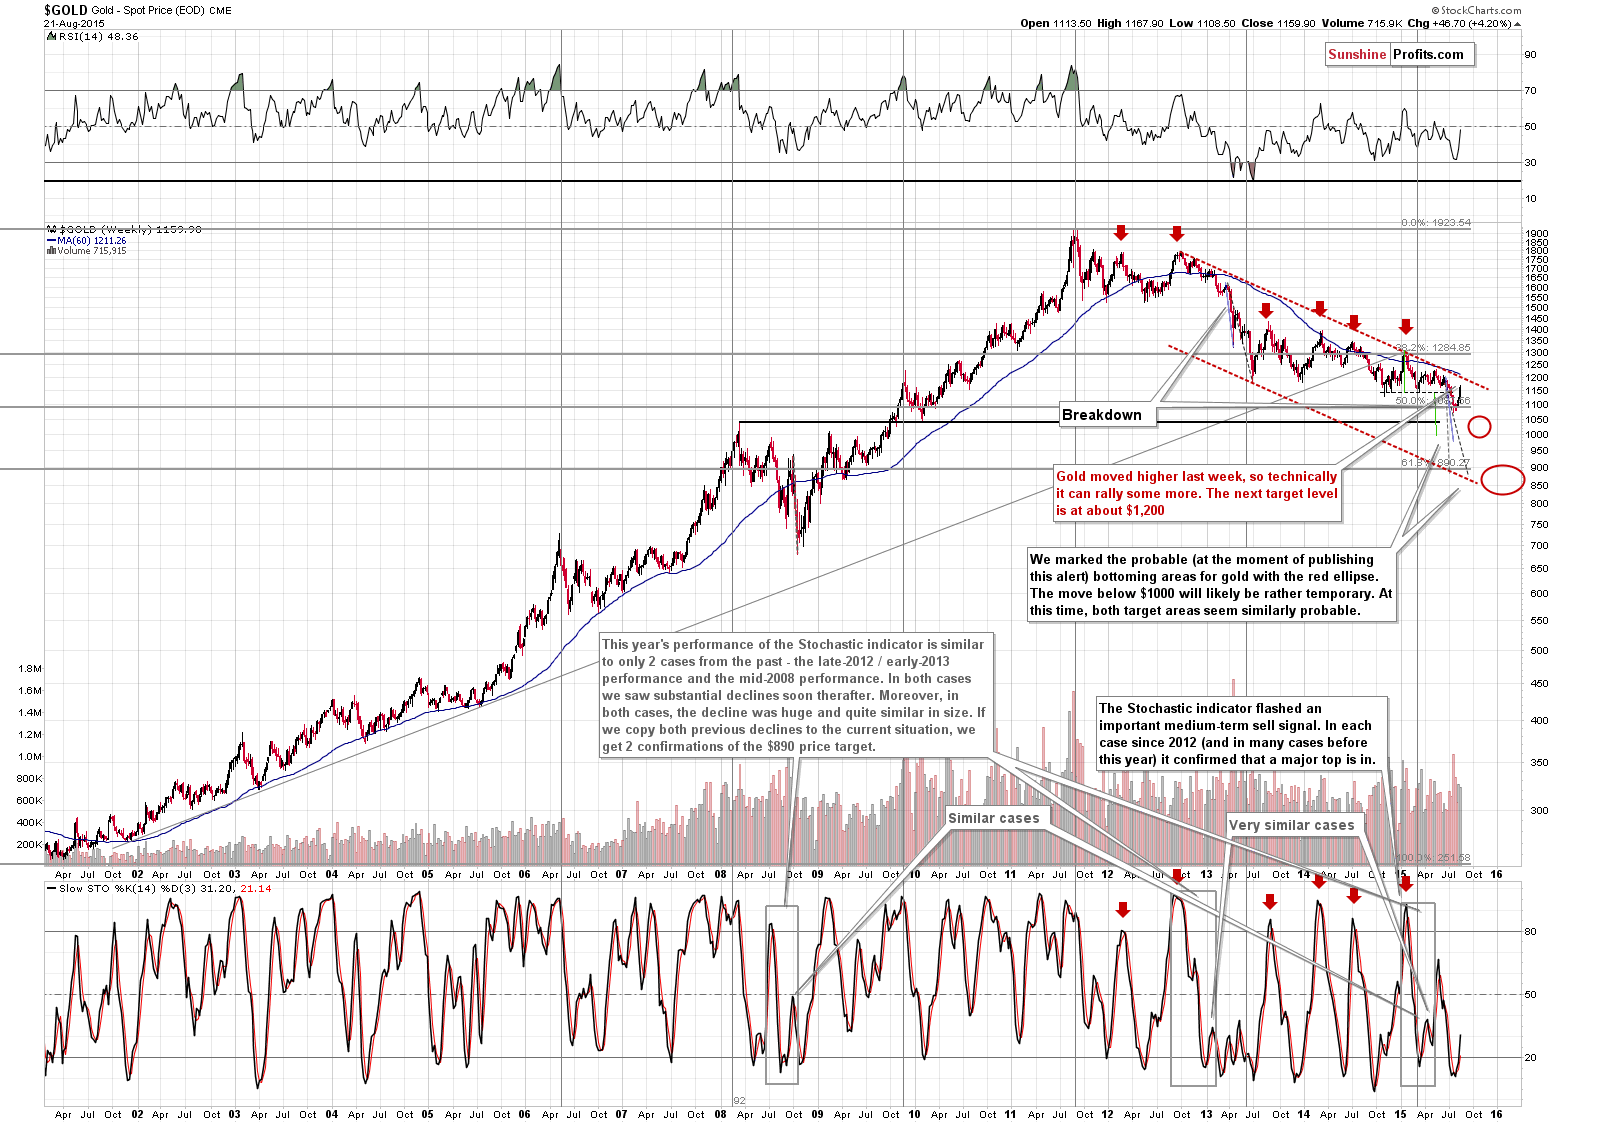
Because from the long-term perspective we see that the much more important resistance level is even higher – close to the $1,200 level. This is where the declining long-term resistance line and the 60-week moving average are, which makes this level a very strong resistance. If gold moves even higher temporarily, it’s likely to stop close to the $1,200 level.
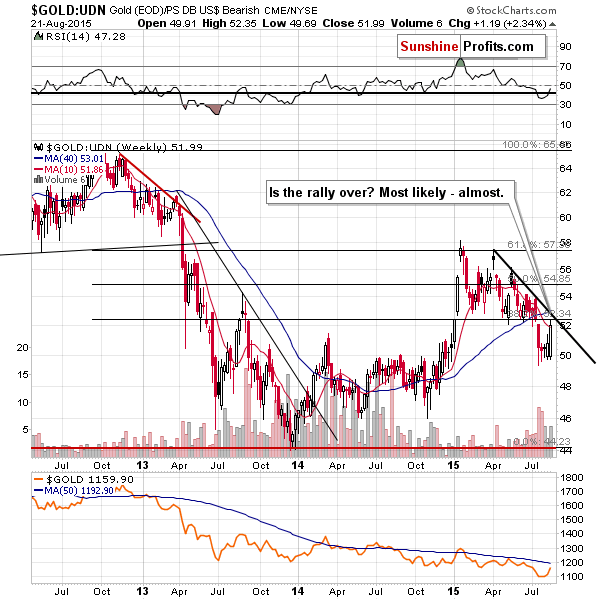
From the non-USD perspective (the average of gold prices in currencies other than the USD with weights as in the USD Index) we see that gold moved to one of the Fibonacci retracement levels, but not yet to the declining resistance line. Consequently, the rally is likely close to being over, but not necessarily over just yet.
On Friday we commented on the Dow to gold ratio in the following way:
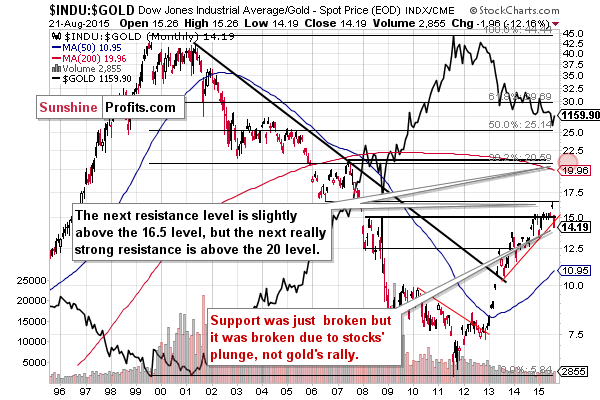
On the above chart we can see that the Dow to gold ratio moved to the rising support line, which tells us that it’s going to rally once again soon or shortly. The opposite can be said about gold – it’s likely to decline, but not necessarily immediately.
The ratio moved sharply lower on Thursday and Friday as the general stock market declined in a volatile fashion. The implications of the breakdown are bearish for the ratio and bullish for gold, but not strongly so, as the breakdown was not confirmed and is relatively small so far.
Having said that, let’s move to silver.
In the previous alerts we wrote the following about silver:
Speaking of sell signals, we would like to see sharp outperformance of silver as a confirmation of the top – just like we’ve seen it so many times before. If it does materialize, the odds are that silver will rally visibly higher than it is today (to $16 or so) and that’s one of the reasons to keep part of the long position opened.
The above remains up-to-date. We haven’t seen a sell signal from silver so far.
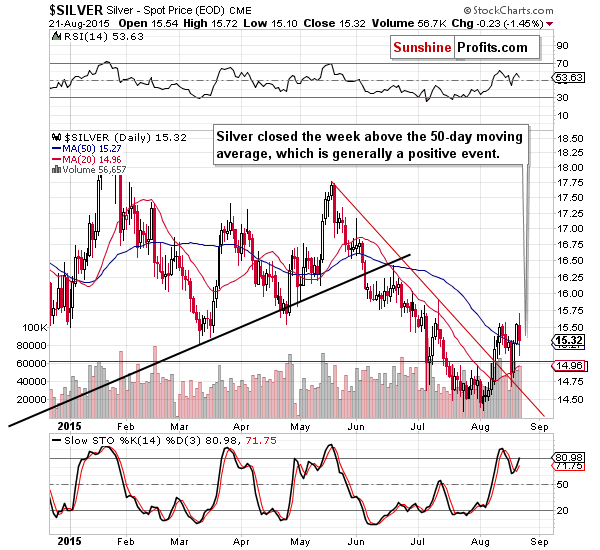
In addition to the above, we can say that – despite Friday’s decline - silver closed the week above the 50-day moving average, which is a bullish sign.
Our previous comments on the long-term silver chart remain up-to-date as well:
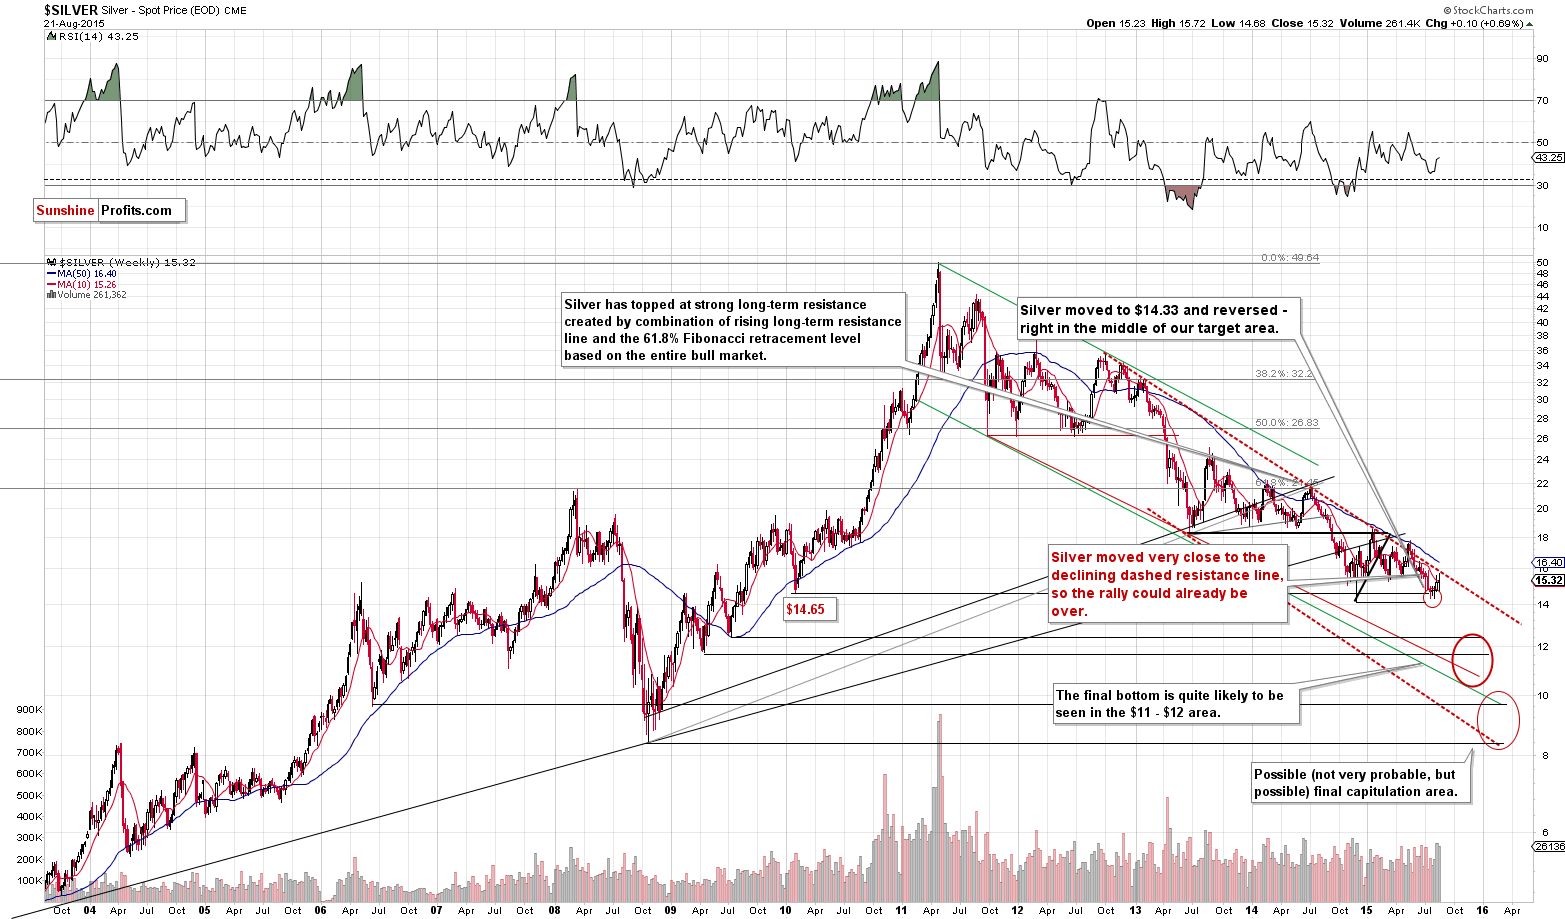
From the long-term perspective we see that silver can go a bit higher without bigger problems, however, it’s not likely to rally much further as the declining resistance line is just ahead.
Please note that since the declining resistance line is very close and we expect to see silver’s outperformance as a confirmation of the top, then it’s quite likely that silver will move even higher temporarily – likely above the declining resistance line. If that happens, it will not automatically have bullish implications, just as it didn’t have them earlier this year when silver moved above it. What happened back then could very well be seen also this time. Namely, silver could rally to the 50-week moving average (currently at $16.40) and decline thereafter. This seems like a quite likely scenario for the following days (or weeks).
On Friday, we wrote the following:
From the short-term point of view, it seems that the rally is close to being over, but not over yet. On a very short-term basis, we have bullish implications from the price-volume link. The volume is higher during the daily upswings than during the daily downswings, so the immediate-term implications are bullish.
The above is quite up-to-date – the price-volume link continues to have bullish implications.
However, the declining resistance line was just hit, which has bearish implications. The 38.2% Fibonacci retracement was almost reached, so we wouldn’t be surprised to see a local top shortly. That’s quite in tune with what other charts were suggesting, though.
The above remains up-to-date in the sense that the price-volume link continues to have bullish implications. The 38.2% Fibonacci retracement was hit and the price reversed, also invalidating the small breakout above the declining resistance line.
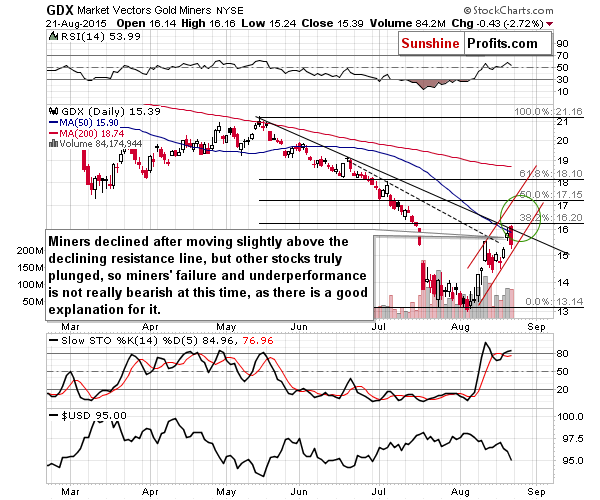
Normally, we would view the above as a very bearish combination. However, this time we had a major decline in the general stock market, which is the likely reason for the mining stocks’ bad performance and thus it’s no wonder that miners didn’t manage to move higher on Friday.
Speaking of out- and underperformance, one could view the fact that mining stocks declined while gold rallied as a bearish sign. However, if we compare the performance of mining stocks to other stocks, we can say that they actually held up very well and outperformed. Consequently, we don’t think that we can draw meaningful conclusions from the mining stocks’ relative performance just yet.
Moreover, please note that the short-term rising support line was not broken and the short-term trend remains up.
Summing up, while a lot happened on Friday, it seems that little actually changed. We have yet to see meaningful confirmations that the local top is really in. The uptrends in gold, silver and mining stocks remain in place although silver and miners declined on Friday. There was a very good reason for this kind of underperformance in the form of a big decline in the general stock market (both silver and mining stocks tend to move along with stocks at times), so we don’t necessarily view it as something bearish. The situation is not extremely bullish, though, so we think that taking partial profits off the table on Thursday was a good idea.
Depending on how the situation evolves, we will adjust the current trading position accordingly. The most likely outcome in our view is that metals and miners will move a bit higher (which is when we aim to close the remaining half of the current long position) and then continue their decline. How high will gold, silver and miners likely go? The target is unclear in the case of gold (but most likely $1,200 or so), about $16.40 in the case of silver and about $16.50 - $17 in the case of GDX. It will most likely be bearish confirmations that will make us close the position, not specific price levels being reached, so we are not providing “exit order” levels at this time.
We are moving our initial target declines higher for gold, silver and the GDX, but we are keeping the stop-loss orders intact.
The stop-loss levels may seem to be relatively far (especially for those who have not been following our analyses for a long time) so we would like to take this opportunity to explain our approach regarding them. The point is that in the vast majority of cases these levels are never reached as we close the positions earlier, when a combination (!) of signals from price and (!) volume makes the situation unfavorable (or – in most cases – when we think it’s a good idea to take profits). It is usually the case that intra-day moves are not meaningful and tend to be reversed, especially for silver. Until the session is over (when the stop-loss levels can be triggered) we don’t have the volume data, which makes the move much less meaningful. Consequently, when we set a stop-loss order, the question that we are answering is “to what price level would a given asset have to move, for the price itself (!) to make the situation bad enough for us to close the positions regardless of all other factors?”. Without the volume data and without considering other factors than the price itself, the move has to be significant for us to change our mind about a given trade. That’s why our stop-loss levels are usually relatively far comparing to what many traders are used to. On the bright side… Previous years and also the recent weeks have shown that the above approach works very well (taking the recent daily slide in silver as an example) and it contributes to our performance.
We will keep you – our subscribers – updated.
To summarize:
Trading capital (our opinion): Long position (half) position in gold, silver and mining stocks is justified from the risk/reward perspective with the following stop-loss orders and initial (! – this means that reaching them doesn’t automatically close the position) target prices:
- Gold: initial target price: $1,200; stop-loss: $1,113, initial target price for the UGLD ETN: $10.97; stop loss for the UGLD ETN $8.75
- Silver: initial target price: $16.40; stop-loss: $14.32, initial target price for the USLV ETN: $17.66; stop loss for USLV ETN $11.55
- Mining stocks (price levels for the GDX ETN): initial target price: $16.75; stop-loss: $14.57, initial target price for the NUGT ETN: $5.74; stop loss for the NUGT ETN $3.77
In case one wants to bet on junior mining stocks' prices (we do not suggest doing so – we think senior mining stocks are more predictable in the case of short-term trades – if one wants to do it anyway, we provide the details), here are the stop-loss details and initial target prices:
- GDXJ: initial target price: $24.28; stop-loss: $20.27
- JNUG: initial target price: $15.28; stop-loss: $8.95
Long-term capital (our opinion): No positions
Insurance capital (our opinion): Full position
Please note that a full position doesn’t mean using all of the capital for a given trade. You will find details on our thoughts on gold portfolio structuring in the Key Insights section on our website.
As a reminder – “initial target price” means exactly that – an “initial” one, it’s not a price level at which we suggest closing positions. If this becomes the case (like it did in the previous trade) we will refer to these levels as levels of exit orders (exactly as we’ve done previously). Stop-loss levels, however, are naturally not “initial”, but something that, in our opinion, might be entered as an order.
Since it is impossible to synchronize target prices and stop-loss levels for all the ETFs and ETNs with the main markets that we provide these levels for (gold, silver and mining stocks – the GDX ETF), the stop-loss levels and target prices for other ETNs and ETF (among other: UGLD, DGLD, USLV, DSLV, NUGT, DUST, JNUG, JDST) are provided as supplementary, and not as “final”. This means that if a stop-loss or a target level is reached for any of the “additional instruments” (DGLD for instance), but not for the “main instrument” (gold in this case), we will view positions in both gold and DGLD as still open and the stop-loss for DGLD would have to be moved lower. On the other hand, if gold moves to a stop-loss level but DGLD doesn’t, then we will view both positions (in gold and DGLD) as closed. In other words, since it’s not possible to be 100% certain that each related instrument moves to a given level when the underlying instrument does, we can’t provide levels that would be binding. The levels that we do provide are our best estimate of the levels that will correspond to the levels in the underlying assets, but it will be the underlying assets that one will need to focus on regarding the sings pointing to closing a given position or keeping it open. We might adjust the levels in the “additional instruments” without adjusting the levels in the “main instruments”, which will simply mean that we have improved our estimation of these levels, not that we changed our outlook on the markets. We are already working on a tool that would update these levels on a daily basis for the most popular ETFs, ETNs and individual mining stocks.
Our preferred ways to invest in and to trade gold along with the reasoning can be found in the how to buy gold section. Additionally, our preferred ETFs and ETNs can be found in our Gold & Silver ETF Ranking.
As always, we'll keep you - our subscribers - updated should our views on the market change. We will continue to send out Gold & Silver Trading Alerts on each trading day and we will send additional Alerts whenever appropriate.
The trading position presented above is the netted version of positions based on subjective signals (opinion) from your Editor, and the Tools and Indicators.
As a reminder, Gold & Silver Trading Alerts are posted before or on each trading day (we usually post them before the opening bell, but we don't promise doing that each day). If there's anything urgent, we will send you an additional small alert before posting the main one.
Thank you.
Sincerely,
Przemyslaw Radomski, CFA
Founder, Editor-in-chief
Gold & Silver Trading Alerts
Forex Trading Alerts
Oil Investment Updates
Oil Trading Alerts
