

Forex Trading Alert originally sent to subscribers on January 19, 2016, 5:42 AM.
Earlier today, official data showed that the U.K. consumer price index rose 0.1% in the previous month. Additionally, the annual rate of inflation rose 0.2%, beating forecasts of 0.1%. Thanks to these numbers, GBP/USD moved higher and came back above 1.4300. Will we see a trend reversal in the coming days?
In our opinion the following forex trading positions are justified - summary:
- EUR/USD: short (stop-loss order at 1.1363; initial downside target at 1.0462)
- GBP/USD: none
- USD/JPY: none
- USD/CAD: none
- USD/CHF: none
- AUD/USD: none
EUR/USD
Quoting our previous commentary:
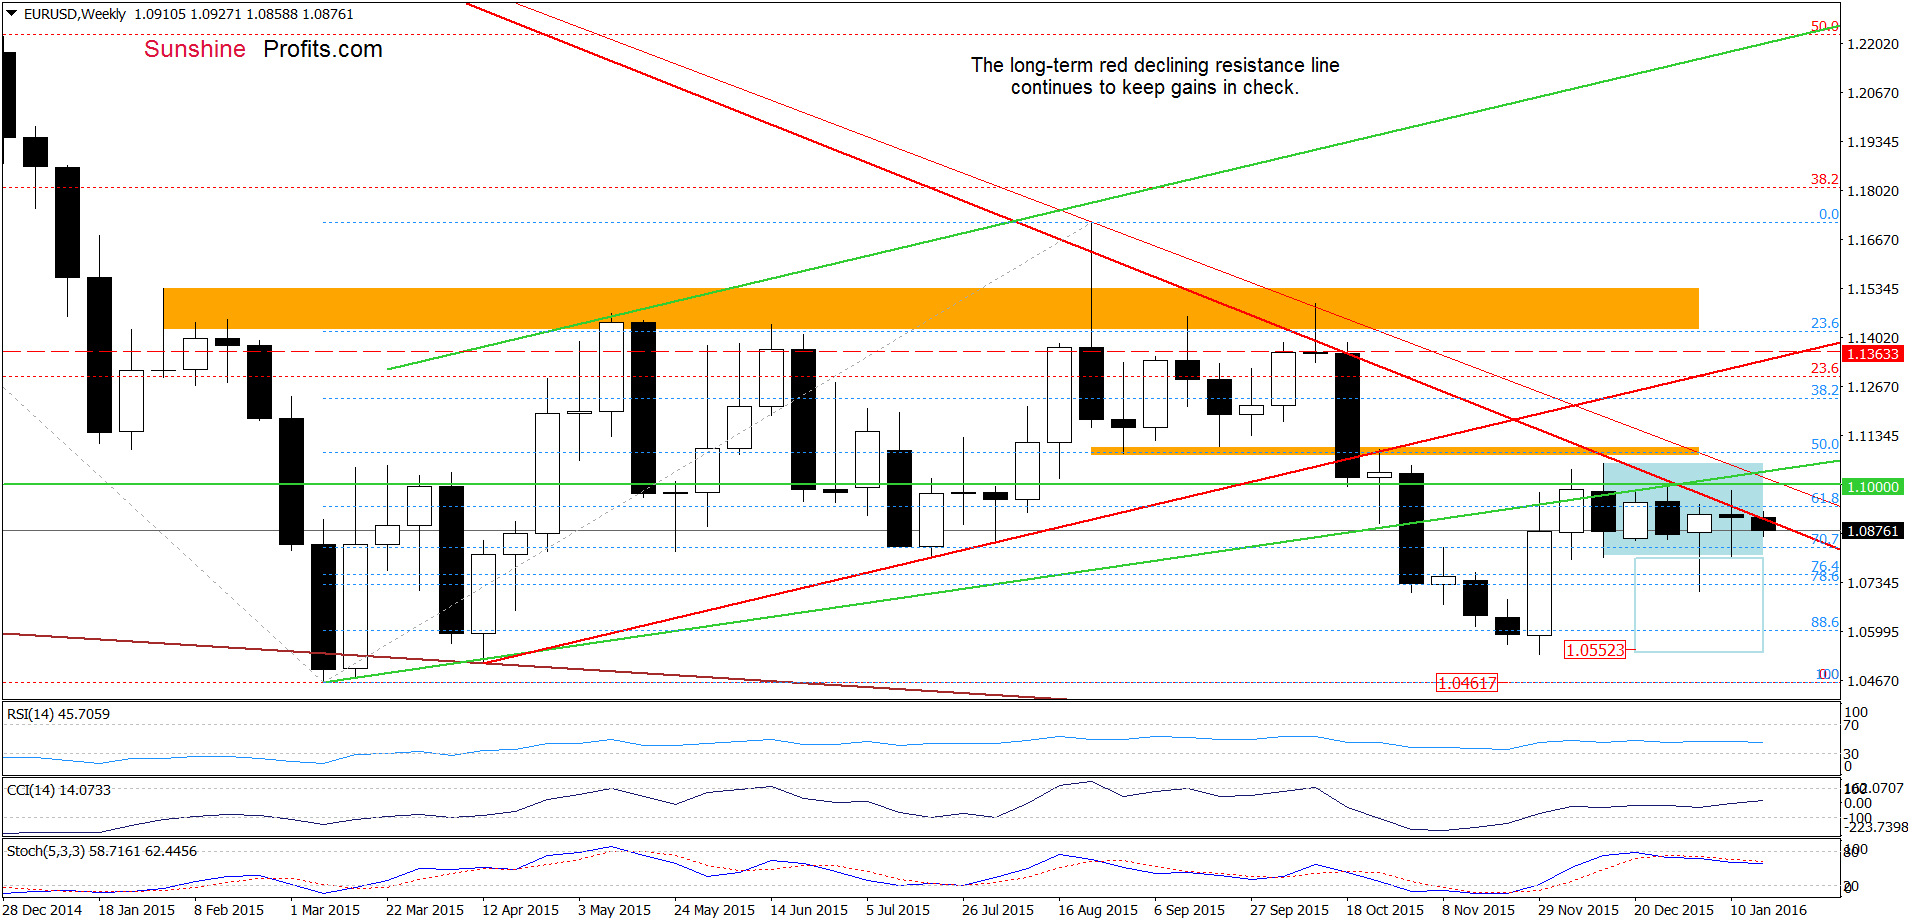
(…) EUR/USD extended gains and climbed above the long-term red declining line. Despite this positive event, currency bulls didn’t manage to hold gained levels, which triggered a pullback that took the pair under this key resistance. What does it mean for the exchange rate? When we take a closer look at the weekly chart, we can notice see that there were similar situations in Aug and Oct. Back then, an invalidation of earlier breakout above the long-term red line was the first bearish signal before bigger decline. Taking this fact into account, we think that history will repeat itself once again and we’ll see another downward move in the coming week(s).
From today’s point of view, we see that currency bears pushed the pair lower as we had expected. What impact did this drop have on the very short-term picture? Let’s check.
Yesterday, we wrote:
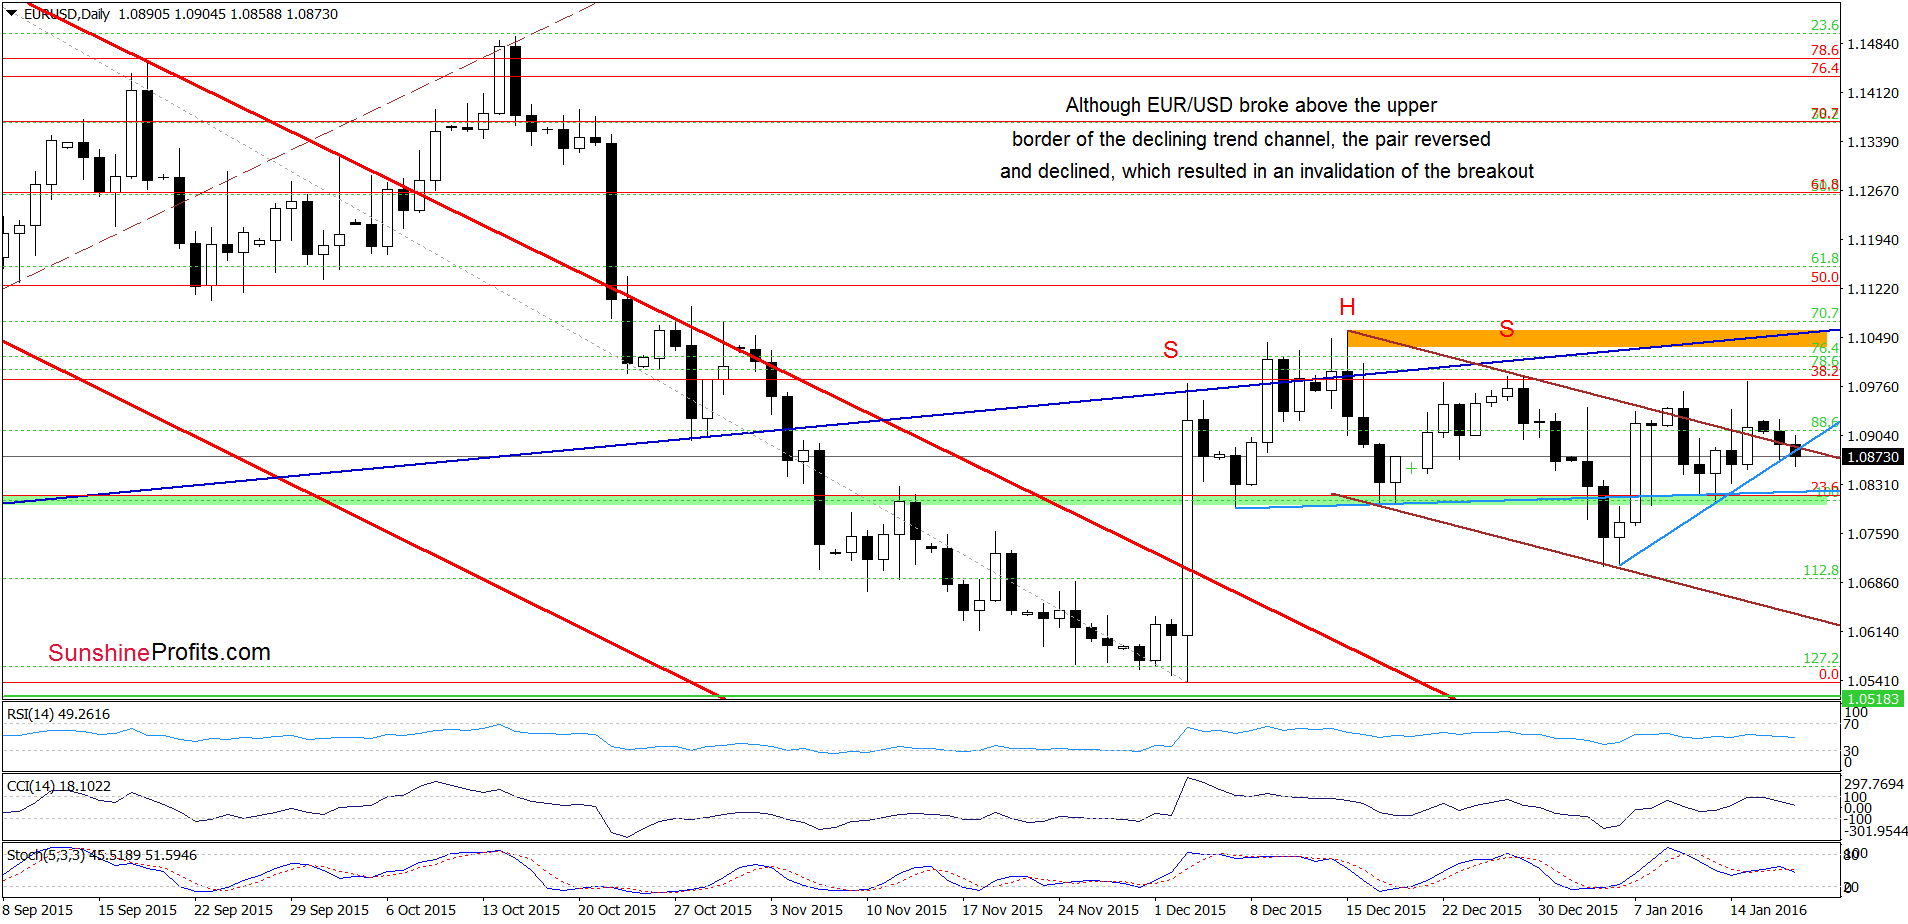
(…) although EUR/USD moved sharply higher on Friday, the 38.2% Fibonacci retracement in combination with the late Dec highs stopped further improvement. As a result, the pair gave up some gains and approached the previously-broken upper border of the brown declining trend channel. Earlier today, currency bears pushed the pair lower, which suggests an invalidation of the breakout in the coming day(s).
Looking at the daily chart, we see that the situation developed in line with the above scenario and the exchange rate not only invalidated the breakout, but also dropped under the blue support line based on the previous lows. This means that our yesterday’s initial downside target remains unchanged:
(…) If (…) the exchange rate closes the day under this line, it would be a bearish signal, which will trigger another test of the green support zone.
Very short-term outlook: bearish
Short-term outlook: bearish
MT outlook: bearish
LT outlook: mixed
Trading position (short-term; our opinion): Short positions (with a stop-loss order at 1.1363 and the initial downside target at 1.0462) are justified from the risk/reward perspective. We will keep you informed should anything change, or should we see a confirmation/invalidation of the above.
GBP/USD
Earlier today, GBP/USD moved higher and came back above 1.4300, which means that what we wrote yesterday is up-to-date:
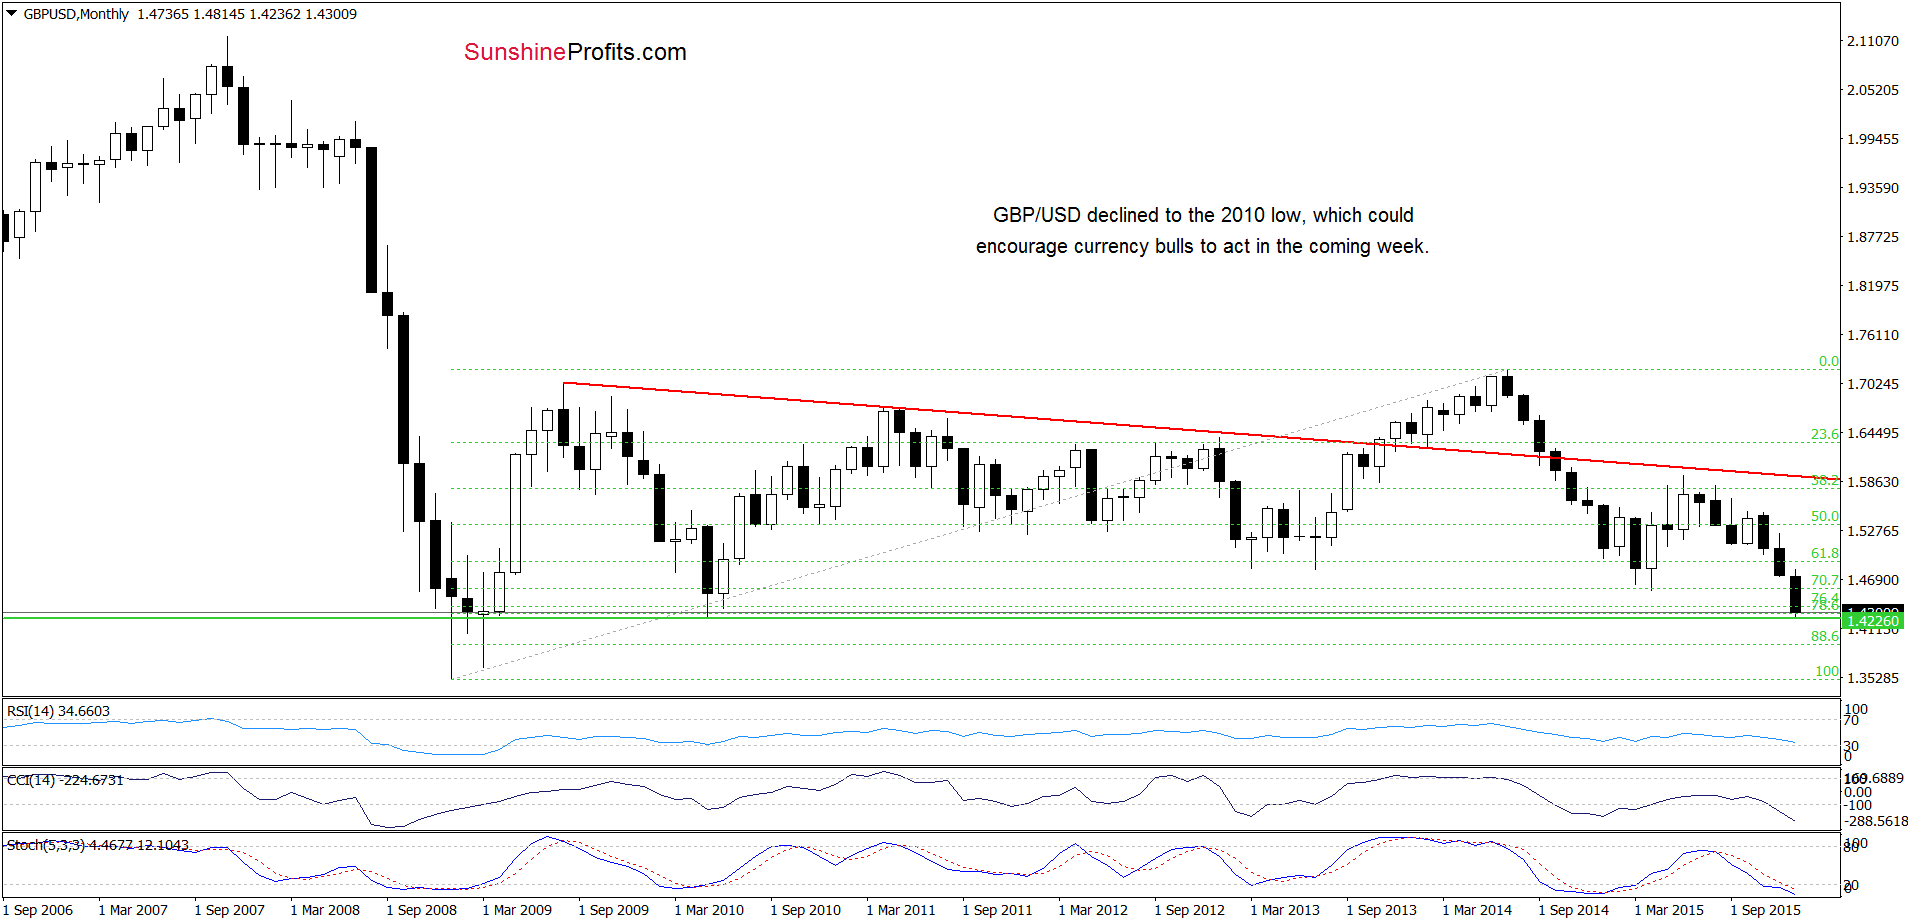
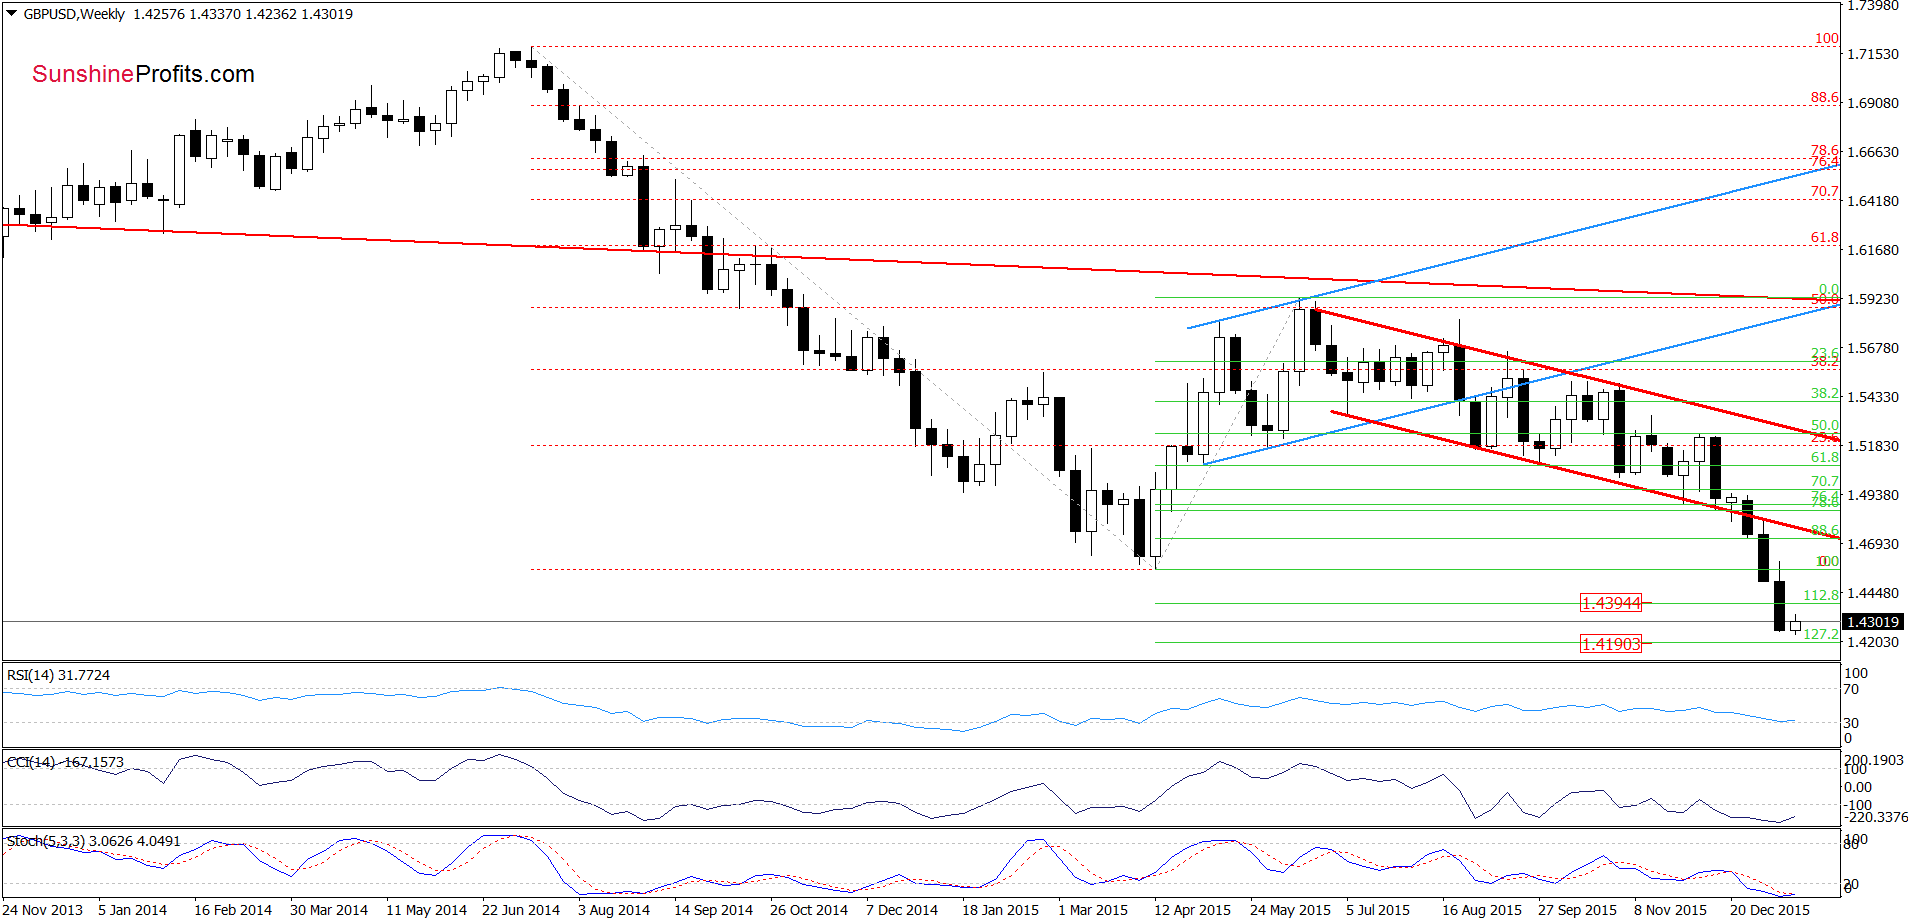
(…) the pair approached the May 2010 low of 1.4226, which suggests that we may see a rebound from here in the coming week – especially when we factor in the current position of the weekly indicators. At this point, it is worth noting that even if the pair moves little lower from here, the next support level (the 127.2% Fibonacci extension around 1.4195) is quite close.
Finishing today’s commentary on this currency pair, please note that if GBP/USD extends gains, the initial upside target would be around 1.4564, where the Apr low is.
Very short-term outlook: mixed
Short-term outlook: mixed
MT outlook: mixed
LT outlook: mixed
Trading position (short-term; our opinion): No positions are justified from the risk/reward perspective at the moment. We will keep you informed should anything change, or should we see a confirmation/invalidation of the above.
USD/JPY
On Monday, we wrote:
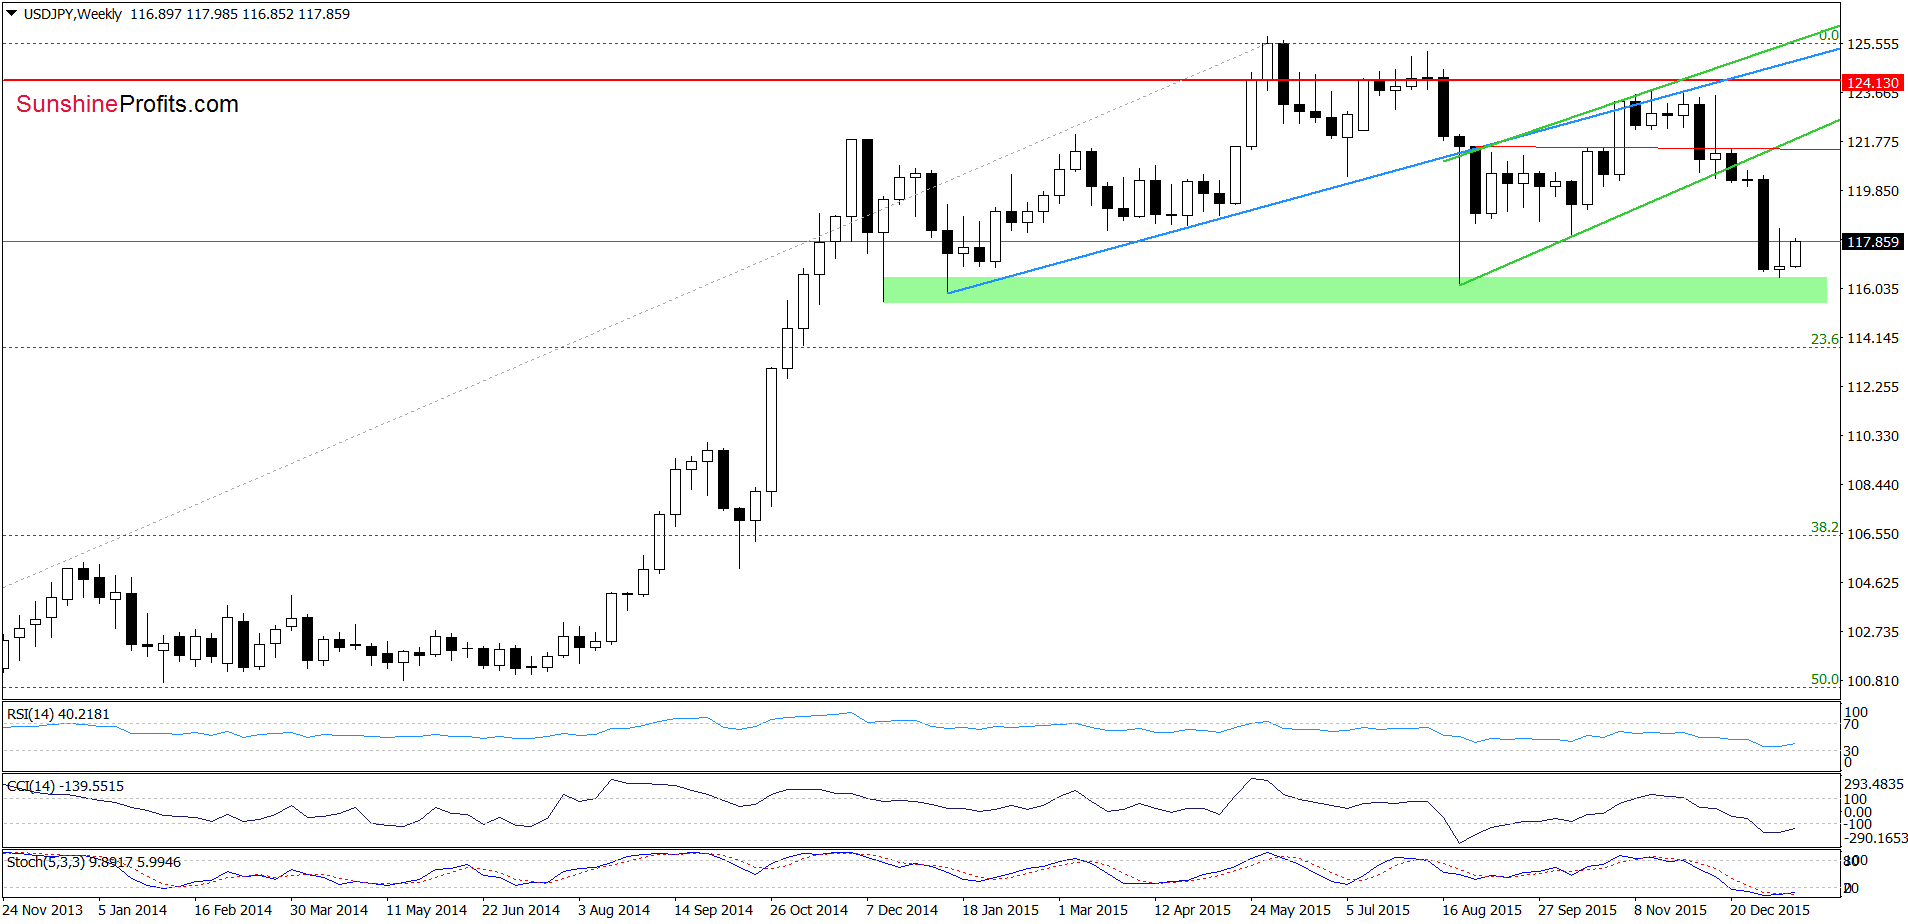
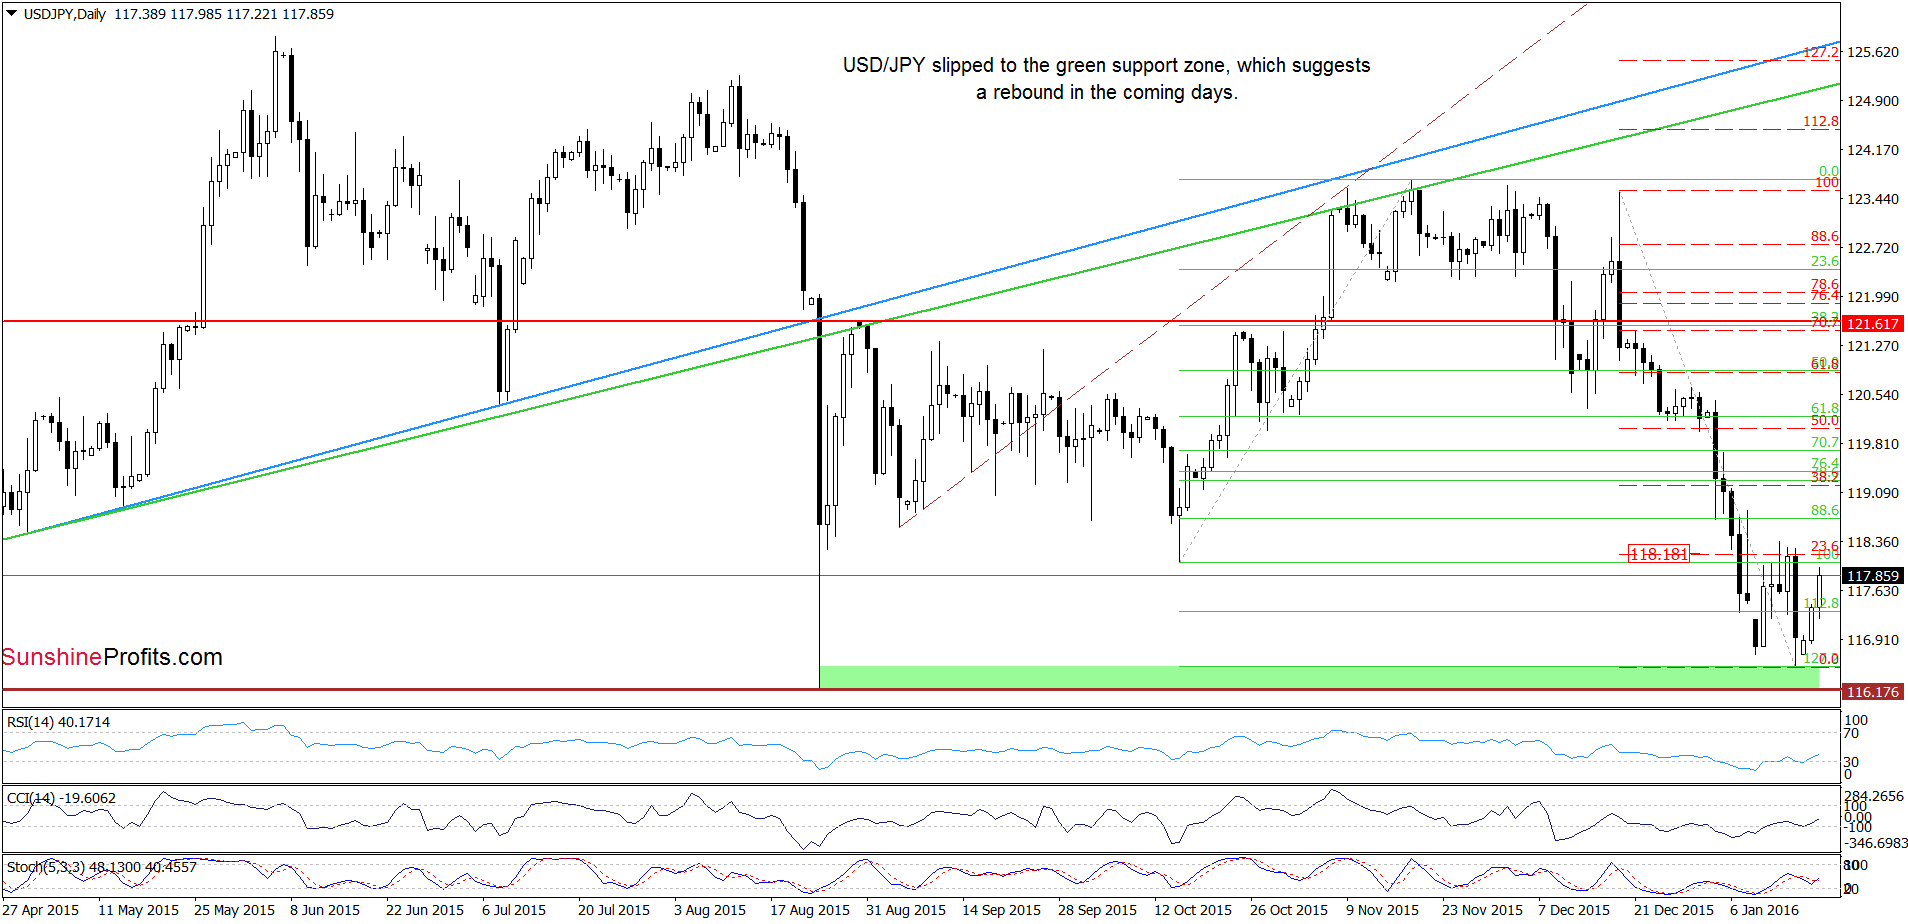
(...) the pair reached the green support zone (created by the 127.2% Fibonacci extension and the Aug low), which suggests a rebound from here in the coming days. If we see such price action, the initial upside target would be around 118.18-118.36, where the recent highs and the 23.6% Fibonacci retracement (based on the Dec-Jan declines) are.
As you see on the daily chart, USD/JPY extended gains, which means that our yesterday’s initial upside target wuld be in play later in the day. If the pair breaks above it, we may see an increase to around 119.19, where the next Fibnacci retracement is.
Very short-term outlook: mixed with bullish bias
Short-term outlook: mixed
MT outlook: mixed
LT outlook: mixed
Trading position (short-term; our opinion): No positions are justified from the risk/reward perspective at the moment. We will keep you informed should anything change, or should we see a confirmation/invalidation of the above.
Thank you.
Nadia Simmons
Forex & Oil Trading Strategist
Przemyslaw Radomski, CFA
Founder, Editor-in-chief
Gold & Silver Trading Alerts
Forex Trading Alerts
Oil Investment Updates
Oil Trading Alerts
