

Forex Trading Alert originally sent to subscribers on December 17, 2015, 8:27 AM.
Yesterday, the Federal Reserve decided to raise interest rates by 25 basis points for the first time in almost a decade, which fuelled optimism over the strength of the U.S. economy and pushed the USD Index to 99 earlier today. How did this move affect the technical picture of EUR/USD, GBP/USD and USD/CAD?
In our opinion the following forex trading positions are justified - summary:
EUR/USD
Yesterday, we wrote the following:
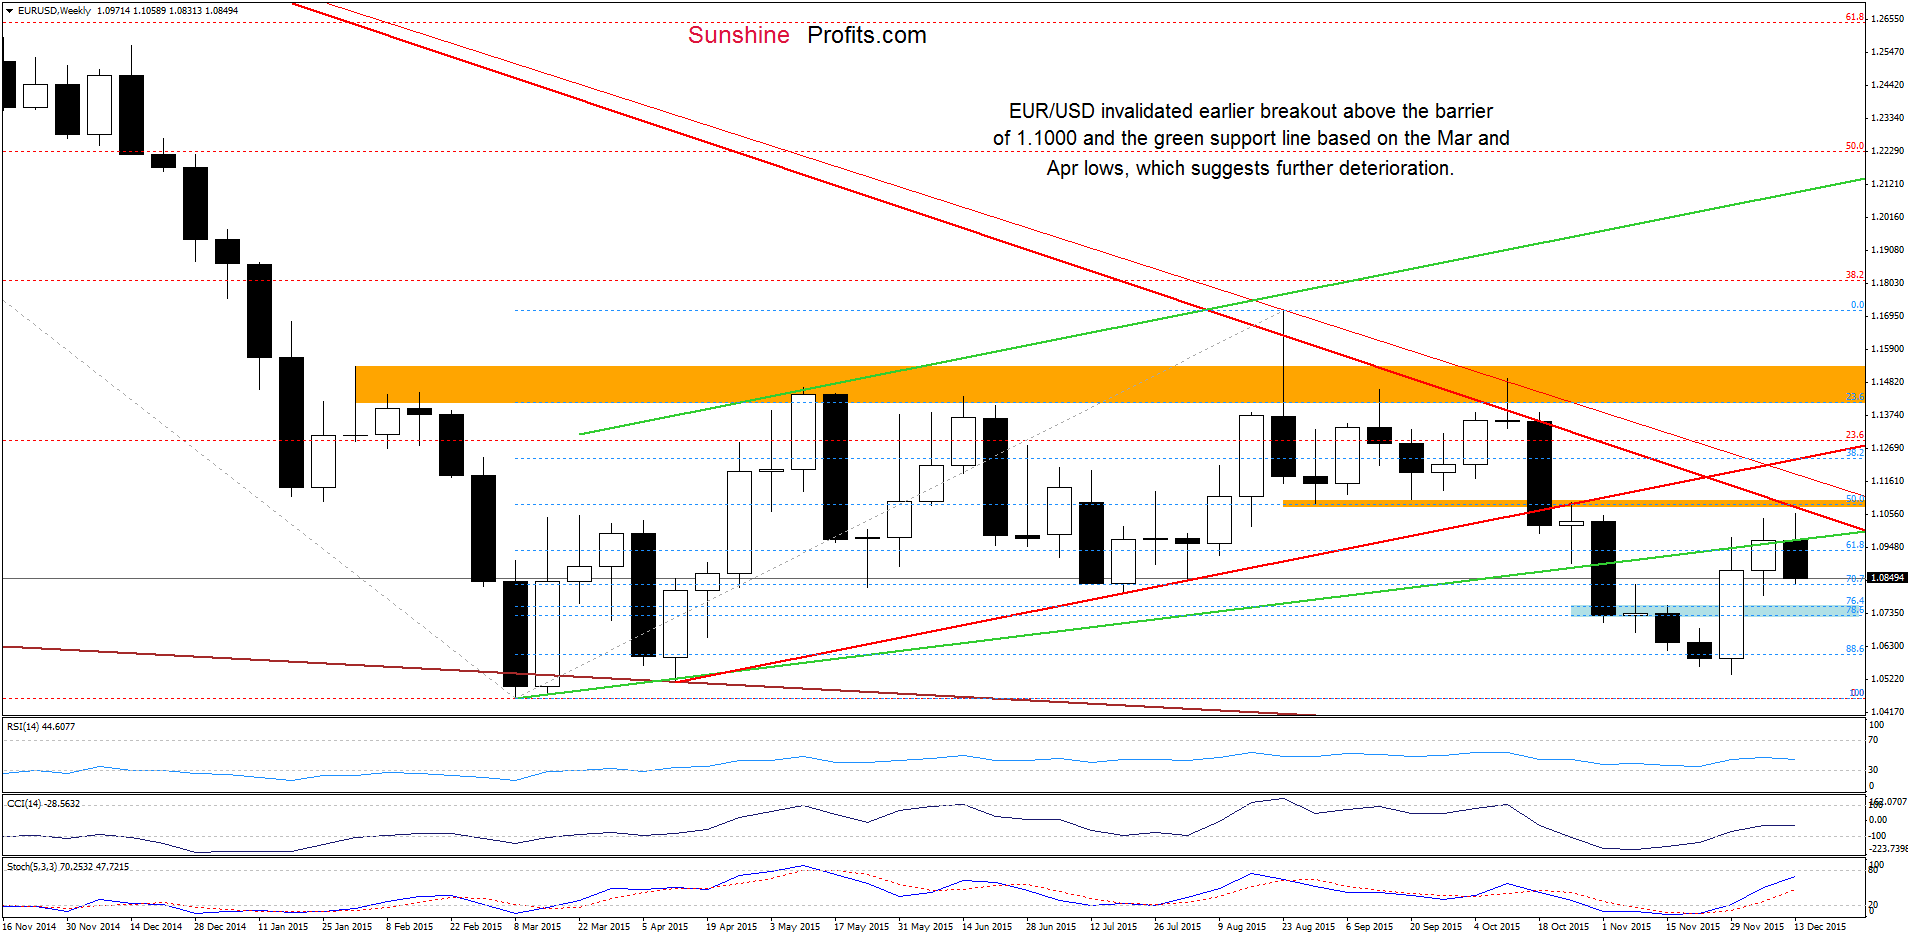
(…) EUR/USD reversed and invalidated earlier breakout above the barrier of 1.1000 and the green line based on the Mar and Apr lows, which is a negative signal. Taking this fact into account, and combining it with the proximity to the orange resistance zone and the long-term red declining resistance line we think that further deterioration is just around the corner.
From today’s point of view, we see that currency bears pushed the pair lower (as we had expected), which suggests a test of the blue support zone in the coming days.
Are there any factors that could hinder the realization of the above scenario? Let’s examine the very short-term picture and find out.
Quoting our previous alert:
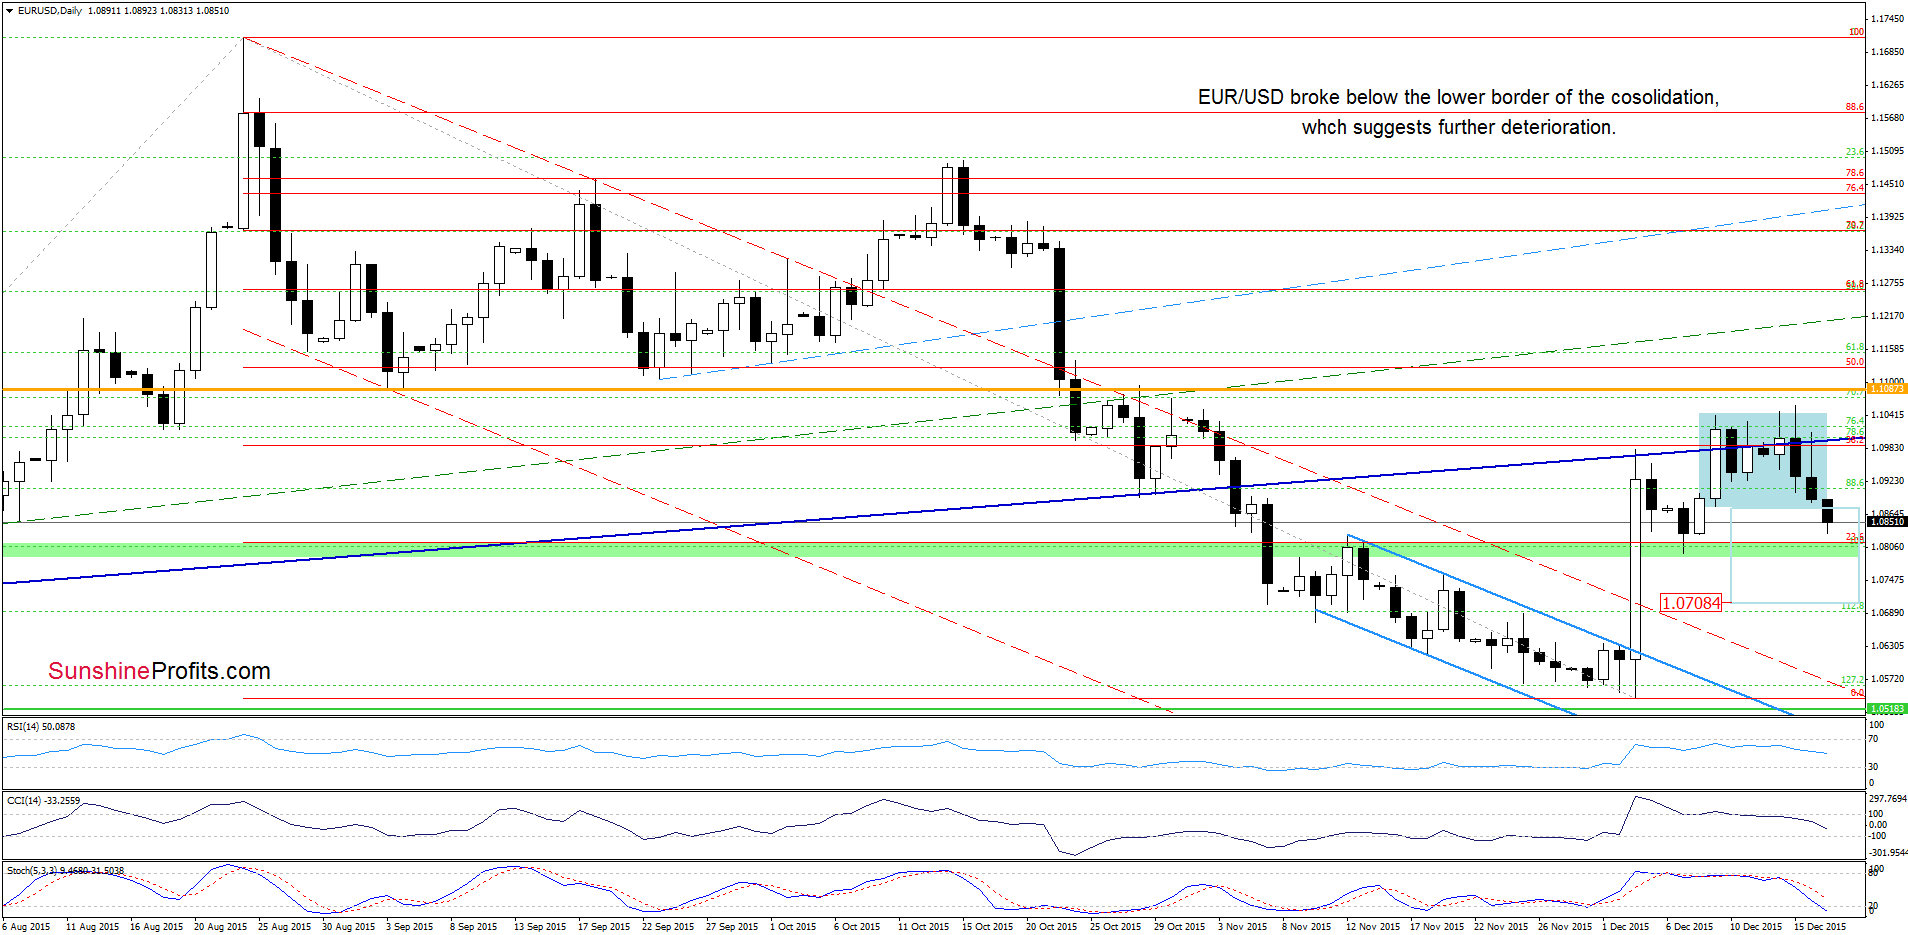
(…) the pair invalidated earlier breakout, which is a bearish signal that suggests lower values of the exchange rate in the coming days. Nevertheless, in our opinion, we’ll see an acceleration of declines if EUR/USD drops below the lower border of the consolidation.
As you see, the situation developed in line with the above scenario and EUR/USD broke below the lower border of the consolidation. This is a negative signal, which in combination with sell signals generated by the indicators, suggests further declines and a drop to around 1.0708, where the size of the downward move will correspond to the height of the formation. Nevertheless, before we see such price action, currency bears will have to push the pair under the green support zone, which stopped further deterioration ten days ago.
Very short-term outlook: mixed with bearish bias
Short-term outlook: mixed
MT outlook: mixed
LT outlook: mixed
Trading position (short-term; our opinion): No positions are justified from the risk/reward perspective at the moment. However, if the pair drops under the green support zone we’ll consider re-opening short positions. We will keep you informed should anything change, or should we see a confirmation/invalidation of the above.
GBP/USD
On Tuesday, we wrote:
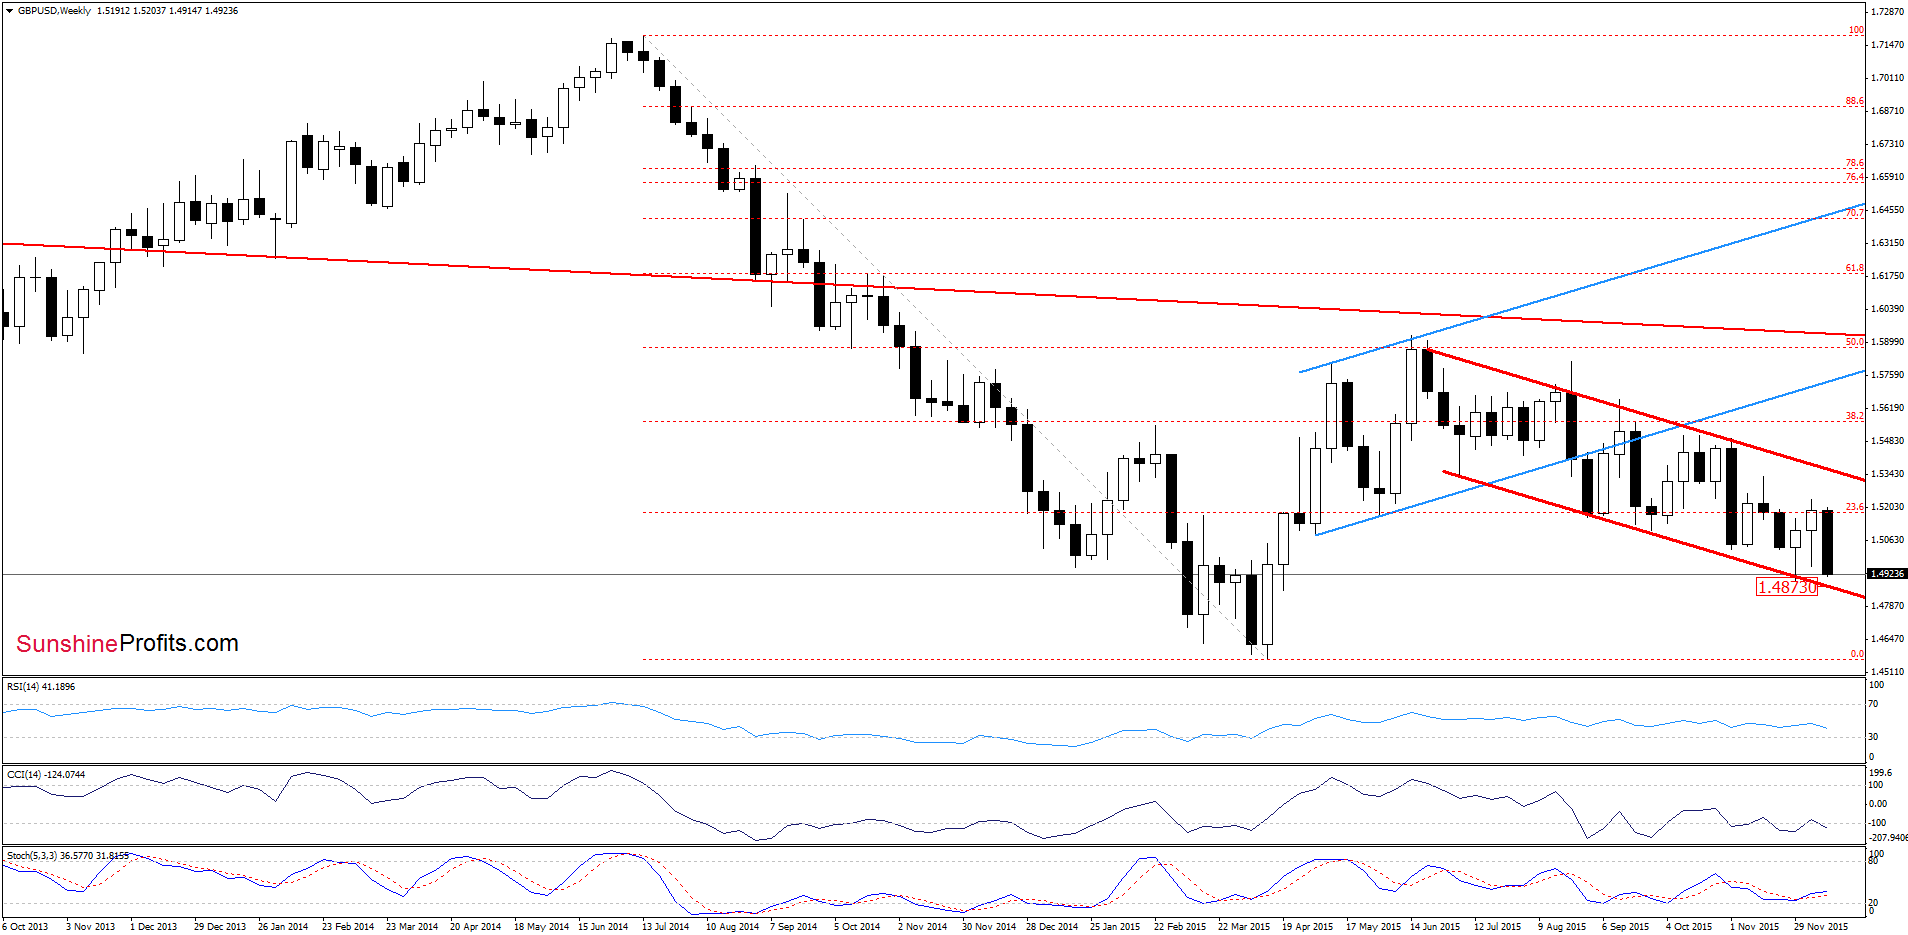
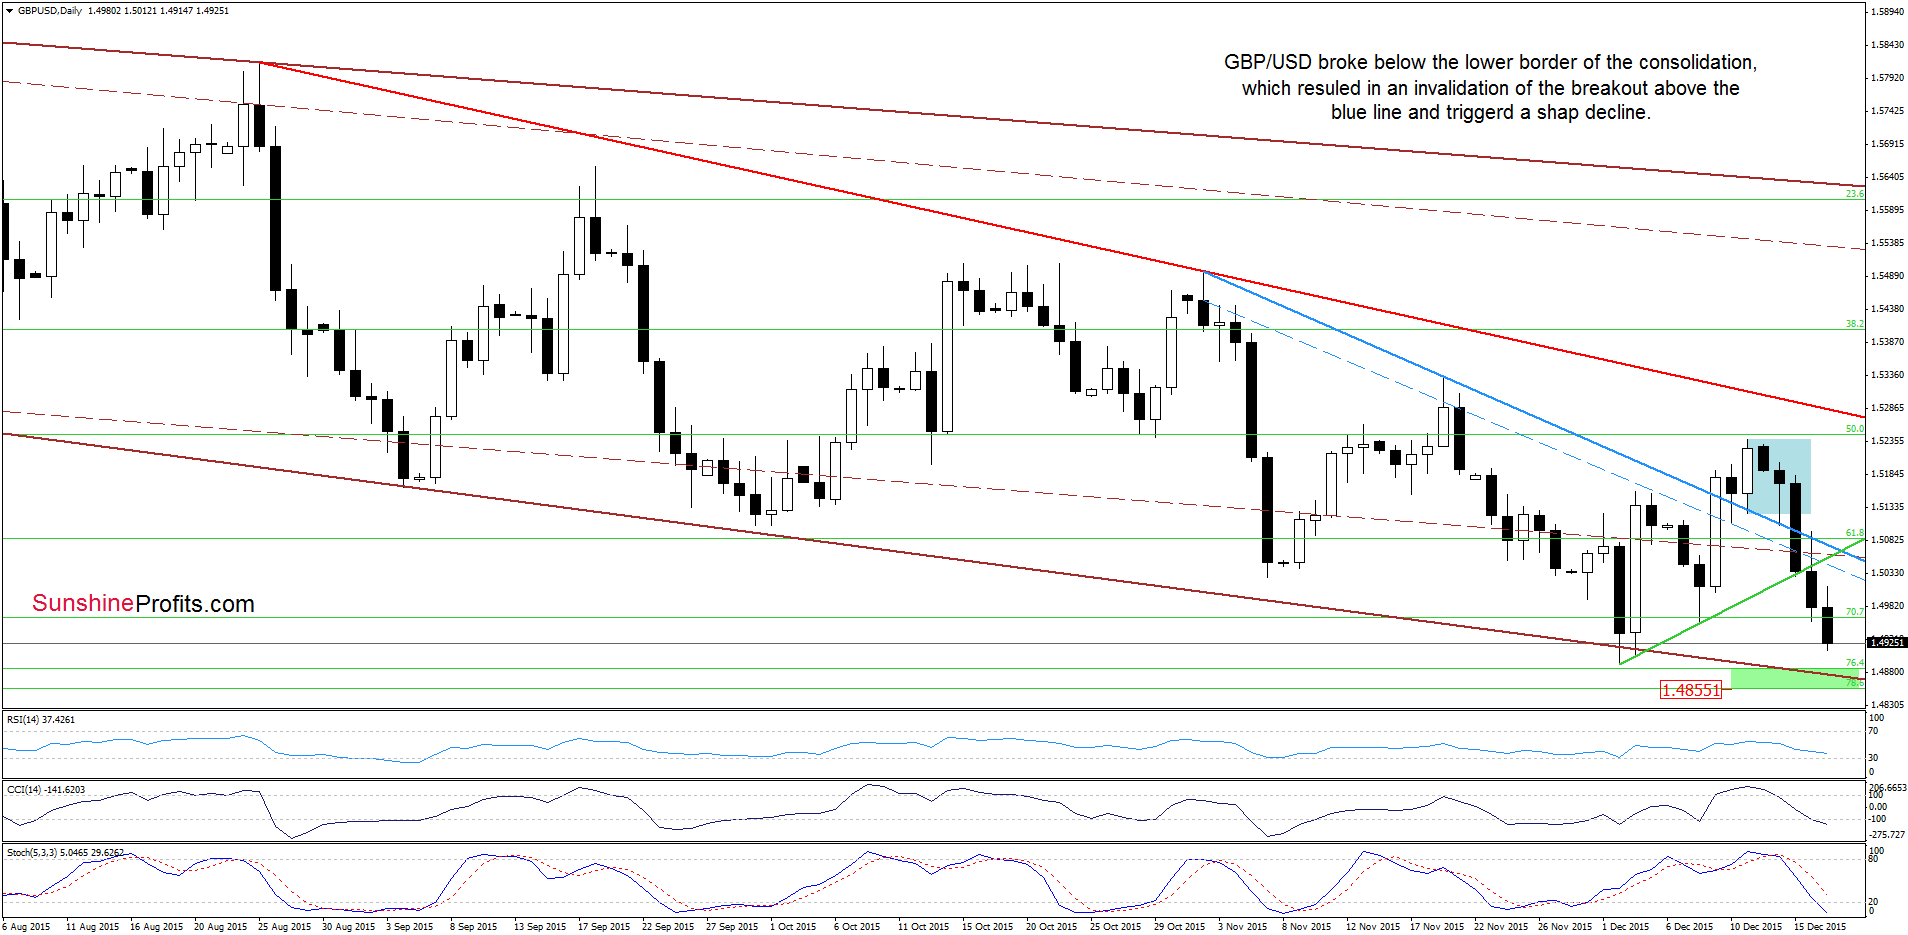
(…) as long as there is no breakout above the upper line of the formation (or a breakdown under the lower border) another sizable move is not likely to be seen. However, we should keep in mind that indicators generated sell signals, suggesting lower values of the exchange rate. If this is the case and the pair invalidates earlier breakout above the blue line, we’ll see a drop to the green support line (based on the previous lows) or even another test of the 70.7% Fibonacci retracement in the coming week.
From today’s point of view, we see that currency bears not only took the pair to our downside target, but also managed to push GBP/USD below it earlier today. This suggests that we’ll see further deterioration and a drop to the next downside target – the green support zone (created by the 76.4% and 78.6% Fibonacci retracements), which is currently reinforced by the lower border of the brown declining trend channel.
Very short-term outlook: mixed with bearish bias
Short-term outlook: mixed
MT outlook: mixed
LT outlook: mixed
Trading position (short-term; our opinion): No positions are justified from the risk/reward perspective at the moment. We will keep you informed should anything change, or should we see a confirmation/invalidation of the above.
USD/CAD
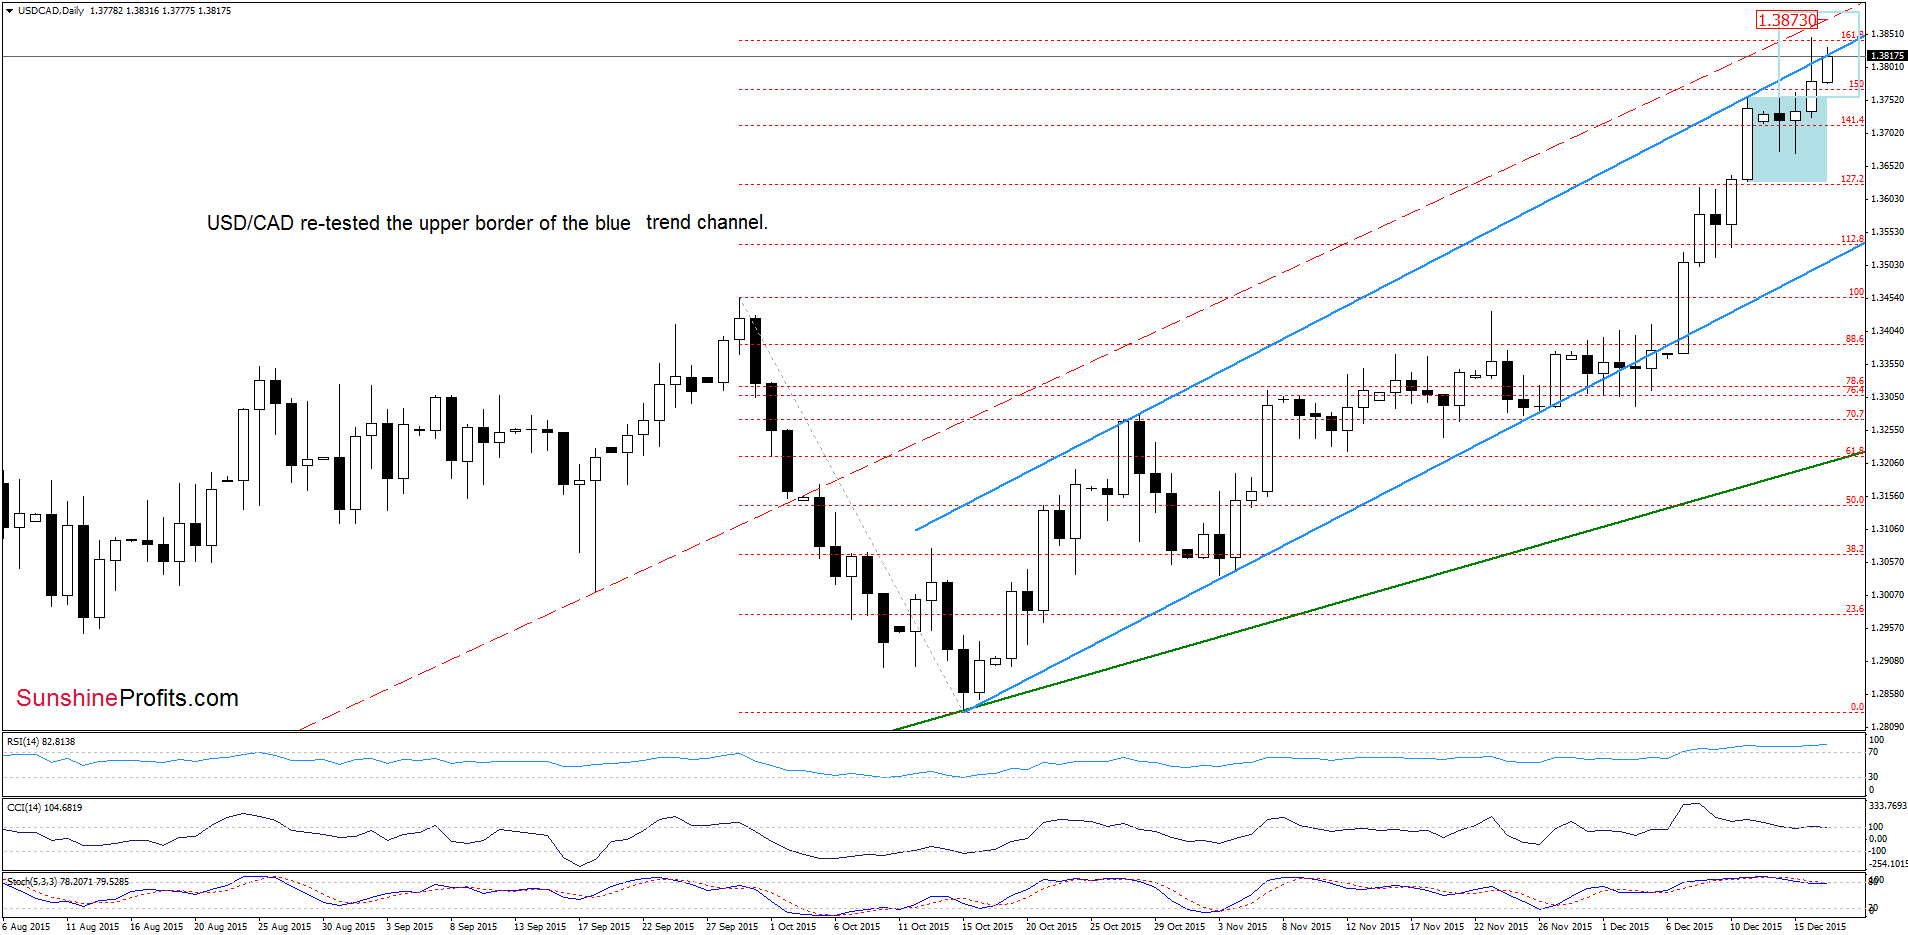
On the daily chart, we see that although USD/CAD gave back some gains in recent days, the proximity to the lower border of the consolidation encouraged currency bulls to act, which resulted in a breakout above the upper line of the formation. This is a positive signal, which suggests further improvement and an increase to around 1.3883, where the size of the move will correspond to the height of the consolidation.
Will we see further improvement? Let’s examine the long-term chart and look for more clues about future moves.
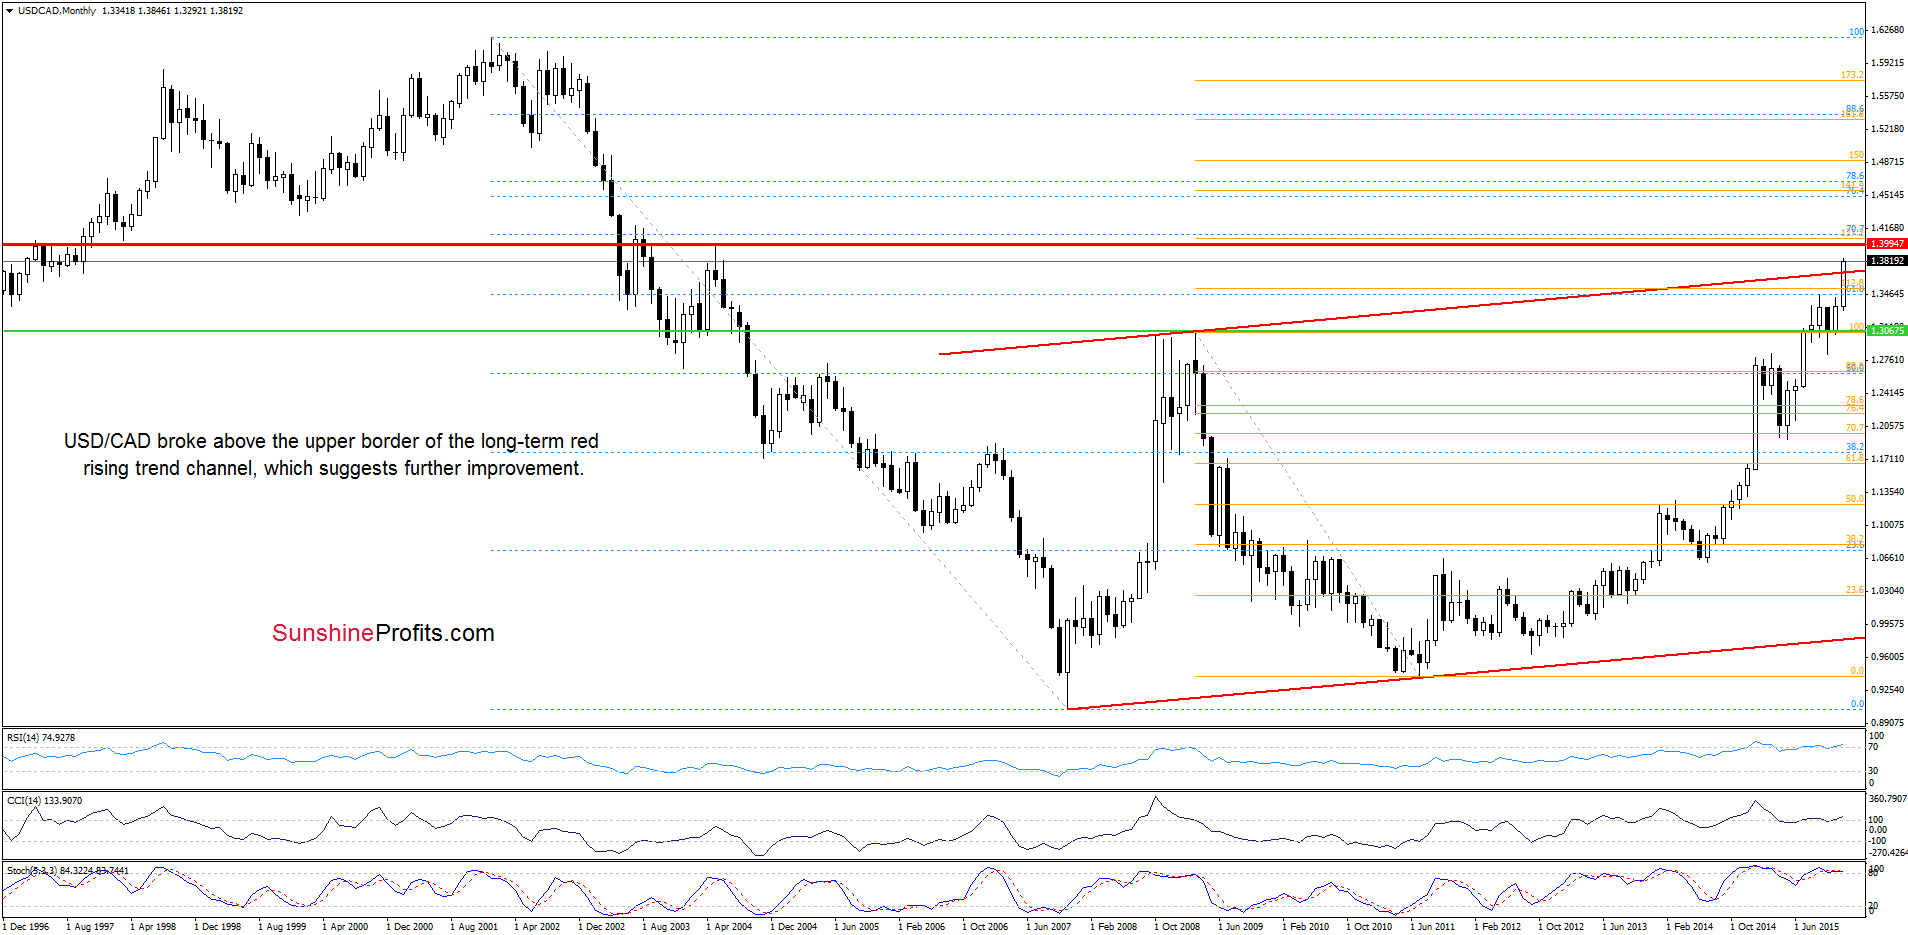
The first thing that catches the eye on the above chart is a breakout above the upper border of the red rising trend channel, which suggests further rally to around 1.3994, where the red horizontal resistance line (based on the May 2004 high) is.
Very short-term outlook: mixed with bullish bias
Short-term outlook: mixed with bullish bias
MT outlook: mixed
LT outlook: mixed
Trading position (short-term; our opinion): No positions are justified from the risk/reward perspective at the moment. We will keep you informed should anything change, or should we see a confirmation/invalidation of the above.
Thank you.
Nadia Simmons
Forex & Oil Trading Strategist
Przemyslaw Radomski, CFA
Founder, Editor-in-chief
Gold & Silver Trading Alerts
Forex Trading Alerts
Oil Investment Updates
Oil Trading Alerts
