

Based on the Oil Investment Update posted on Mar 5, 2015 4:25 PM
Looking at the chart of crude oil from today’s point of view, we can say that the first week of a new month was quite good for oil bulls. Although we saw a drop below the level of $49, the buyers didn’t give up and pushed the commodity to a weekly high of $52.40. And what did happen with the oil stocks at the same time? They dropped below the lower border of the rising trend channel and closed the supportive gap between the Feb 2 high and the Feb 3 low. Does it mean that they become weaker in relation to crude oil? How low could the XOI go? Before we try to answer these questions, let’s take a look at the NYSE Arca Oil Index (XOI) charts to find out what the current situation in the oil stock market is. Let’s start with a look at the monthly chart of the XOI (charts courtesy by http://stockcharts.com).
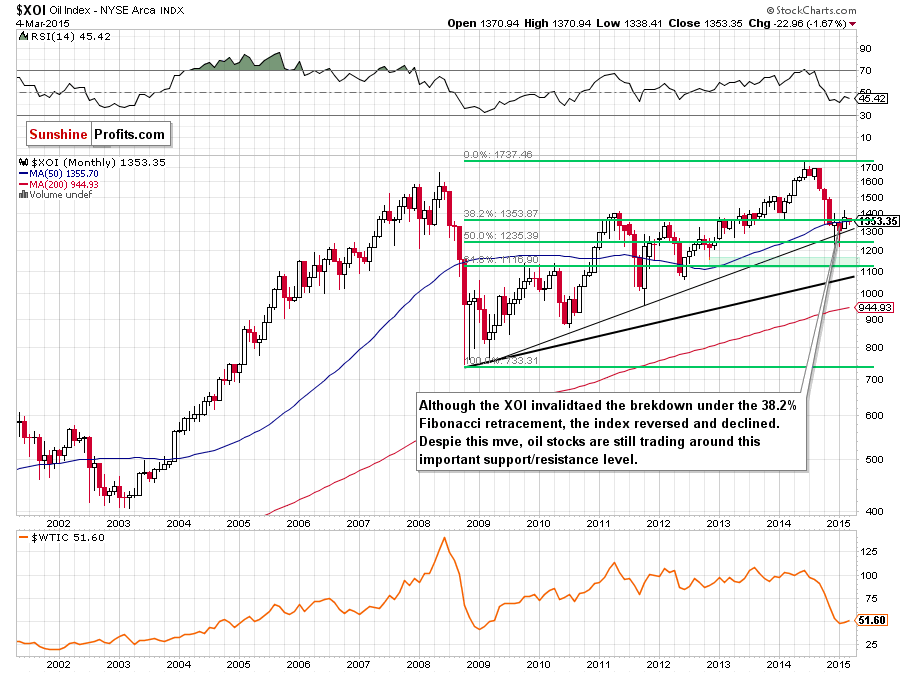
From the long-term perspective, we see that although the XOI invalidated the breakout above the 38.2% Fibonacci retracement (based on the entire 2008-2014 rally) and the 50-month moving average (which is a bearish signal), the index still remains above the previously-broken long-term support/resistance line (based on the Mar 2009 and Oct 2011 lows), which serves as the key support at the moment.
Will we see a test of the strength of this important support in the coming month? Let’s examine the weekly chart and find out.
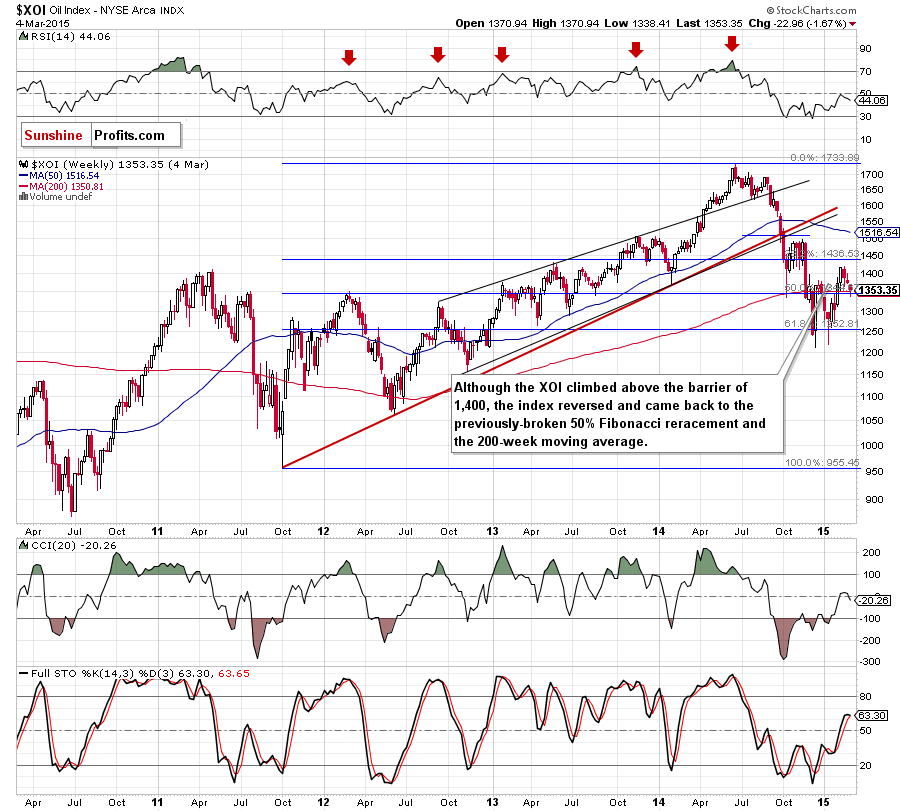
On the above chart, we see that although the XOI climbed above the barrier of 1,400, the index reversed and came back to the previously-broken 50% Fibonacci retracement level (based on the 2011-2014 increase) and the 200-week moving average. Yesterday, this support area was broken, which suggests that we’ll see further deterioration and the initial downside target for oil bears would be around 1,320, where the 50% Fibonacci retracement (based on the entire Jan-Feb rally) is. Nevertheless, if oil bulls fail there, the next support would be at 1,300, where the next psychologically important level is. Please note that the current position of the CCI and Stochastic Oscillator supports the above-mentioned scenario at the moment.
However, to have a more complete picture of the current situation in the XOI, let’s zoom in our picture and look for more clues about future moves on the daily chart.
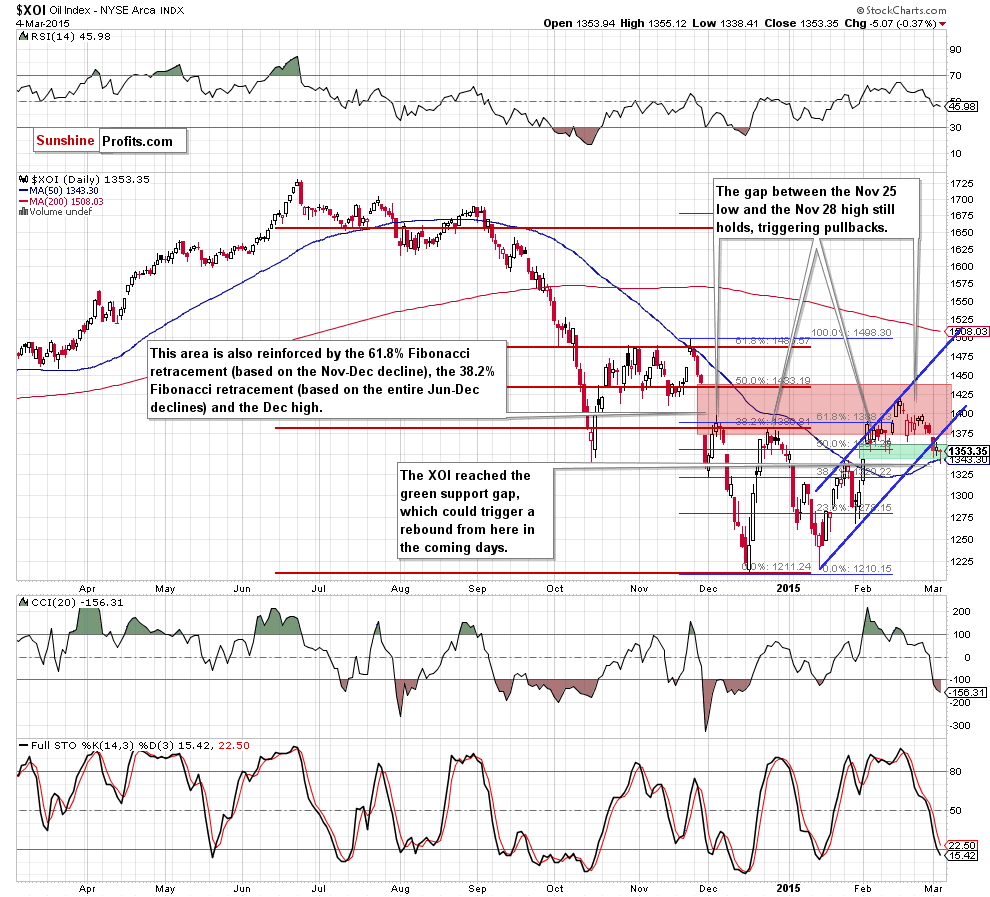
Looking at the above chart, we see that although the XOI moved higher in the previous month, the strong resistance zone created by the combination of the 38.2% Fibonacci retracement (based on the Jun-Oct decline), the 61.8% Fibonacci retracement (based on the Nov-Dec decline), and the Dec 3 high stopped further improvement once again. As a result oil stocks reversed and broke below the lower border of the rising trend channel, which is a negative signal that suggests further deterioration. Nevertheless, when we take a closer look at the above chart, we see that the recent decline took the XOI to the green support zone created by the gap (between Feb 2 high and Feb 3 low), the 38.2% Fibonacci retracement (based on the Jan-Feb rally) and the 50-day moving average.
Yesterday, oil stocks closed the day under these levels, which is a strong negative signal, which suggests further deterioration and a drop to the 50% (around 1,320) or even 61.8% Fibonacci retracement (around 1,295). At this point, it is worth noting that in this area the size of the downswing will correspond to the height of the rising trend channel, which could reduce the selling pressure. Taking into account the current position of the daily indicators (sell signals remain in place), it seems that this scenario will be n play in the coming days.
Summing up, oil stocks broke below the support zone created by the gap (between Feb 2 high and Feb 3 low), the 38.2% Fibonacci retracement (based on the Jan-Feb rally) and the 50-day moving average, which suggests further deterioration. Additionally, the current position of the daily and weekly indicators suggests that oil bears will show their claws once again and push the index to the initial downside target around 1,320, where the 50% Fibonacci retracement based on the Jan-Feb rally (and located slightly lower the previously-broken long-term support/resistance line based on the Mar 2009 and Oct 2011 lows) is.
Thank you.
Nadia Simmons
Forex & Oil Trading Strategist
Oil Investment Updates
Oil Trading Alerts
