

The euro is attempting a rebound. Will it last, does it have enough room to go higher? The British pound went higher yesterday and made us look for another opportunity down the road. And there are some worth mentioning today – please join us in examining the Japanese yen and Australian dollar.
- EUR/USD:none
- GBP/USD: none (the short position was closed automatically by a stop-loss order)
- USD/JPY: none
- USD/CAD: none
- USD/CHF: none
- AUD/USD: half of short positions (a stop-loss at 0.7228; the exit target at 0.7042)
EUR/USD
Yesterday, we wrote:
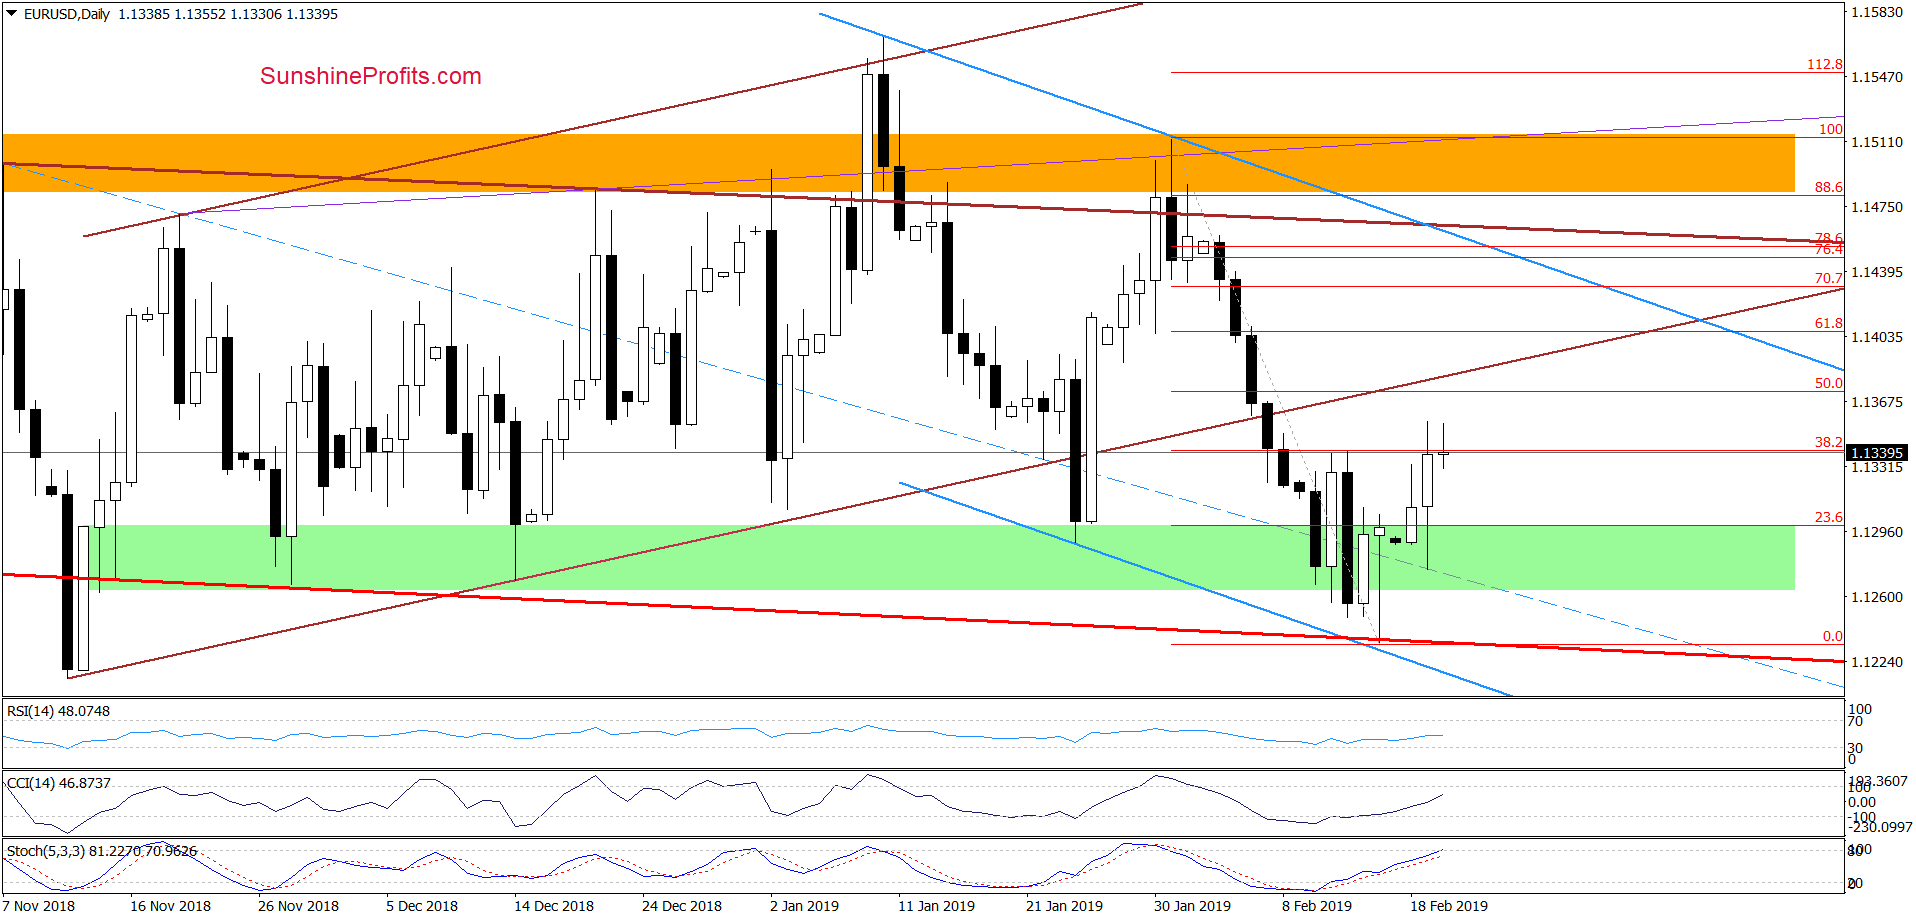
(…) Friday’s move created a candlestick with a long lower shadow, which shows heavy participation of currency bulls in the move. Yesterday, they built up on the gains and EUR/USD came back above the previously broken green zone. The daily indicators are not positioned negatively for such an upside move. Taking these into account, the pair could very well test the 38.2% Fibonacci retracement in the near future.
Our assumptions were validated by the market and EUR/USD indeed moved higher yesterday. The first upside target was reached. On a closing basis, the bulls gave up some of their gains and the pair closed just below the 38.2% Fibonacci retracement.
Earlier today, we saw a similar attempt to move higher. It was initially rebutted, but at the moment of writing these words, the pair is trading at around 1.1350. That’s slightly above the above the 38.2% Fibonacci retracement that was strong enough to stop the bulls in the previous week.
If the pair has still some juice left in to power through, we’ll pay close attention to the bulls’ strength. Their likely targets would be the 50% Fibonacci retracement followed by the previously broken lower border of the brown rising trend channel. If they fail, another retest of the major supports and latest lows will be in cards once again and thus we’ll consider reopening short positions.
Trading position (short-term; our opinion): No positions are justified from the risk/reward perspective. We will keep you informed should anything change, or should we see a confirmation/invalidation of the above.
USD/JPY
On Friday, we wrote that the pair:
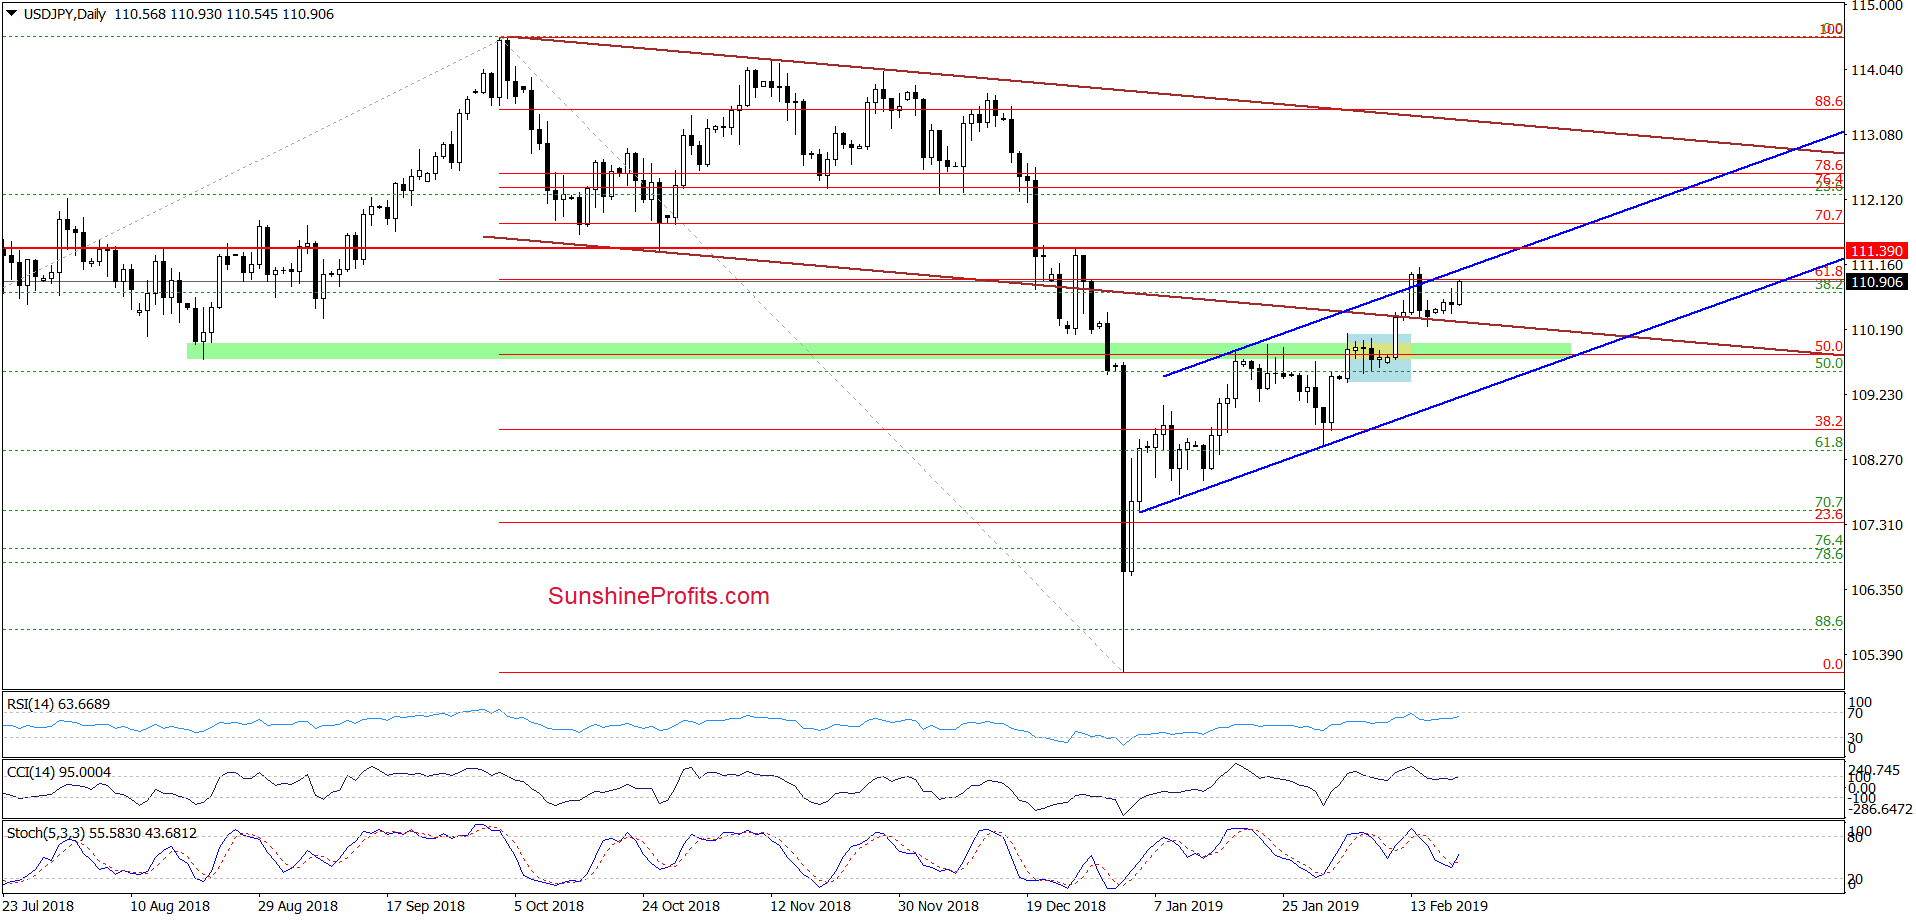
(…) invalidated the earlier breakout above the 61.8% Fibonacci retracement and the upper border of the blue rising trend channel, which is a bearish development. Additionally, all daily indicators generated sell signals, increasing the probability of further deterioration in the following days.
Nevertheless, a bigger move to the downside will be more likely and reliable if USD/JPY closes today or in the near future below the previously broken lower border of the brown declining trend channel.
Although currency bears tried to take USD/JPY below the lower border of the brown declining trend channel, they failed. This translated into an invalidation of the tiny breakdown below that brown line.
This positive price action triggered further improvement in the following days. It increases the likelihood that we’ll see a retest of the strength of the upper line of the blue rising trend channel in the very near future.
If the bulls show strength there and manage to break above that blue line and last week’s peaks, we’re likely to see a test of the red horizontal resistance line based on the late December high. However, if they show weakness again, the probability of a bigger move to the south (targeting at least a test of the lower line of the blue trend channel) will increase and we’ll consider opening short positions.
Trading position (short-term; our opinion): No positions are justified from the risk/reward perspective, but the decision to open short positions is potentially just around the corner. We will keep you informed should anything change, or should we see a confirmation/invalidation of the above.
AUD/USD
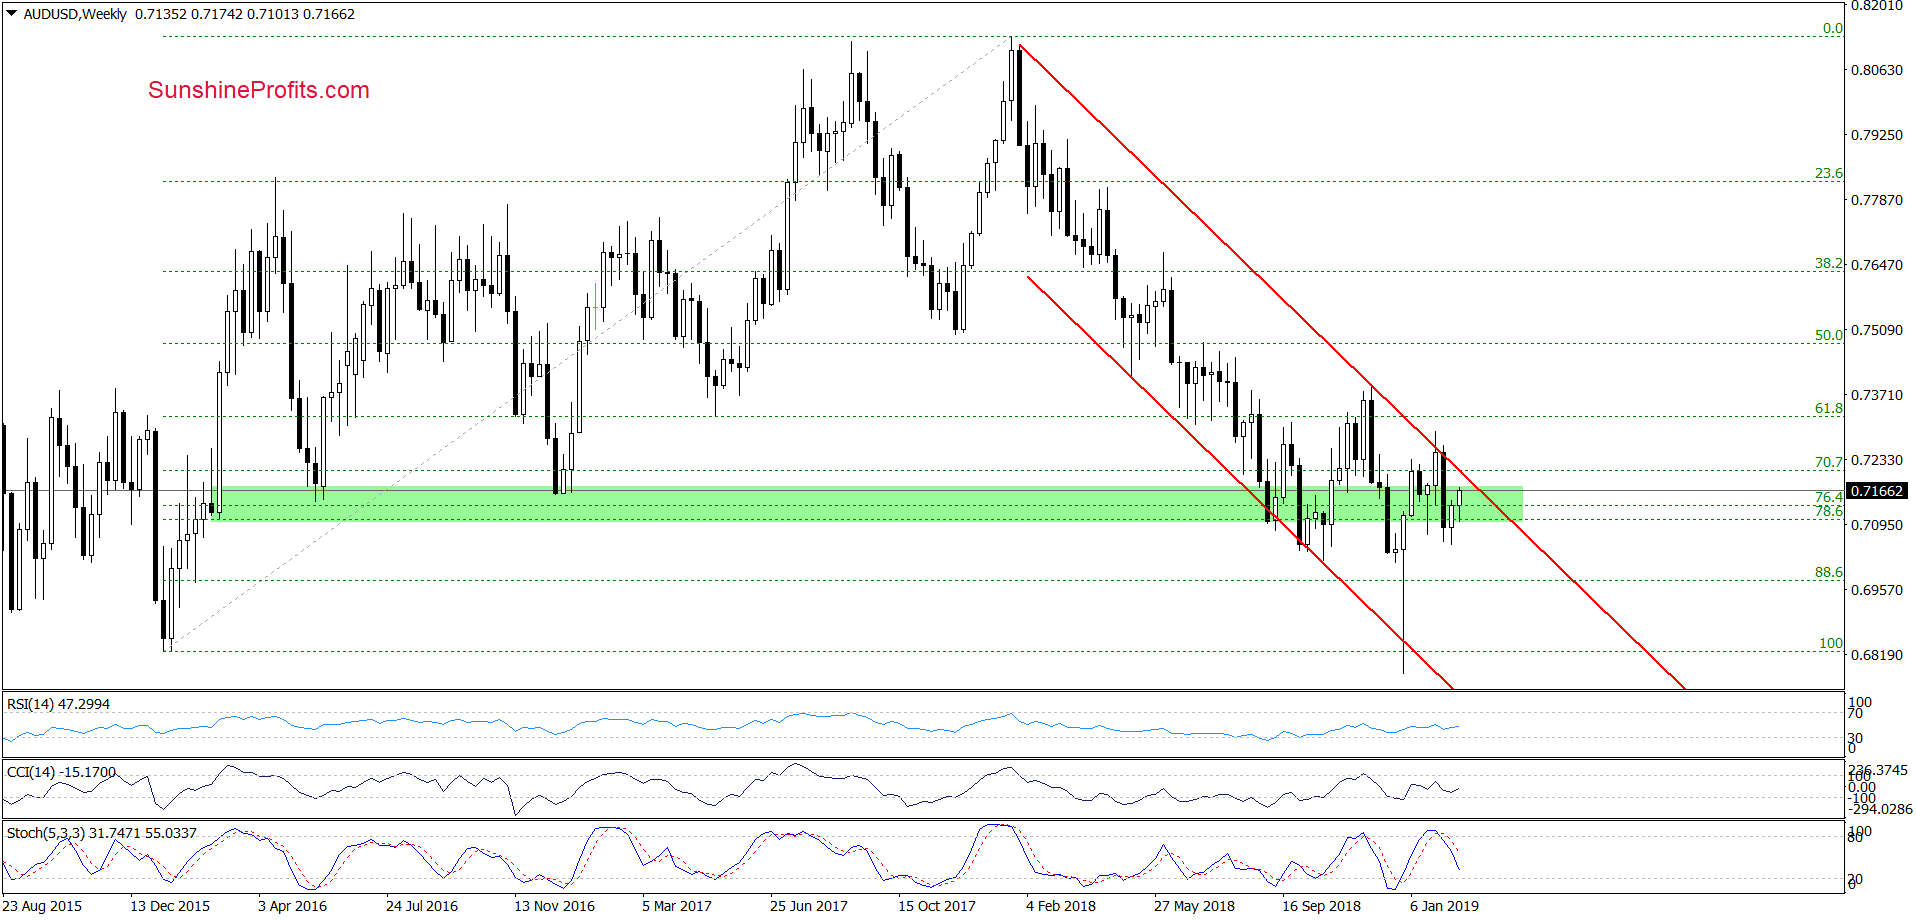
The most prominent feature of the weekly chart is the January invalidation of the tiny breakout above the upper border of the red declining trend channel. This triggered a sharp move to the downside and despite the improvement in the last two weeks, the pair still trades within the confines of the declining red trend channel.
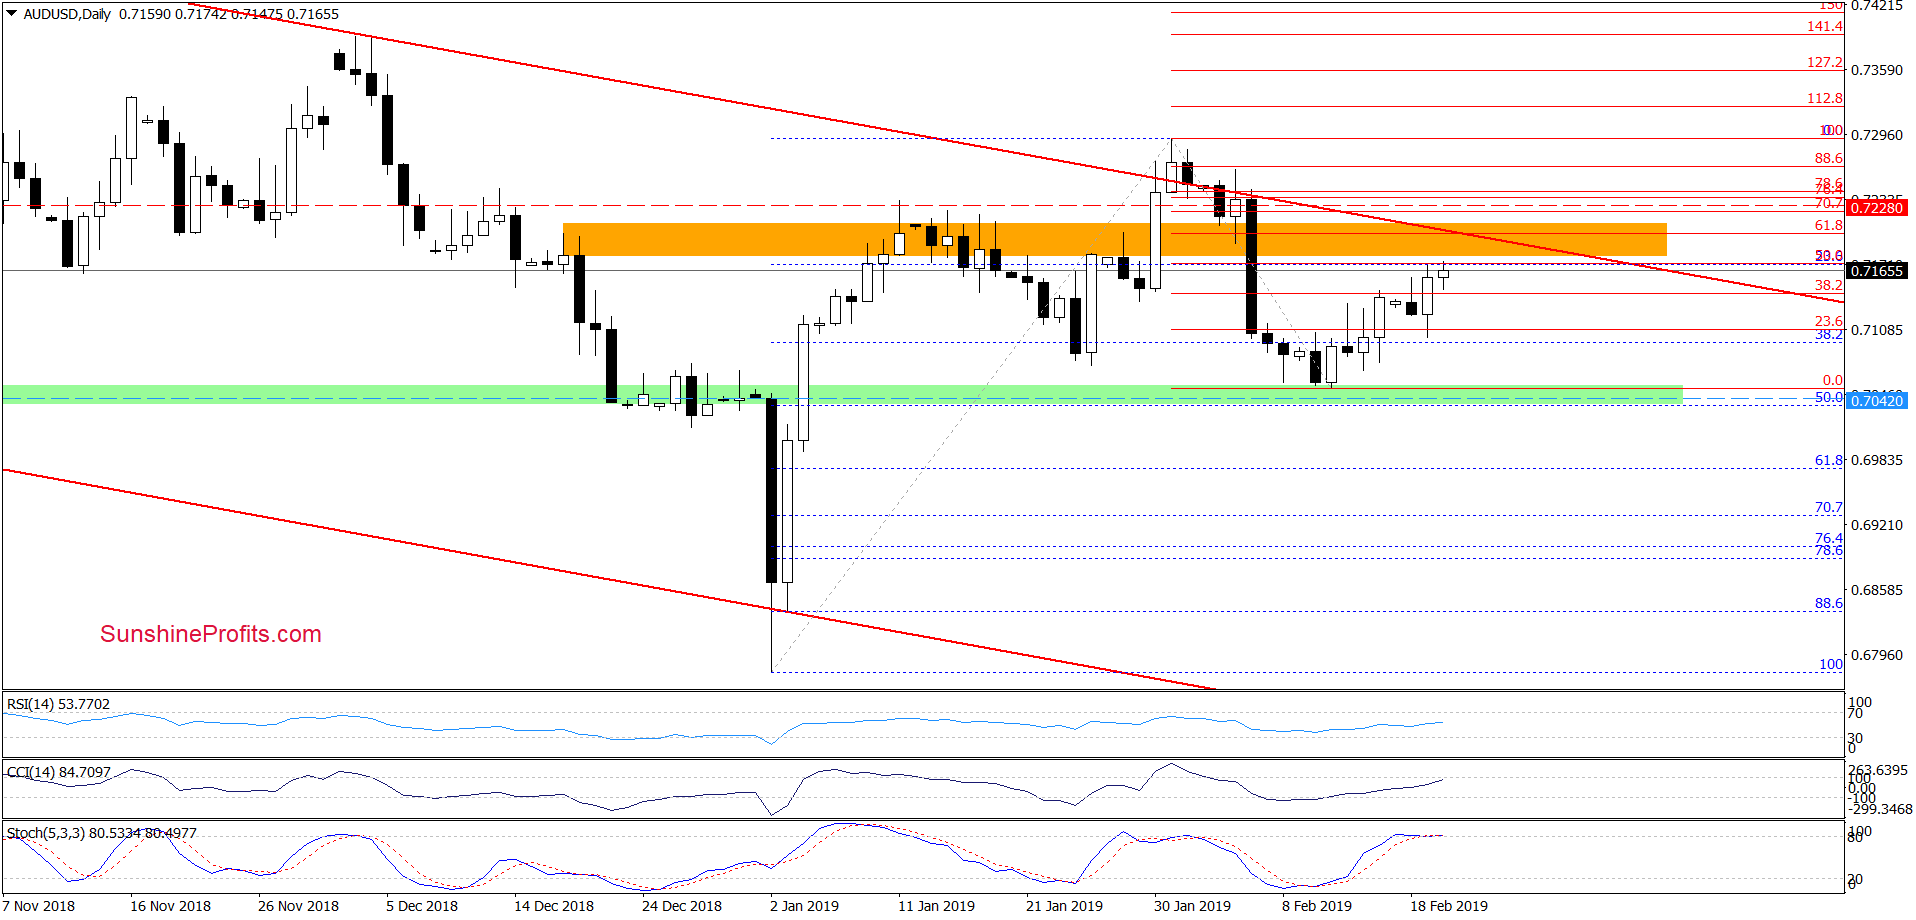
On the daily chart, we see AUD/USD attempting to build on yesterday’s gains. The exchange rate is still trading below the orange resistance zone and the upper border of the weekly chart’s red declining trend channel.
Additionally, the pair remains below the 50% Fibonacci retracement based on the entire February decline, which serves as an additional resistance level. On top of that, the Stochastic Oscillator is very close to generating a sell signal, which could give currency bears another reason to act.
If the situation develops in tune with the above assumption, AUD/USD will likely erase the recent upward move. Retest the green support zone or even slip to/below our exit downside target in the following day(s) wouldn’t surprise us in the least.
Trading position (short-term; our opinion): Half of profitable short positions (with a stop-loss order at our entry level at 0.7228 and the exit target at 0.7042) are justified from the risk/reward perspective.
Thank you.
Nadia Simmons
Forex & Oil Trading Strategist

