

After several days of relative hesitation, oil did finally moved through and closed below an important support level, making our position immediately profitable. Can the bulls however mount a strong enough response to invalidate the breakdown?
Meanwhile, the USD Index is sitting at its strong short-term resistance line. With many doubters of recent USD strength, what's the likelihood of the upcoming move higher being a lasting one?
As you've read in the previous Oil Trading Alerts and Forex Trading Alerts, Nadia Simmons, who is the author of these reports has not been feeling well. This remains to be the case, and as it's been several days since you received crude oil or forex analysis from us, I (PR here) would like to help.
Consequently, I will be writing analyses of both: crude oil and the forex market and I will publish them combined, so that those, who normally enjoy access to only one of these reports, will get something extra. That's not much of a positive surprise for those, who already have access to both Alerts (for instance through the All-Inclusive Package), so if you have access through this package or you subscribed to both products individually, I will provide you with something extra. I will analyze any company of your choice with regard to its individual technical situation, and I will send you this on-demand analysis over e-mail. If this applies to you, please contact us with the name of the company that you're interested in.
Having said that, let's take a look at the crude oil market. As indicated, charts courtesy of www.stockcharts.com and www.stooq.com
Crude Oil Analysis
In yesterday's analysis, we wrote the following:
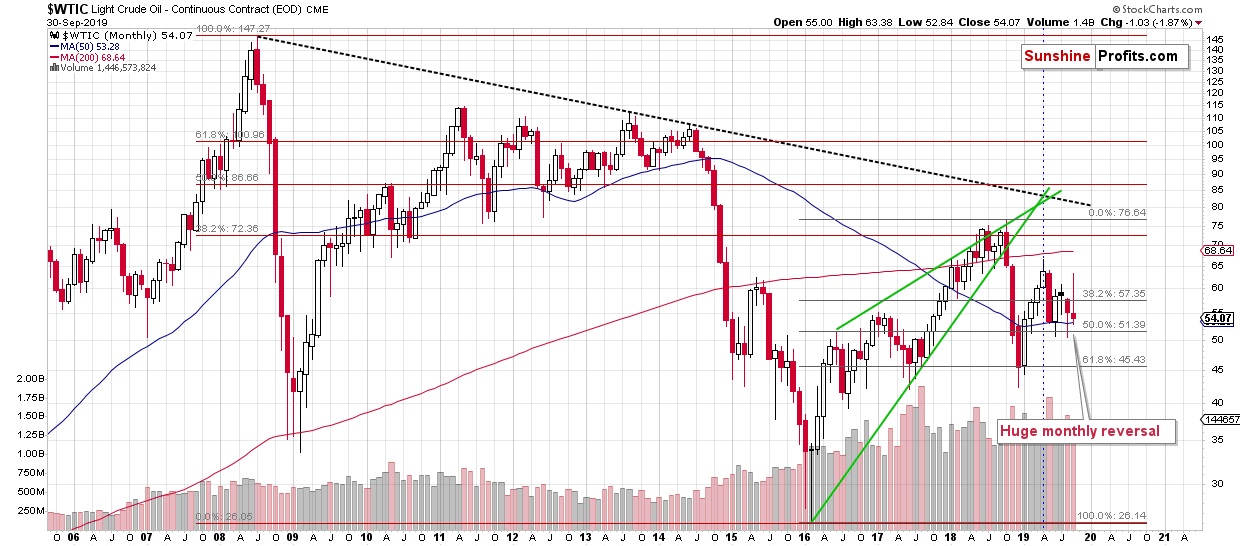
Crude oil just rallied this month and then reversed its course. As of yesterday's closing price, it was up by $0.81 in September. However, today's overnight decline took crude oil over 50 cents lower, which means that the small monthly gain has been almost entirely erased. Moreover, this creates a bearish reversal, which suggests lower crude oil values in the following months.
Let's not forget what caused crude oil to rally recently - it was an attack on the Saudi oil field. In other words, it was a geopolitical event, and such events usually have only temporary effect on prices.
As crude oil declined after we posted the above (and made our new short position immediately profitable), the earlier small monthly gain instantly turned into an almost 2% monthly decline. The reversal became even more apparent, and thus important.
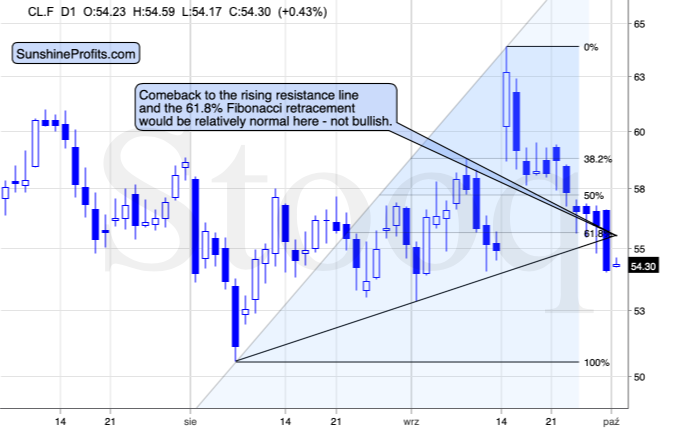
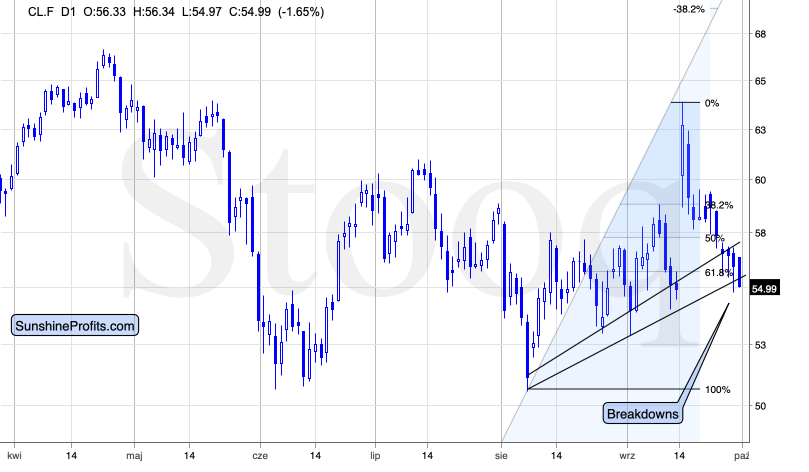
Black gold moved a bit higher earlier today, but it's a perfectly natural course of action. Crude oil just broke below two important support levels - the rising support line based on the August and September lows and below the 61.8 % Fibonacci retracement level.
Breakdowns and breakouts tend to be followed by verifications. It's a situation, in which the price moves back to the broken line or level to "check" if this move was just accidental. In practice, this means that some traders are betting on breakouts or (in this case) breakdown's invalidation as the latter tend to be immediately followed by strong moves in the opposite direction.
Now, until crude oil overcomes again the above-mentioned combination of resistance levels, the outlook will remain bearish. The monthly reversal strongly suggests that the breakdown will be confirmed and thereupon continued. In other words, our yesterday's comments on crude oil remain up-to-date.
In our view, the following short position is currently justified from the risk-reward point of view.
Trading position (short-term; our opinion): short position with a stop-loss order at $58.27 and the binding exit target at $53.05 is justified from the risk/reward perspective.
Forex Analysis
As far as the currency market is concerned, Nadia usually covers the individual currency pairs. However, that's not what I specialize in, so instead of the usual format of these analyses, I will maximize their usefulness and likely profitability. This means that instead of focusing on individual currency pairs, I will cover the USD Index, as that's what I've been following on a regular basis for years.
It's also tradable, as there are futures on it (DX symbol) as well as ETFs, for instance the UUP and the UDN. The key development that might distort the price movements will take place on Friday, so the market is likely to move according to its trend until that time. Friday's price movement might be a bit more chaotic, though.
And which way is the current trend pointing?
In the same direction as yesterday.
Up.
Our yesterday's comments remain up-to-date:
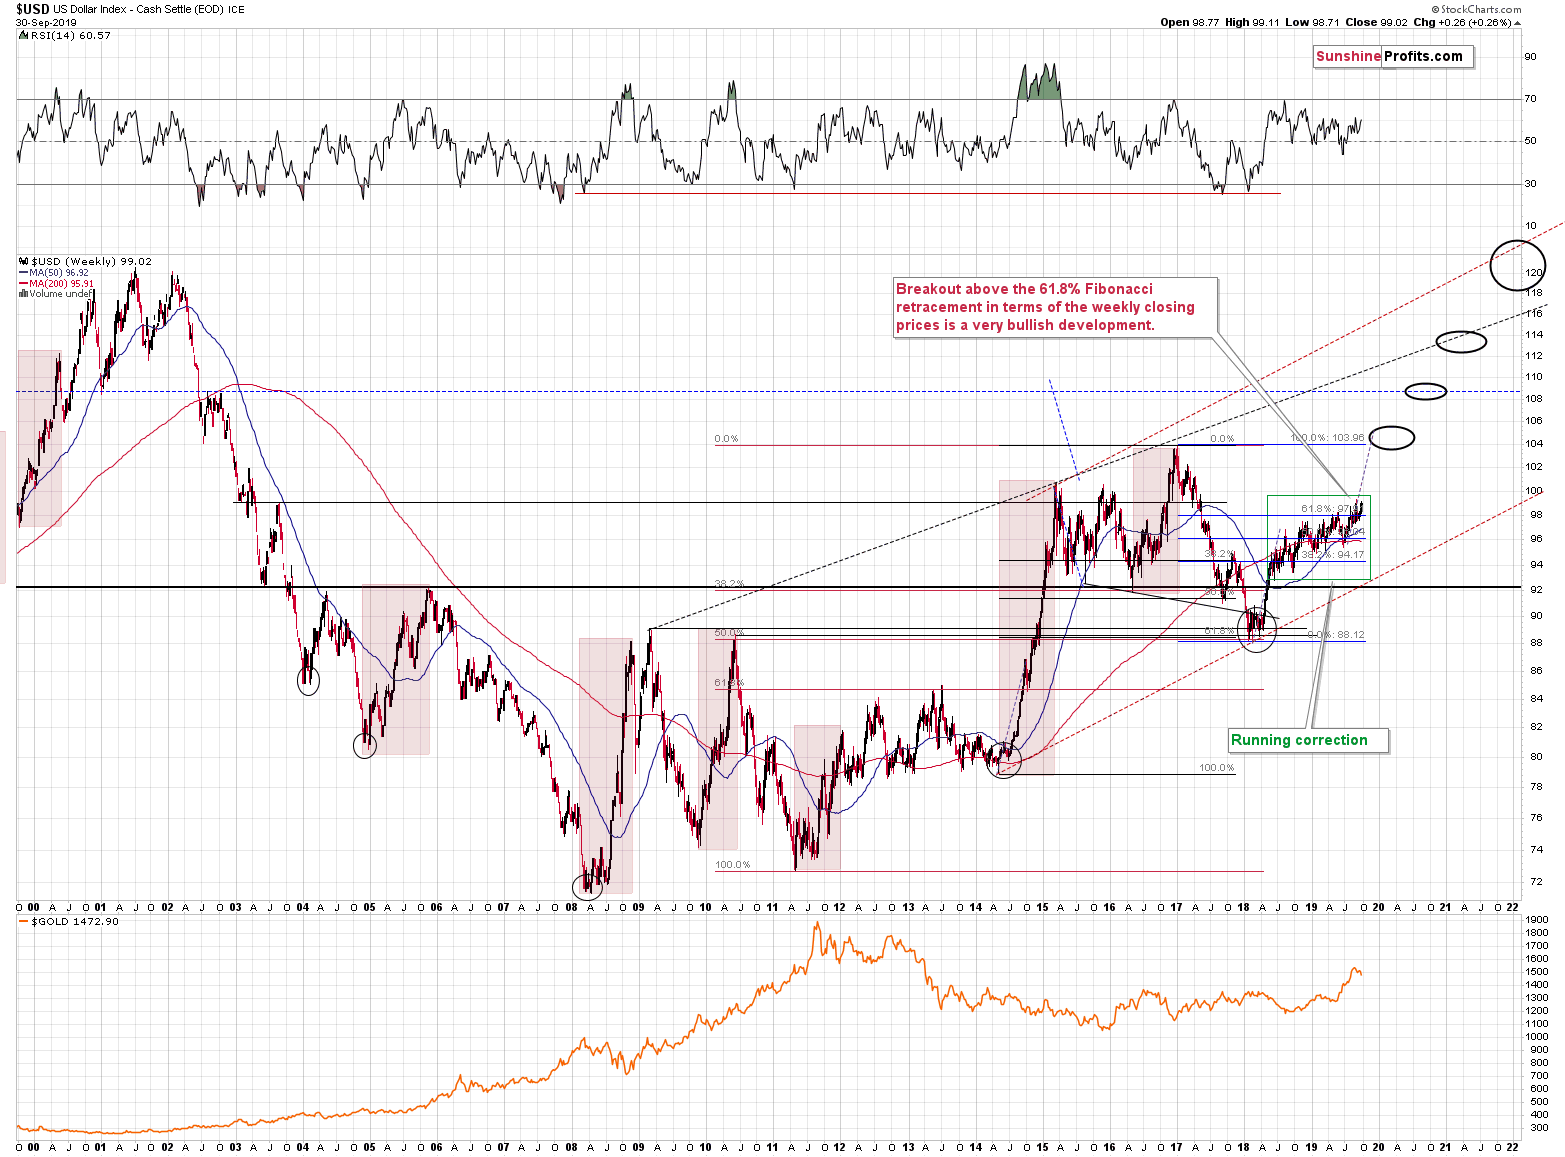
The long-term trend is up as even the dovish U-turn by the Fed, rate cuts, and myriads of calls from President Trump for lower U.S. dollar and much lower (even negative) interest rates, were not able to trigger any serious decline.
What we saw instead was a running correction that's the most bullish kind of corrections. It's the one in which the price continues to rally, only at significantly smaller pace.
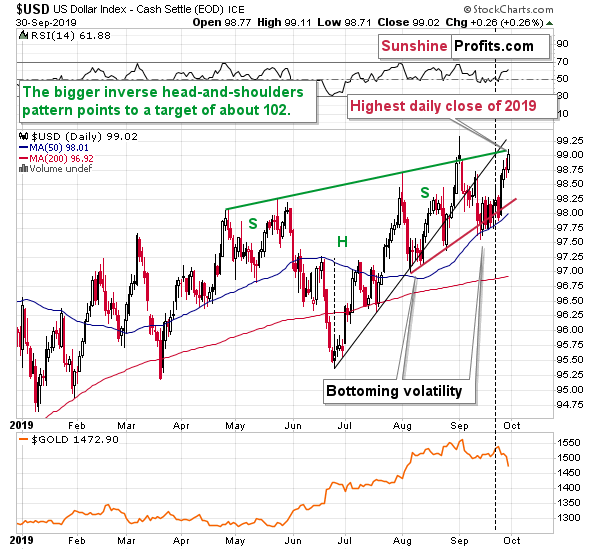
On a short-term basis, we see that the USD Index is about to try to break above the previous 2019 high and at the same time to rally above the rising green resistance line.
This line is no ordinary resistance. It's the neck level of the bullish inverse head-and-shoulders pattern, which means that once the breakout is complete and verified, the USD Index is likely to soar substantially higher. The likely target is about 102 or higher - more than 3 index points above the current price.
The USD Index rallied yesterday and moved right to the above-mentioned rising green resistance line. It was the highest daily close of 2019, but there was no breakout above the green line.
All previous breakouts to new 2019 highs were followed by more declines, so it's only natural to be skeptical toward USD's breakout right now. The long-term chart though very strongly indicates that another powerful wave up is on the horizon. The same goes for the very long-term chart.
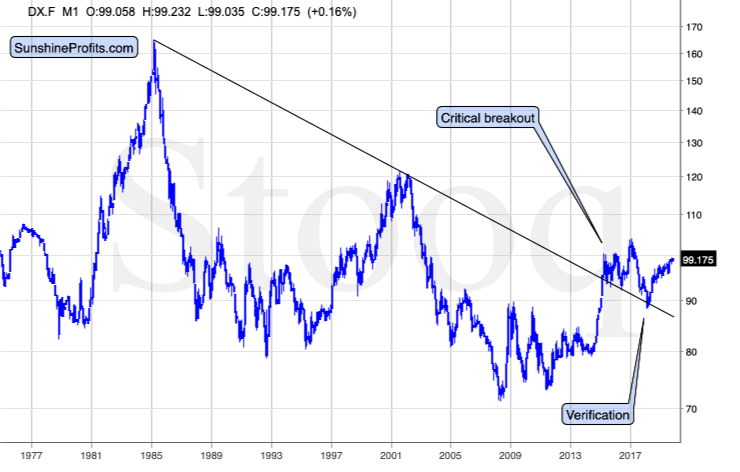
The USD Index is after a major breakout and this breakout was already verified a few times. The most recent rally is just the very early part of the post-breakout rally. Much higher USD Index values are likely to follow in the upcoming months.
For now, however, we still have to consider the possibility that the green resistance line will keep the rally in check for a while. Our yesterday's comments about it remain intact:
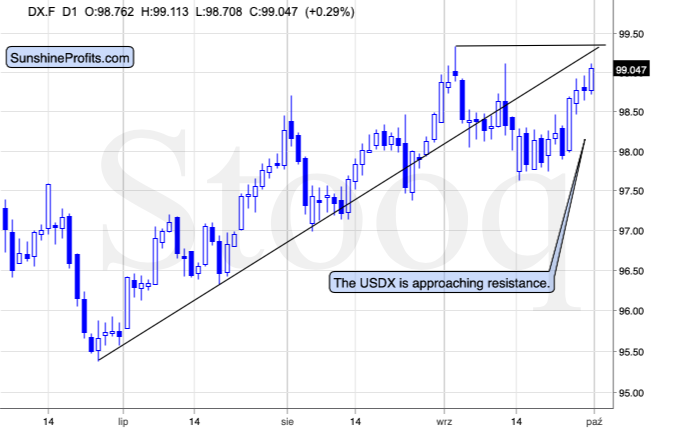
Even though the outlook is bullish for long- and medium term, this resistance might trigger yet another corrective downswing before the big rally follows. Is it likely? We'd say that a breakout is a quite likely scenario, but it's prudent to actually wait for it to happen before opening a trading position.
So, we are prepared to take advantage of higher USD Index values, but at this time, it seems best not to open a new position right away. Instead, it's advisable to keep one's eyes open for a bullish confirmation and then - once we see it - quickly enter a long position in the USD Index.
In short, the outlook for the USD Index is very bullish, but the risk to reward ratio doesn't favor a new trading position right now - the risk is too big given the proximity of the resistance levels.
Trading position (short-term; our opinion): no position in the USD Index is currently justified from the risk/reward perspective. We will likely enter a new long position soon.
From Our Readers' Mailbag
Finally, we received a request to comment on the natural gas prices, so we will do so right away.
We have two things to say about the natgas.
One thing is that this market is not easy to analyze using the techniques that we've developed for the precious metals, crude oil, and currency markets. It's trading in a rather chaotic way with very much varying volatility. There are times, when there are very short-term and calm trends that make the price appear predictable (for instance in 2004), but then there are periods where the price shoots up or down profoundly. There are little common features to help identifying what type of market we have right now and there are little to no signs preceding a market character change. The huge upswings and downswings are not very similar, so one can't even base the size of the move while looking at other moves.
We don't want to say that we don't like the natgas as a commodity. However, we do want to say that we don't like it from the analytical point of view. Not because the outlook is bearish (which most likely is the case, by the way), but because there are very few techniques that appear to be consistently useful.
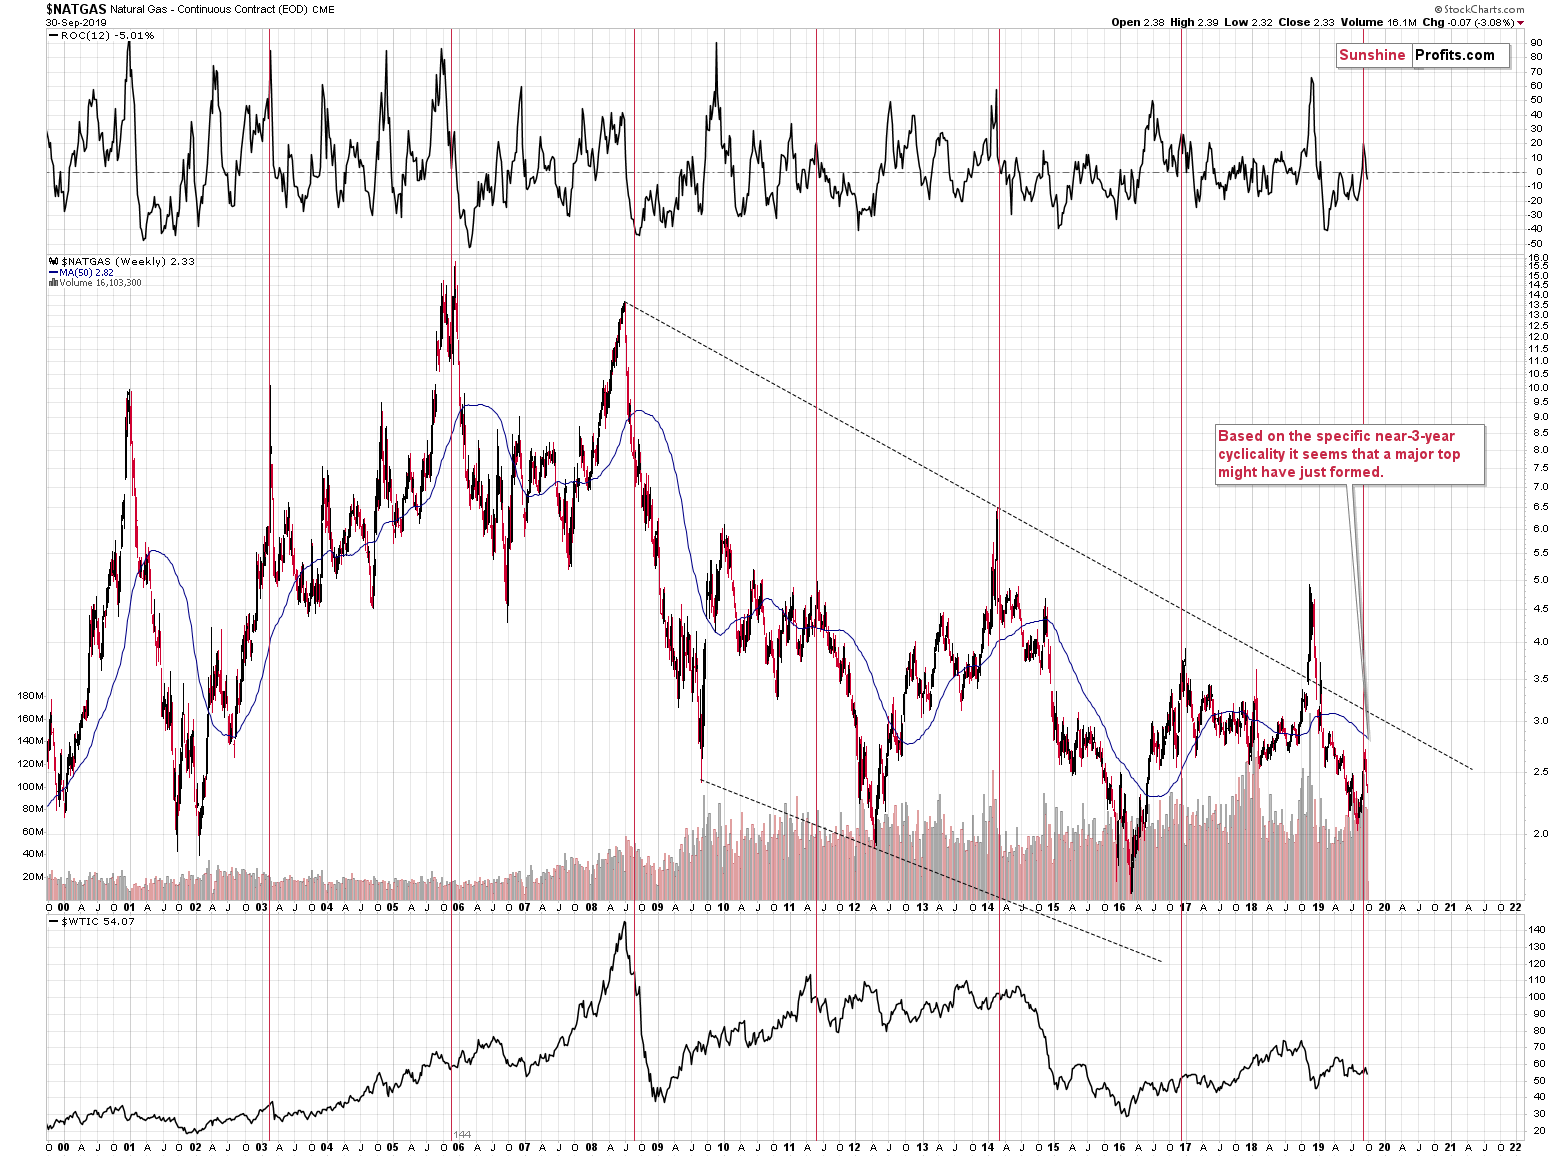
The second thing that we have to say about this market is that even though it is relatively unpredictable, we can still say something about the outlook. For the past several years, we've been seeing lower highs and lower lows (the trendlines based on them don't work, though). This means that the market is in a downtrend. The only interesting and somewhat reliable thing on this market is the cyclical tendency of natgas to form tops about every 3 years. We marked these cycles with red. Each of the past 6 cases were followed by big declines. The thing is that we saw this kind of cyclical turnaround recently and the price has been declining since that time. Based on the size of the declines that followed similar tops, it appears that we're going to see much lower natgas values in the following weeks.
Still, these are only two techniques that point to the same outcome and that's not much. We can't say that the probability of the decline is very high, but we view it as higher than 50% (about 60% or so). We are much more convinced about the upcoming slide in the precious metals market than we are about the decline in the natural gas prices.
As always, we will keep you - our subscribers - informed.
Thank you.
Sincerely,
Przemyslaw Radomski, CFA
Editor-in-chief, Gold & Silver Fund Manager

