

The USD Index continues its short-term consolidation. This back-and-forth trading is marked by tightening volatility and heralds an upcoming move. When is that most likely to come and what do the charts tell us about the days ahead for the USD?
Meanwhile in oil, yesterday's session marks a short-term key development. Considering the shape of yesterday's candle, it might not appear as a milestone but it's one nonetheless. Let's see the charts to find out how it'll impact our profitable open position.
As you've read in the previous Oil Trading Alerts and Forex Trading Alerts, Nadia Simmons, who is the author of these reports has not been feeling well. This remains to be the case, and as it's been several days since you received crude oil or forex analysis from us, I (PR here) would like to help.
Consequently, I will be writing analyses of both: crude oil and the forex market and I will publish them combined, so that those, who normally enjoy access to only one of these reports, will get something extra. That's not much of a positive surprise for those, who already have access to both Alerts (for instance through the All-Inclusive Package), so if you have access through this package or you subscribed to both products individually, I will provide you with something extra. I will analyze any company of your choice with regard to its individual technical situation, and I will send you this on-demand analysis over e-mail. If this applies to you, please contact us with the name of the company that you're interested in.
Having said that, let's take a look at the crude oil market.
Crude Oil Analysis
Today's analysis is going to be short as practically nothing changed with regard to the crude oil outlook, and the only thing that actually changed, confirmed the bullish case for the next several days. In other words, the profits on the long positions are likely to grow further before we close it.
Let's take a closer look.
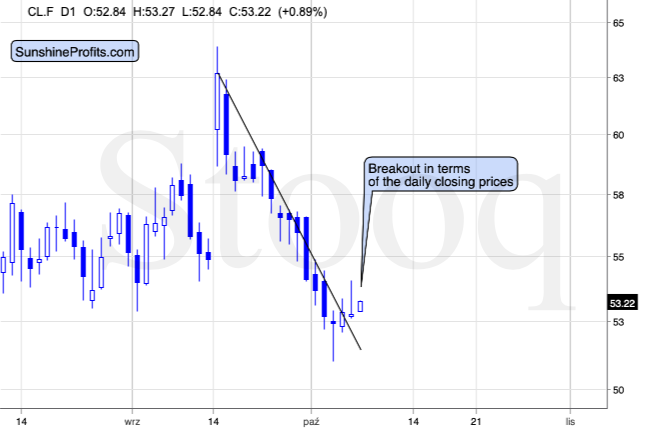
At the moment of writing these words, crude oil is well above our entry price of $51.72. The key development is that it's also above the declining resistance line that is based on the previous closing prices. On Friday, crude oil closed right at this line, which was the first session when crude oil managed to move to this line after a daily rally. All the other sessions since mid-September were characterized by intraday declines.
Yesterday, crude oil finally managed to close above this declining resistance line, which means a short-term breakout and a confirmation of the bullish case. The shape of yesterday's session might appear bearish as crude oil reversed before the end of the session, but yesterday's breakout appears to be more important. Crude oil might test the breakout above the resistance line by declining a bit, but overall the upside potential for this trade remains intact. Our previous comments on crude oil's medium-term chart remain up-to-date as well:
Our upside target of about $56 remains intact - it's based on the 38.2% Fibonacci retracement level and the likelihood of a rebound to the previously broken support line. This line is visible on the below medium-term chart.
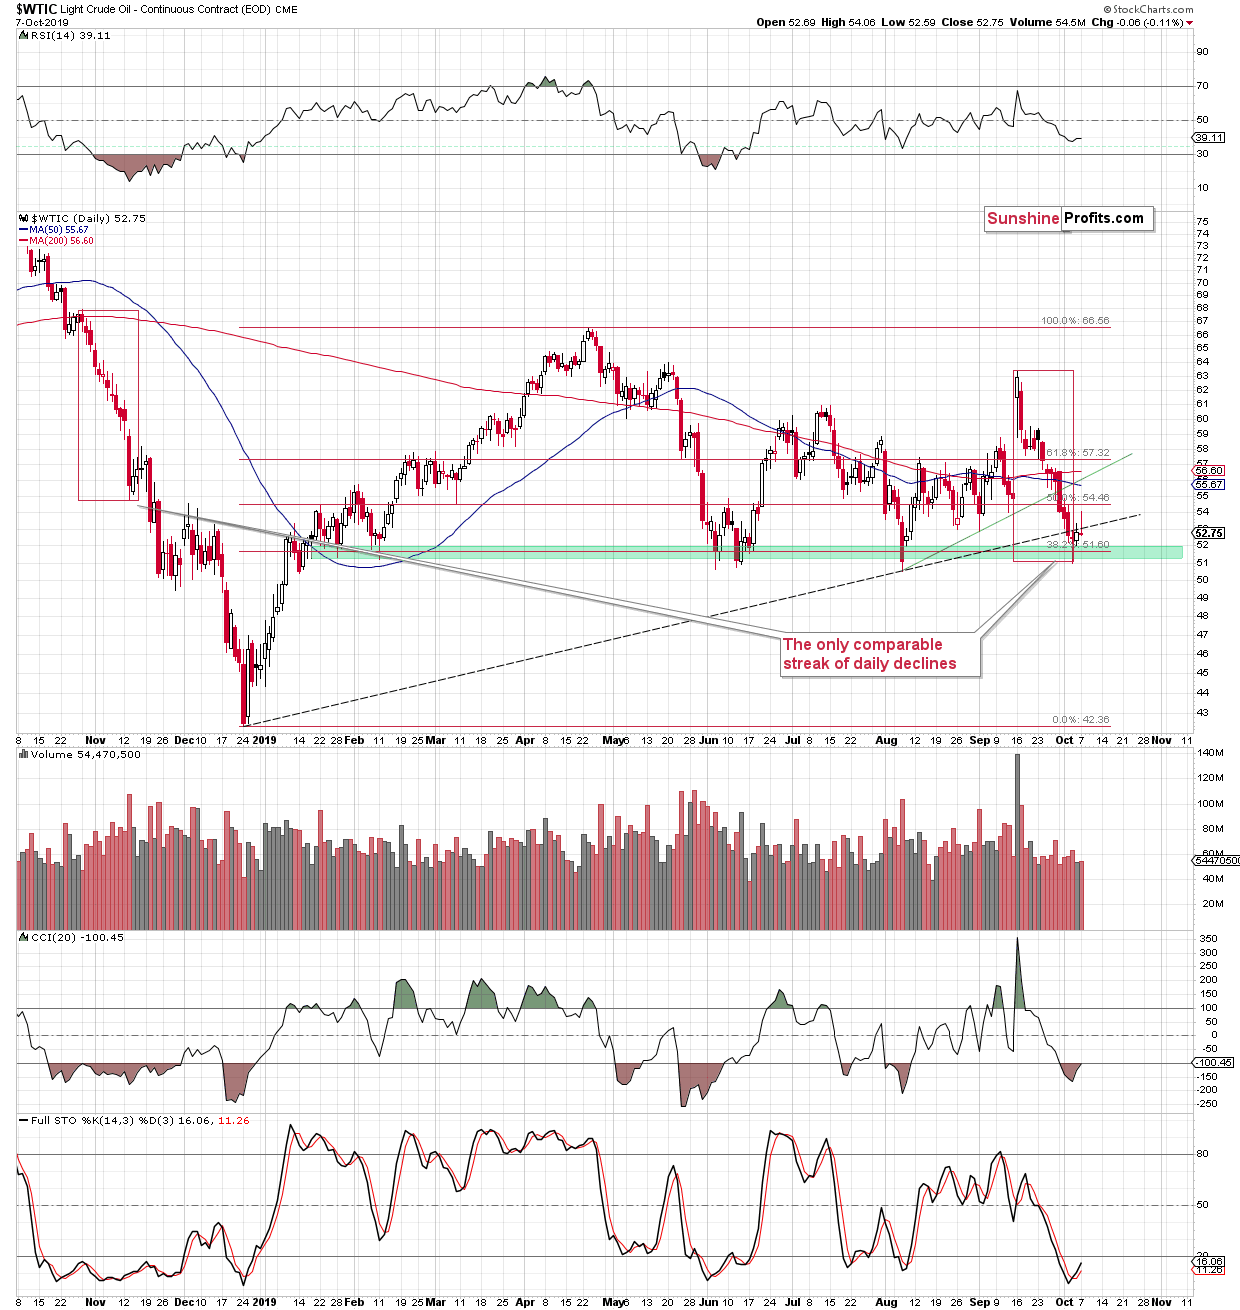
The rising green line is very close to the $56 level. That's above the 50-day moving average, but let's keep in mind that this moving average has rarely stopped the previous rallies. Instead, it was usually insignificantly broken to the upside before the short-term rallies ended. We saw that multiple times in August.
The buy signal from the Stochastic indicator is now clear and thus we expect more traders to join the long side, contributing to higher crude oil prices in the near term.
Consequently, in our view, the current long position is justified from the risk-reward point of view.
Trading position: Long position in crude oil with a stop-loss order at $49.88 and the binding profit-take target at $55.88 is justified from the risk/reward perspective.
Forex Analysis
As far as the currency market is concerned, Nadia usually covers the individual currency pairs. However, that's not what I specialize in, so instead of the usual format of these analyses, I will maximize their usefulness and likely profitability. This means that instead of focusing on individual currency pairs, I will cover the USD Index, as that's what I've been following on a regular basis for years.
It's also tradable, as there are futures on it (DX symbol) as well as ETFs, for instance the UUP and the UDN.
In short, nothing really changed in the USD Index based on yesterday's price movement so everything that we wrote in the previous Alert, remains up-to-date. We will provide you with a more detailed update nonetheless.
Let's start with the short-term USDX chart, as that's the only place where we can see any changes.
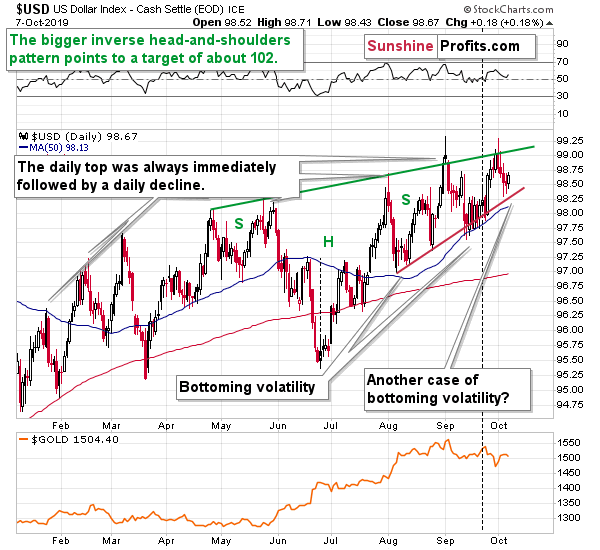
The USD Index is declining, but it didn't reach the nearby support levels: the rising red support line or the 50-day moving average. This means that lower USD values could still be seen before another rally takes place. The downside is too limited for us to be opening a short position, considering especially that it's against the major trend.
The USD Index is moving a bit lower today, which means that the current price action is relatively similar to what we saw in the middle of September and early in August. It's quite likely that the back and forth movement will end with a rally, but it doesn't mean that the rally is already underway. The USD Index rally is likely to start relatively soon, but not necessarily right away. A few days of back and forth trading here appear quite likely.
All in all, there was not much action in the currency market recently, but it seems that it's better to simply wait out the unclear times while sitting on profits from the previous trade. The next trade will likely be a bet on higher USDX values and it's likely that we will enter it within a few short days.
Why are we focusing on the long positions in the USD Index? Because of the long-term trend, which remains up.
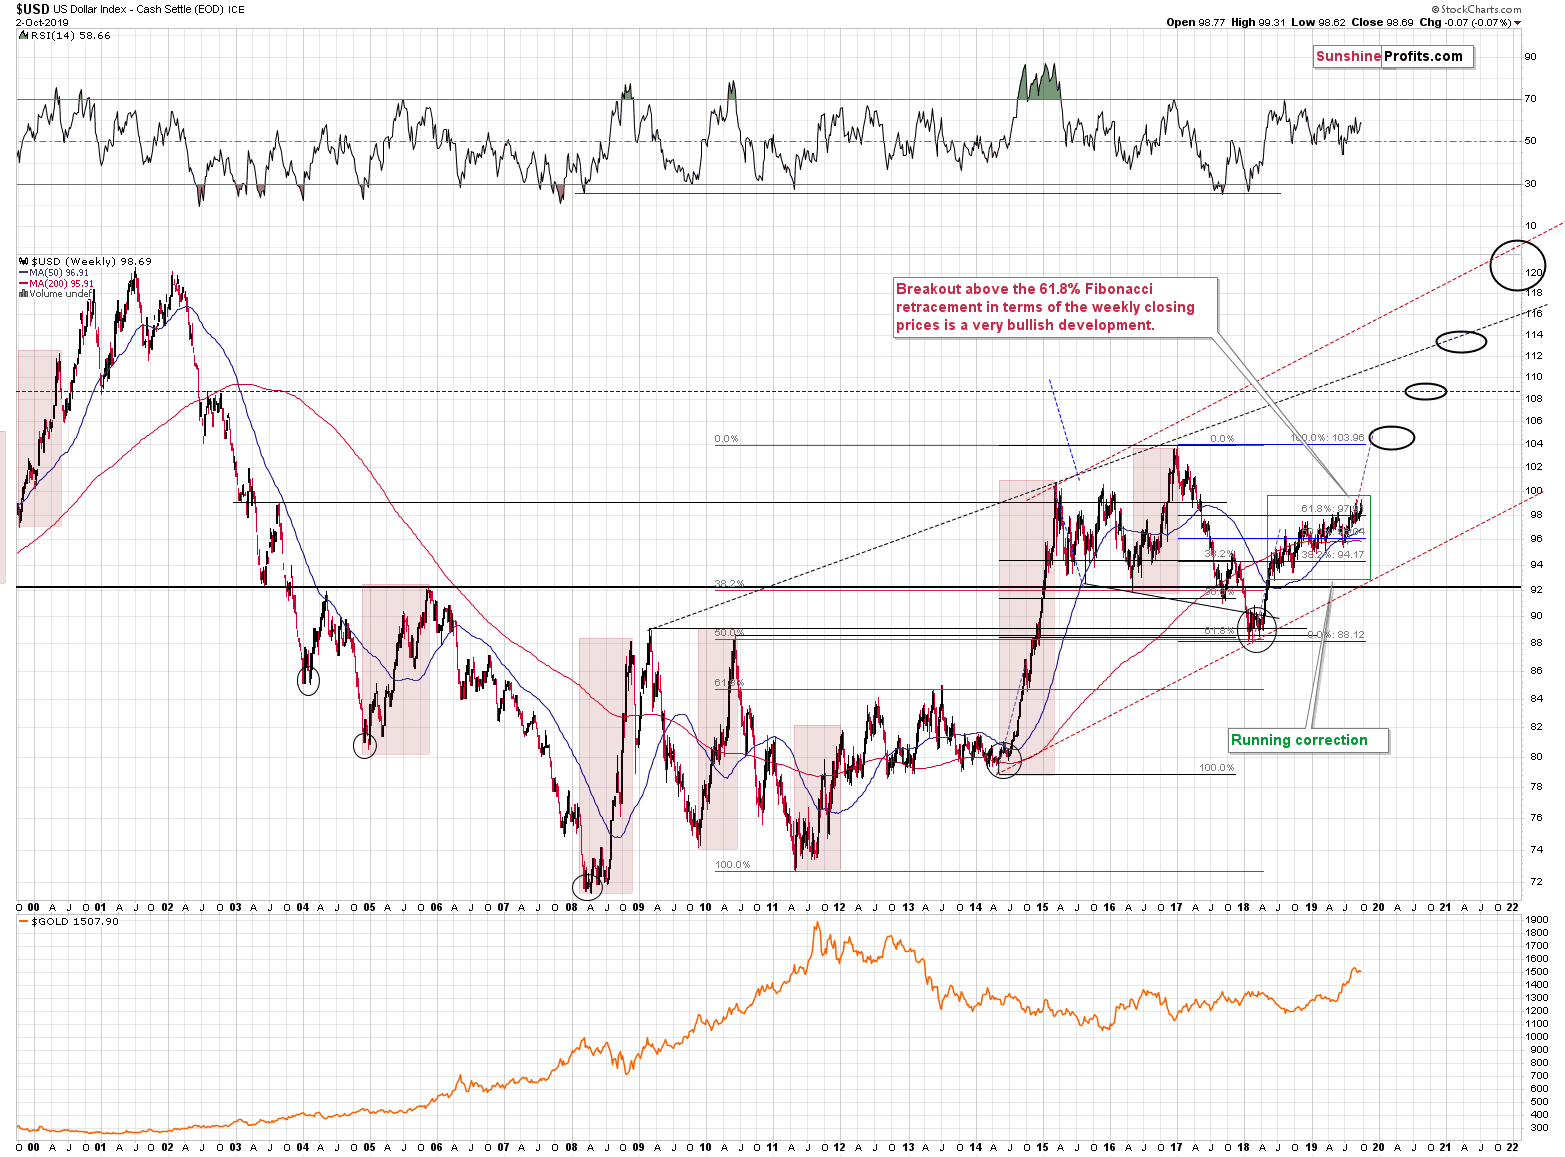
Our previous comments on the long-term charts remain up-to-date:
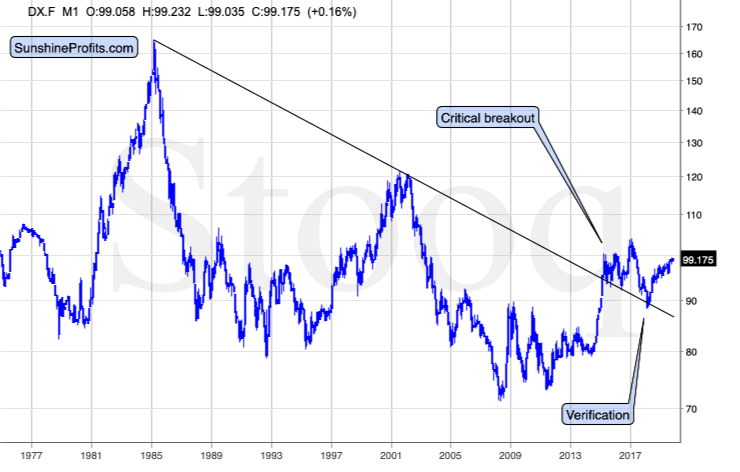
The USD Index is after a major long-term breakout and this breakout was already verified a few times. The most recent rally is just the very early part of the post-breakout rally. Much higher USD Index values are likely to follow in the upcoming months.
The long-term trend is up as even the dovish U-turn by the Fed, rate cuts, and myriads of calls from President Trump for lower U.S. dollar and much lower (even negative) interest rates, were not able to trigger any serious decline.
What we saw instead was a running correction that's the most bullish kind of corrections. It's the one in which the price continues to rally, only at significantly smaller pace.
Trading position (short-term; our opinion): No position in the USD is justified from the risk/reward perspective at the moment of writing these words. We will probably enter a long position in the USD Index shortly.
As always, we will keep you - our subscribers - informed.
Thank you.
Sincerely,
Przemyslaw Radomski, CFA
Editor-in-chief, Gold & Silver Fund Manager

