

We wrote a lot about patience recently. Patience and diligence at that. Can we deduce something meaningful from the forex market setups that would warrant action? When would the odds be with us finally? Let’s take a closer look.
- EUR/USD: short (a stop-loss order at 1.1576; the initial downside target at 1.1305)
- GBP/USD: none
- USD/JPY: none
- USD/CAD: none
- USD/CHF: none
- AUD/USD: short (a stop-loss order at 0.7402; the initial downside target at 0.7096)
EUR/USD
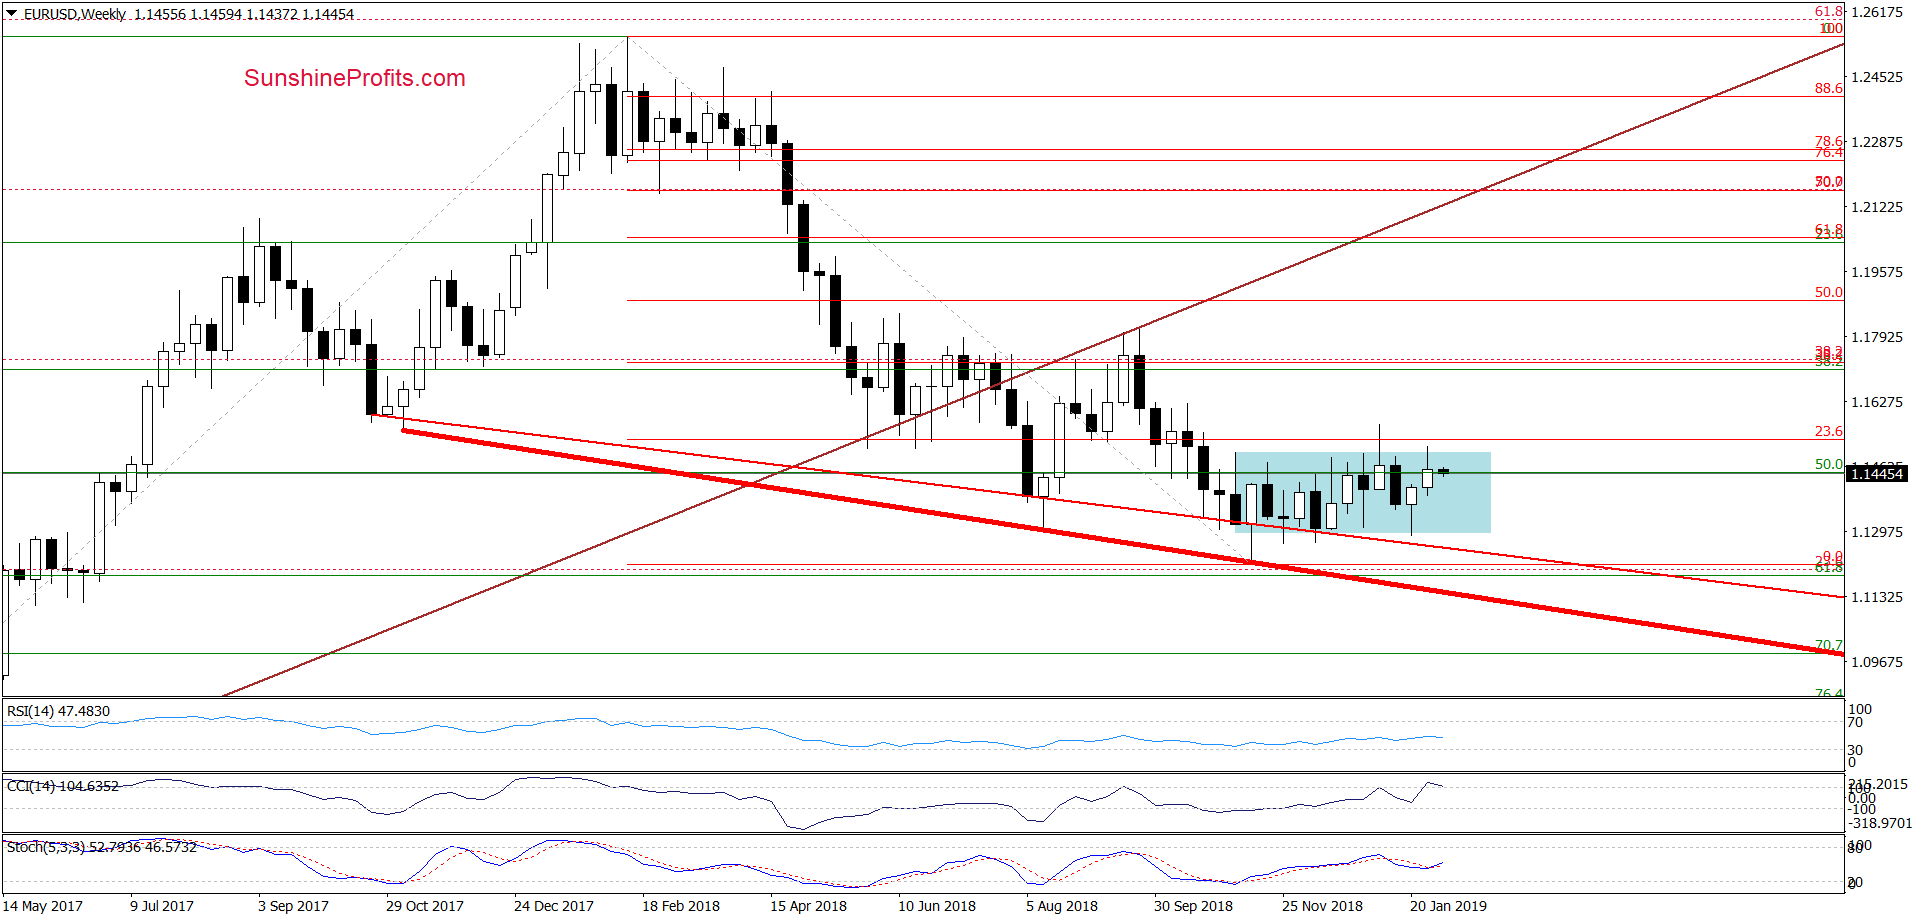
Let’s start with the weekly chart. Although currency bulls pushed EUR/USD above the upper border of the blue consolidation, they didn’t manage to hold their gains. The pair closed the week inside the sideways trend formation.
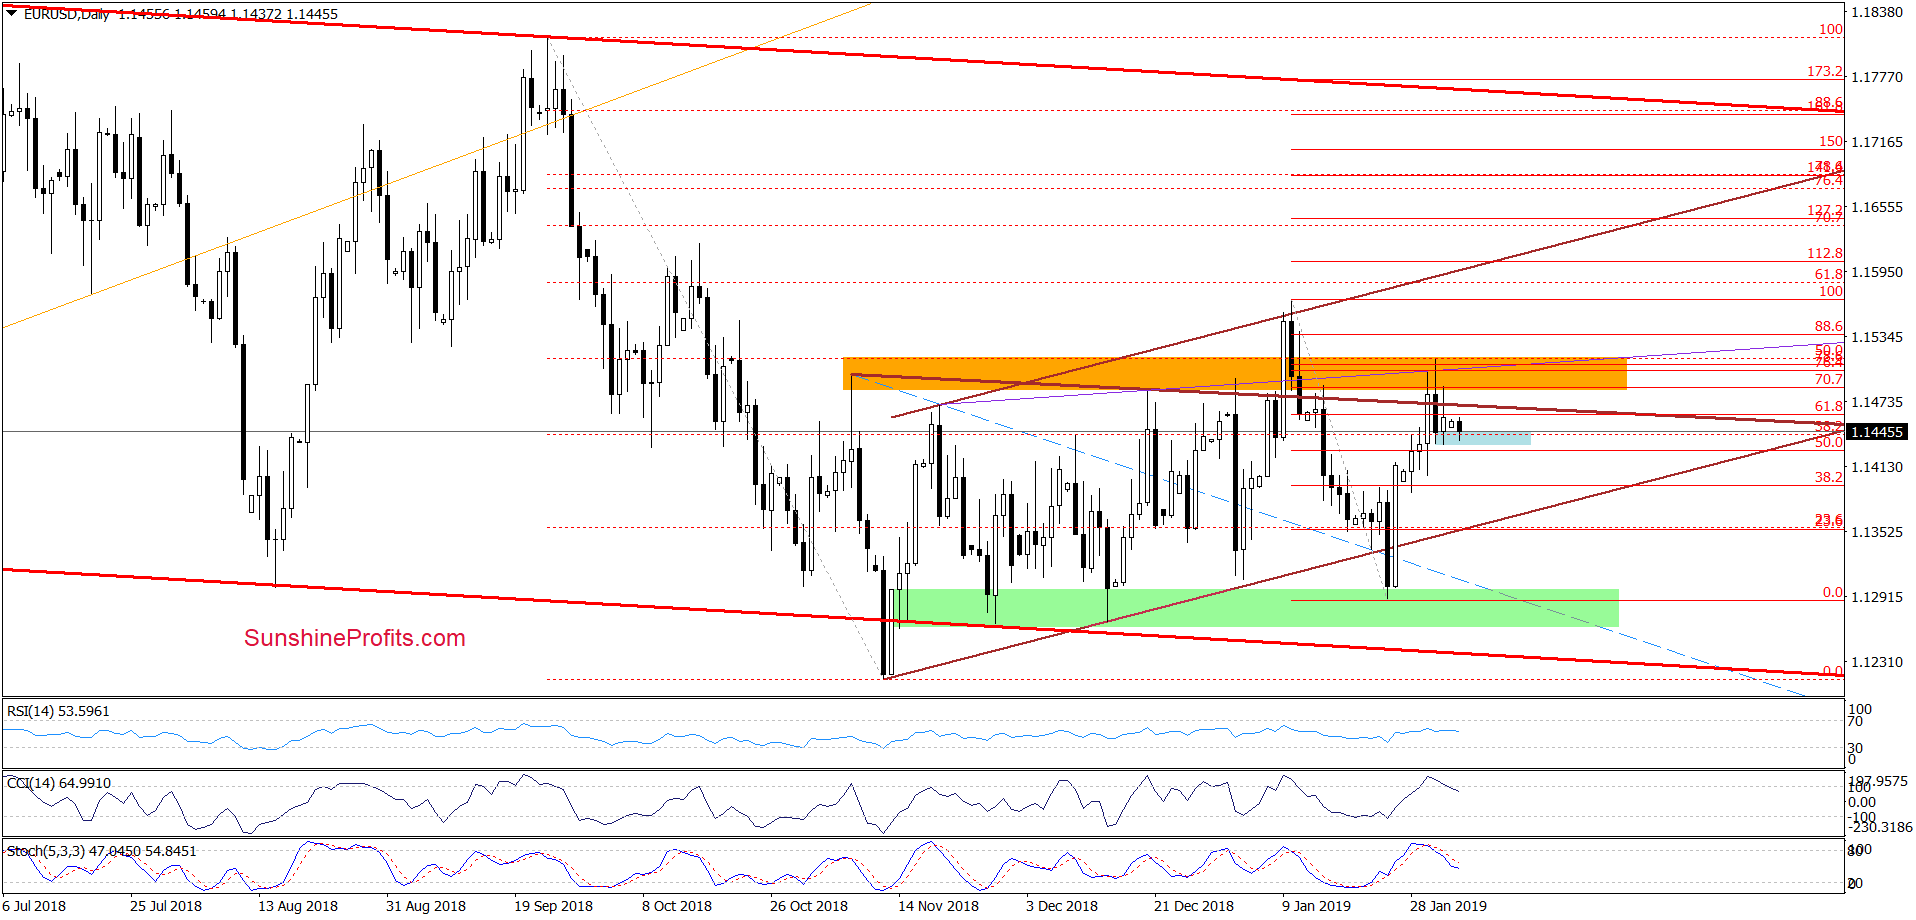
The bears finished Friday’s session below the upper border of the brown triangle and the orange resistance zone, which increases the probability of further deterioration – especially when we take into account the sell signals generated by the daily indicators.
From today’s point of view, it seems that the last block on the way down is the very short-term blue support area created by the recent lows. Taking all the above into account and looking at the shape of Friday’s move, we think that lower values of the exchange rate are just around the corner.
Therefore, opening short positions seems are justified from the risk/reward perspective as EUR/USD has the potential to realize the bearish scenario that we wrote about on Friday:
(…) EUR/USD will likely turn south and re-test the lower border of the brown triangle or even the green support area, which stopped the sellers several times in recent weeks.
Trading position (short-term; our opinion): Short positions with a stop-loss order at 1.1576 and the initial downside target at 1.1305 are justified from the risk/reward perspective. We will keep you informed should anything change, or should we see a confirmation/invalidation of the above.
USD/CHF
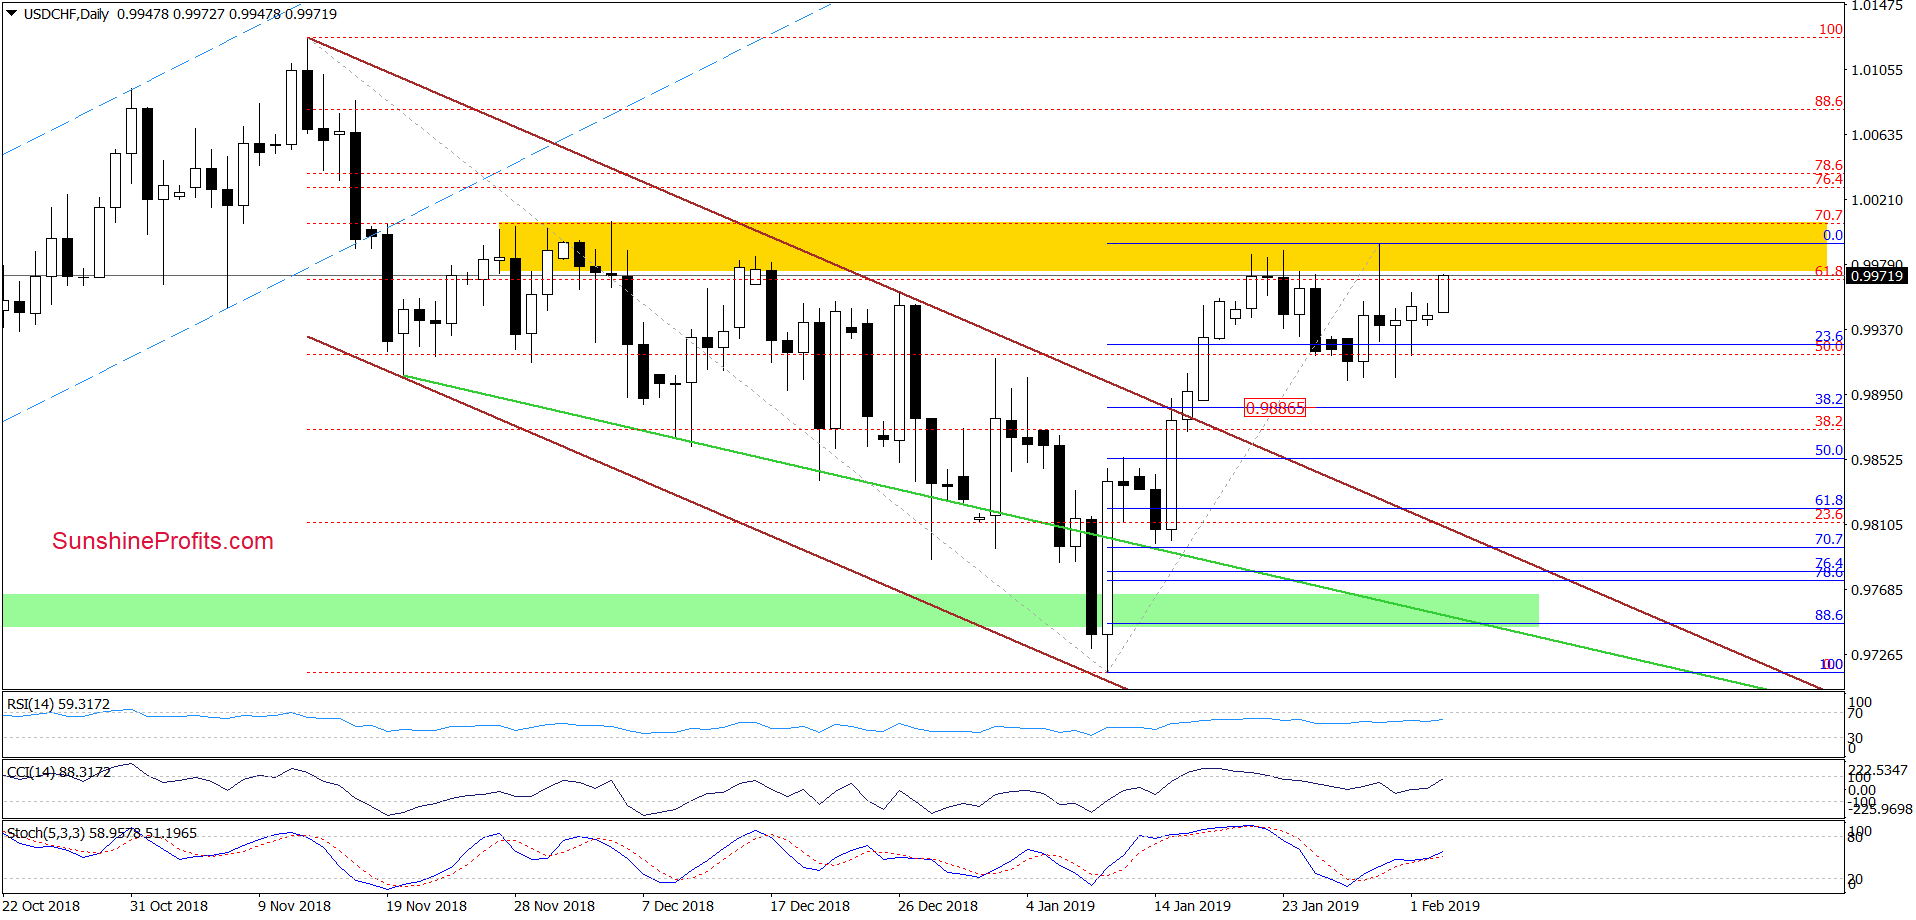
Although USD/CHF pulled back after the first 2019 test of the yellow resistance zone, currency bulls didn’t give up and took the exchange rate right back up once again. However, this area proved to be a stiff resistance a few times recently. The history surely can repeat itself once again and we may see lower values in the coming days.
Why do the buyers have problems overcoming this zone? Let’s take a look at the long-term chart below to find out.
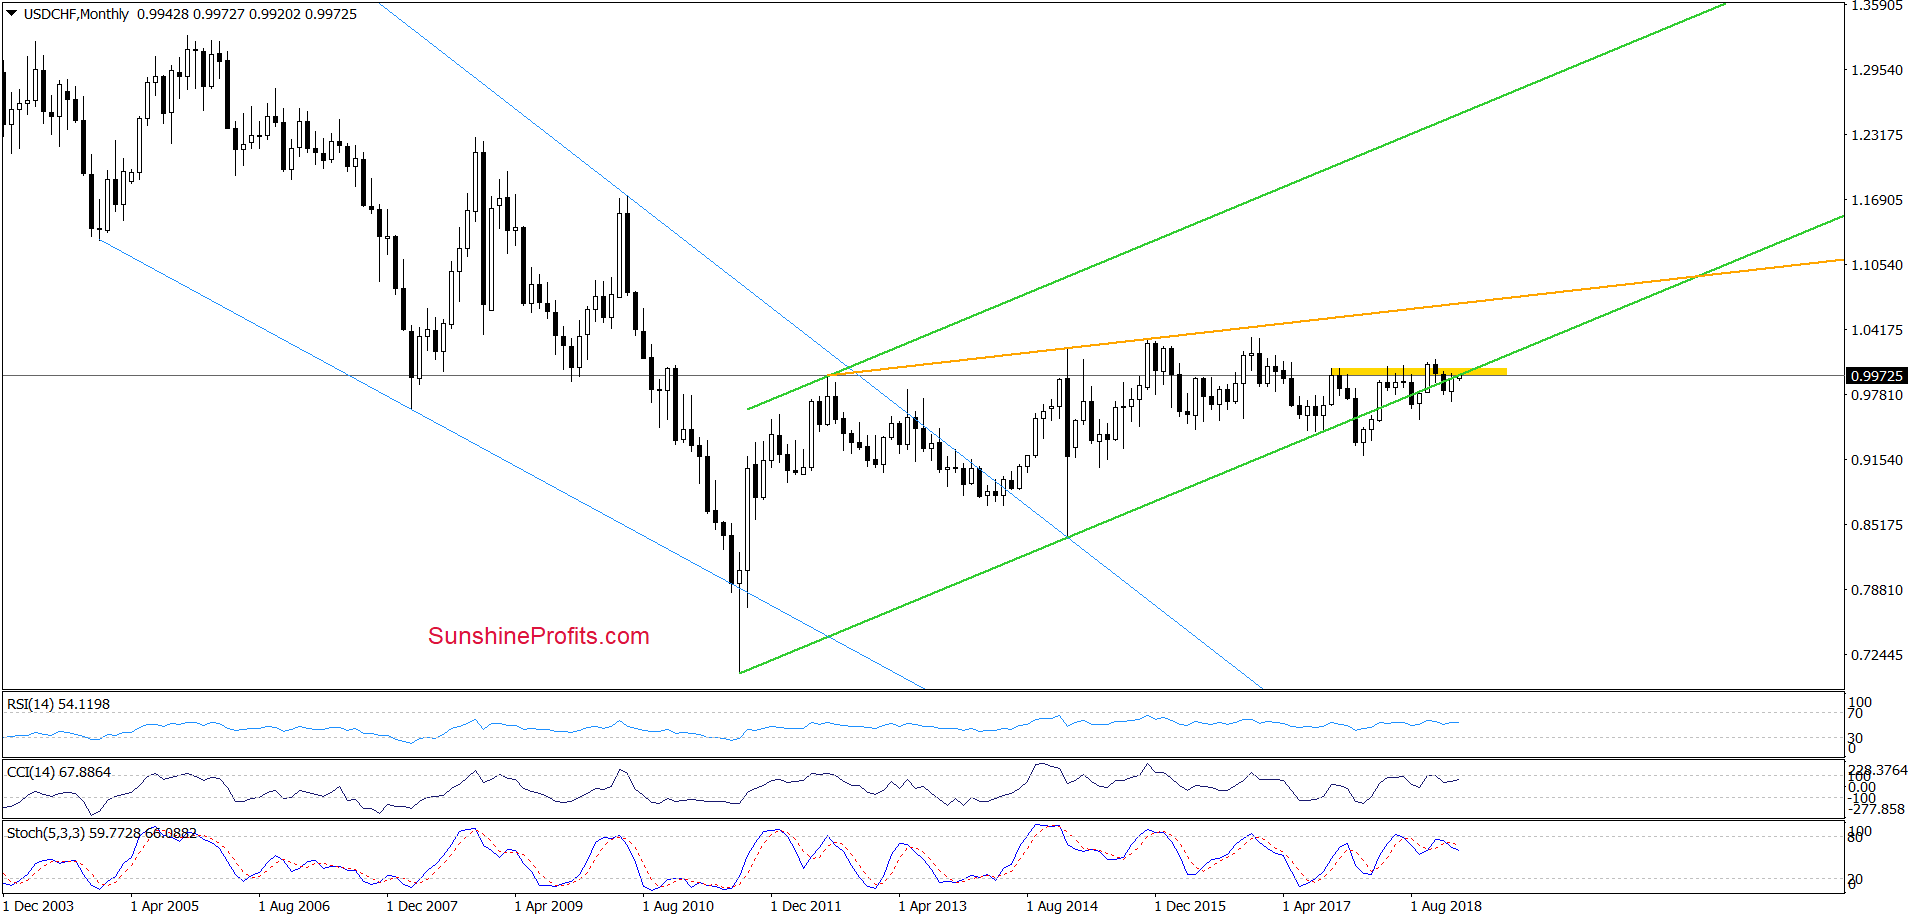
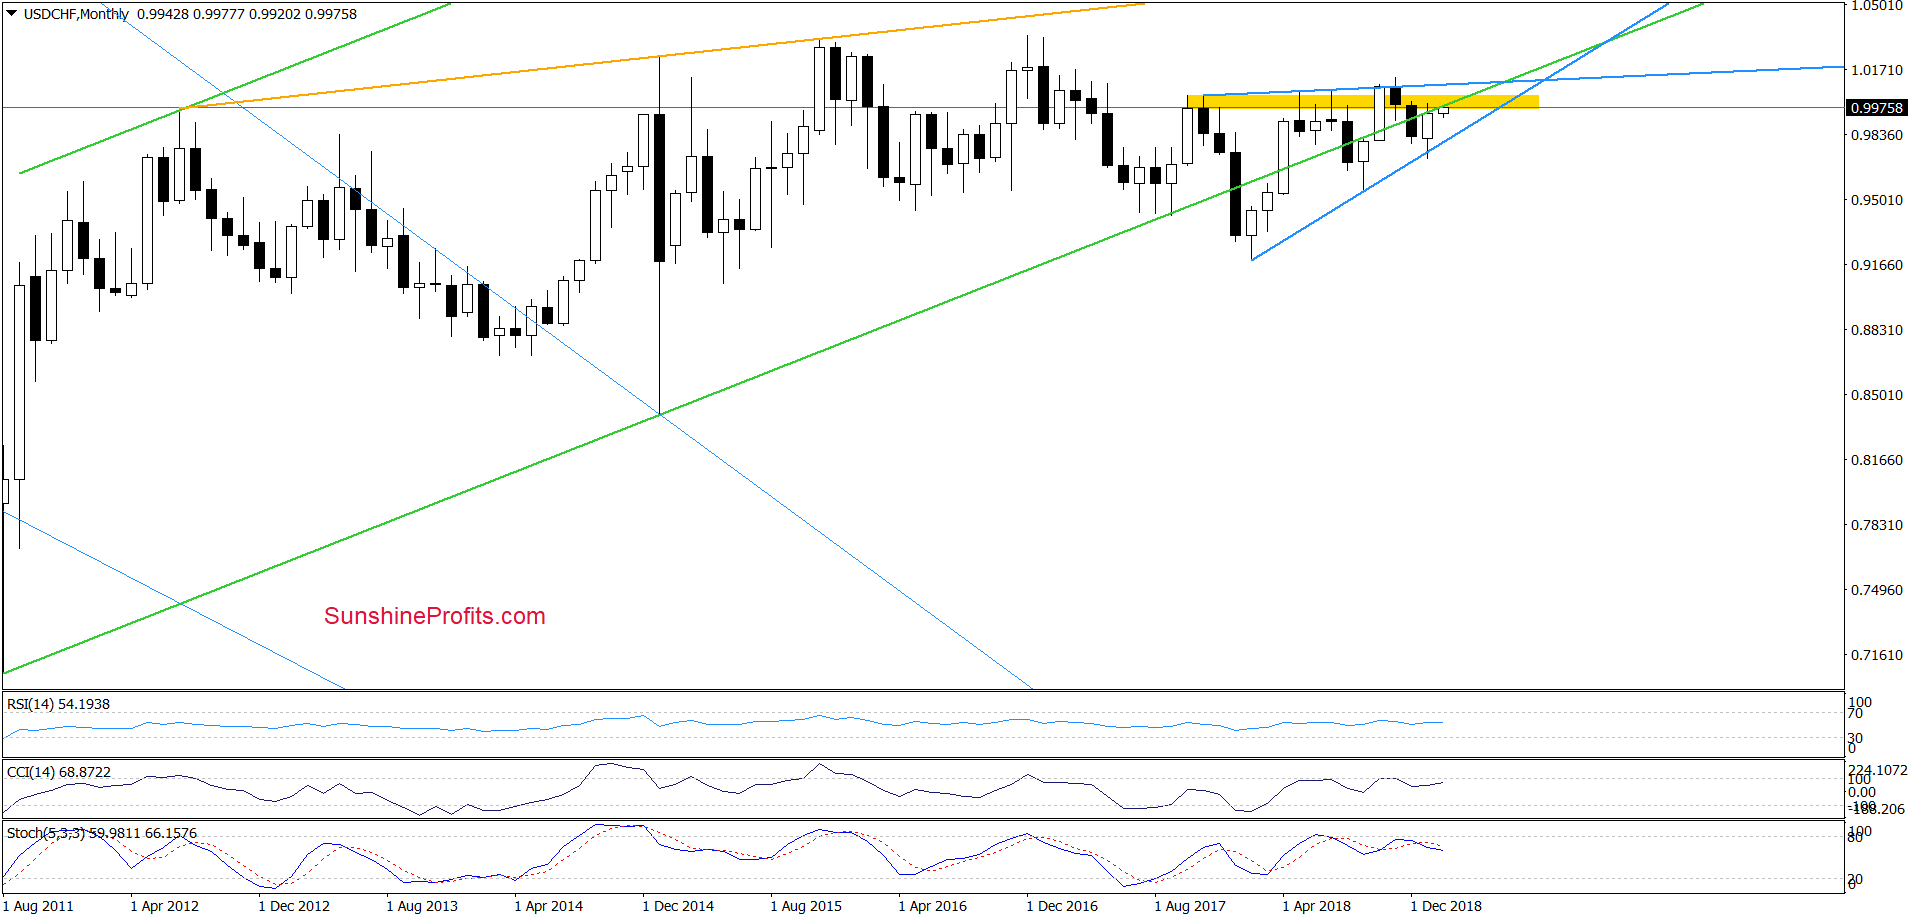
We see that USD/CHF remains trapped under the previously-broken very long-term green line, which serves as the major resistance at the moment. Just like the yellow resistance zone does. Additionally, the exchange rate is stuck inside the blue rising wedge. It suggests that only a breakout above the upper border of the formation or a breakdown below its lower border will generate a bigger move north or south. Before that happens, short-lived attempts in both directions would not surprise us in the least.
Trading position (short-term; our opinion): No positions are justified from the risk/reward perspective. We will keep you informed should anything change, or should we see a confirmation/invalidation of the above.
AUD/USD
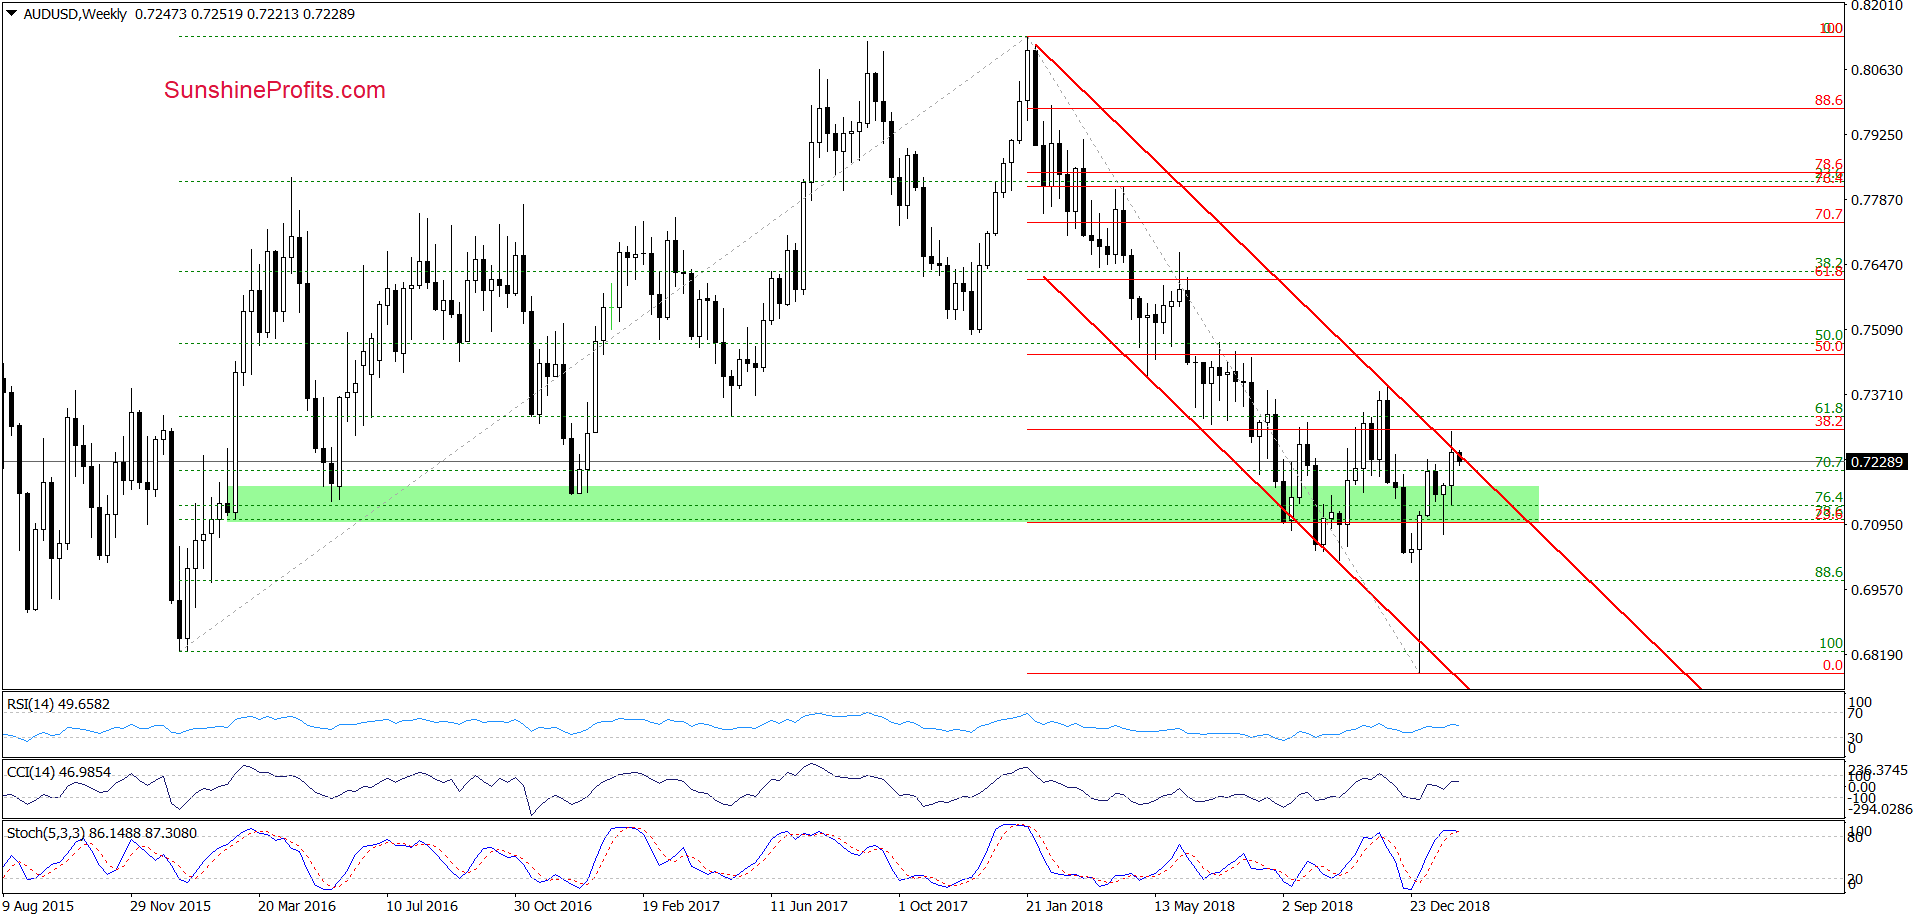
Let’s start with the weekly chart. The first thing that catches the eye is the invalidation of the tiny breakout above the upper border of the red declining trend channel. Additionally, the Stochastic Oscillator is very close to generating a sell signal, which doesn’t bode well for higher values of AUD/USD.
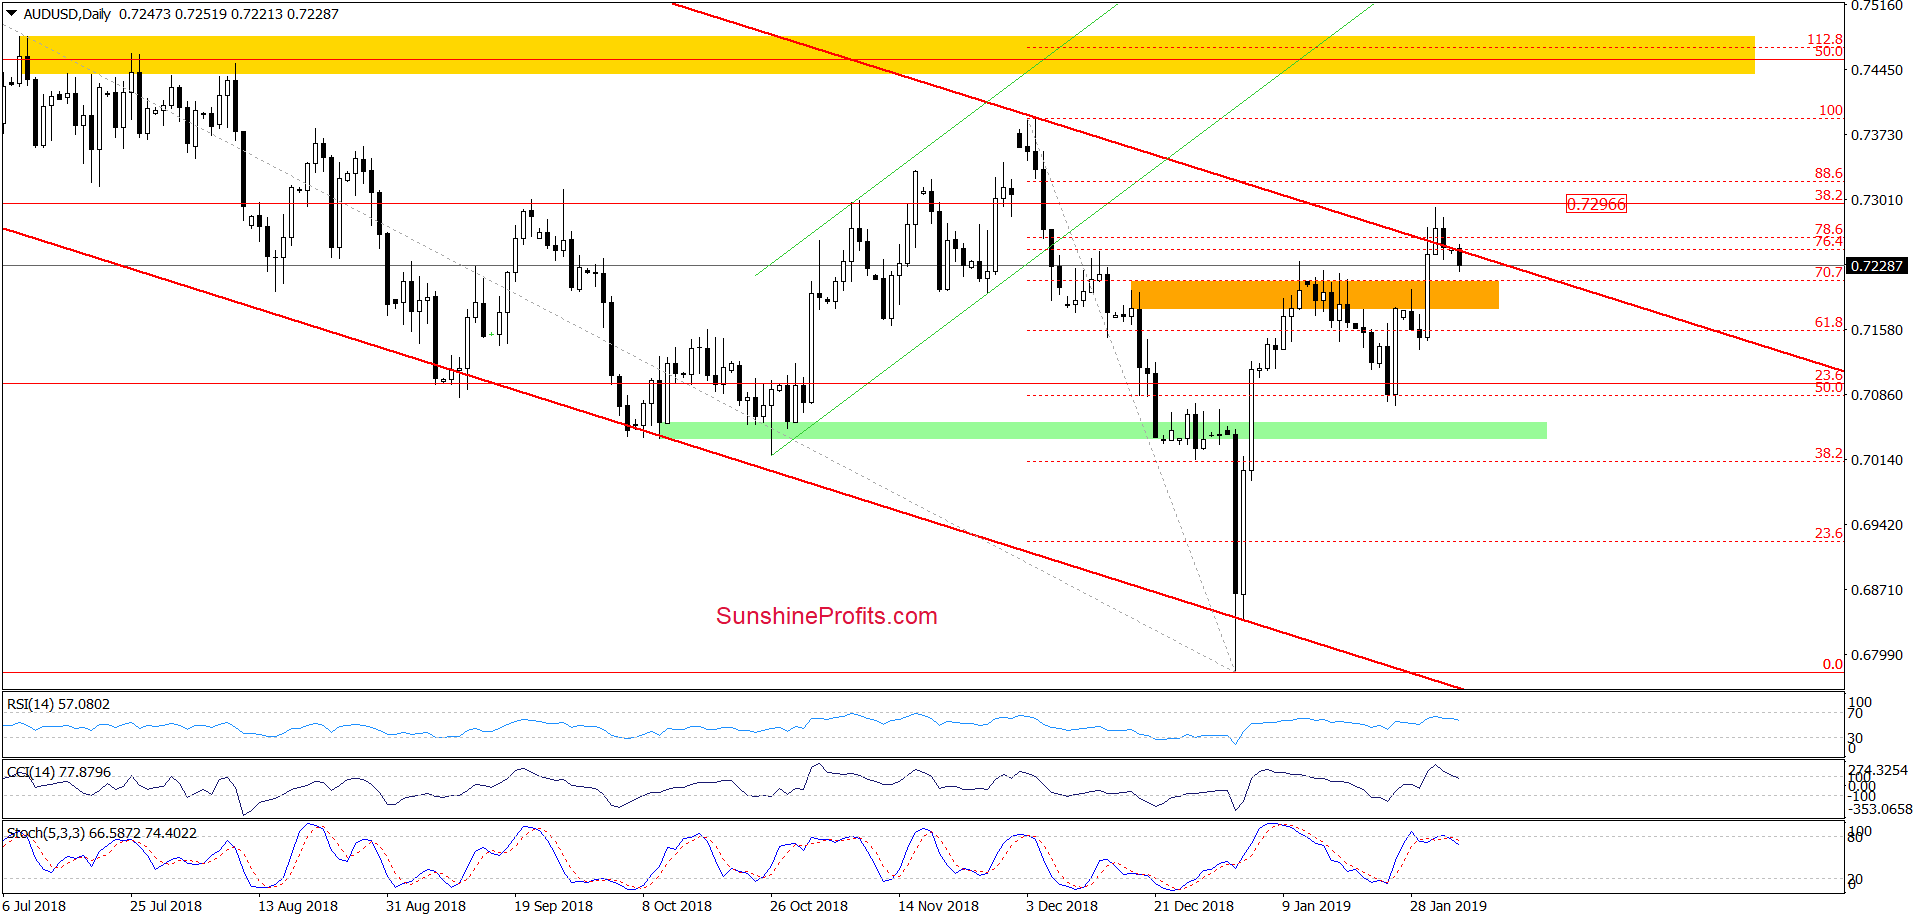
How did this move affect the daily chart?
Before we answering, let’s recall what we wrote in our last commentary on this currency pair:
(…) the exchange rate extended gains, which suggests a climb to the 38.2% Fibonacci retracement based on the entire 2018 downward move in the very near future. Even if bullish at first sight, the position of the daily indicators is deteriorating as Stochastics is on the verge of repeating its sell signal and CCI registered values that proved unsustainable for more than a few days. This is supported on the weekly timeframe with the Stochastics approaching overbought levels presaging deterioration down the road.
Therefore, the potential for further gains looks limited. Reversal in the coming day(s) should not surprise us. (…)
On the daily chart, we see that the situation developed in tune with our assumptions. The proximity to the 38.2% Fibonacci retracement encouraged the sellers to act and the pair slipped back below the upper line of the red channel and also below the January peak. This invalidation of the trend channel breakout serves as a strong bearish sign in itself, and in combination with the sell signals generated by the indicators increases the probability of further declines.
If this is the case, we’ll likely see a test of the recent lows. Taking all the above into account, we think that opening short positions is justified from the risk/reward perspective.
Trading position (short-term; our opinion): Short positions with a stop-loss order at 0.7402 and the initial downside target at 0.7096 are justified from the risk/reward perspective. We will keep you informed should anything change, or should we see a confirmation/invalidation of the above.
Thank you.
Nadia Simmons
Forex & Oil Trading Strategist

