

Yesterday’s data showed that consumer confidence index increased to 96.5 in Dec, beating analysts’ forecasts for a rise to 93.8 this month. As a result, the USD Index not only climbed above 98, but also hit an intraday high of 98.47 in the following hours. Despite this improvement, the Australian dollar moved higher and reached the key resistance zone. Will it withstand the buying pressure in the coming days?
In our opinion the following forex trading positions are justified - summary:
- EUR/USD: short (stop-loss order at 1.1363; initial downside target at 1.0462)
- GBP/USD: none
- USD/JPY: none
- USD/CAD: none
- USD/CHF: none
- AUD/USD: none
EUR/USD
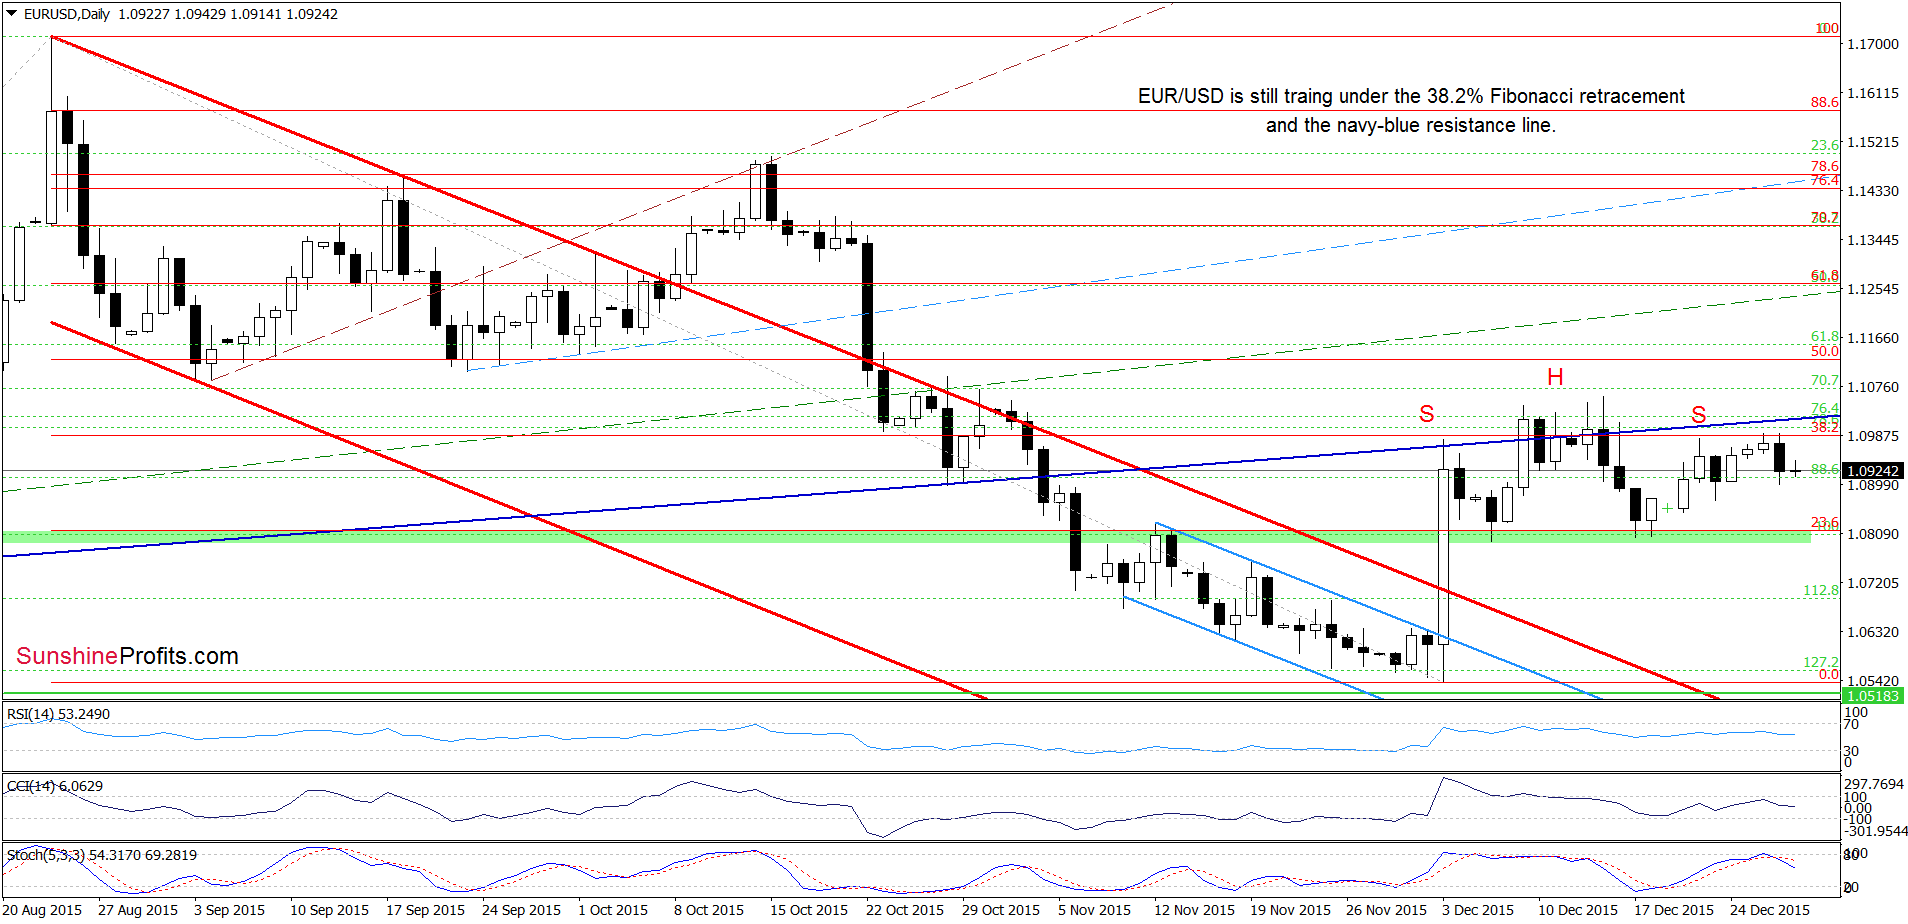
Looking at the charts, we see that EUR/USD is still trading under the key short-term resistance area created by the 38.2% Fibonacci retracement and the navy blue resistance line, which means that what we wrote on Monday is up-to-date also today:
(…) In previous weeks, it was strong enough to stop further rally, which suggests that we may see a similar price action in near future. Therefore, in our opinion, as long as there is no breakout above this zone, further increases are doubtful. At this point, it is also worth noting that the current position of daily indicators suggests a reversal and lower values of the exchange rate in the coming days.
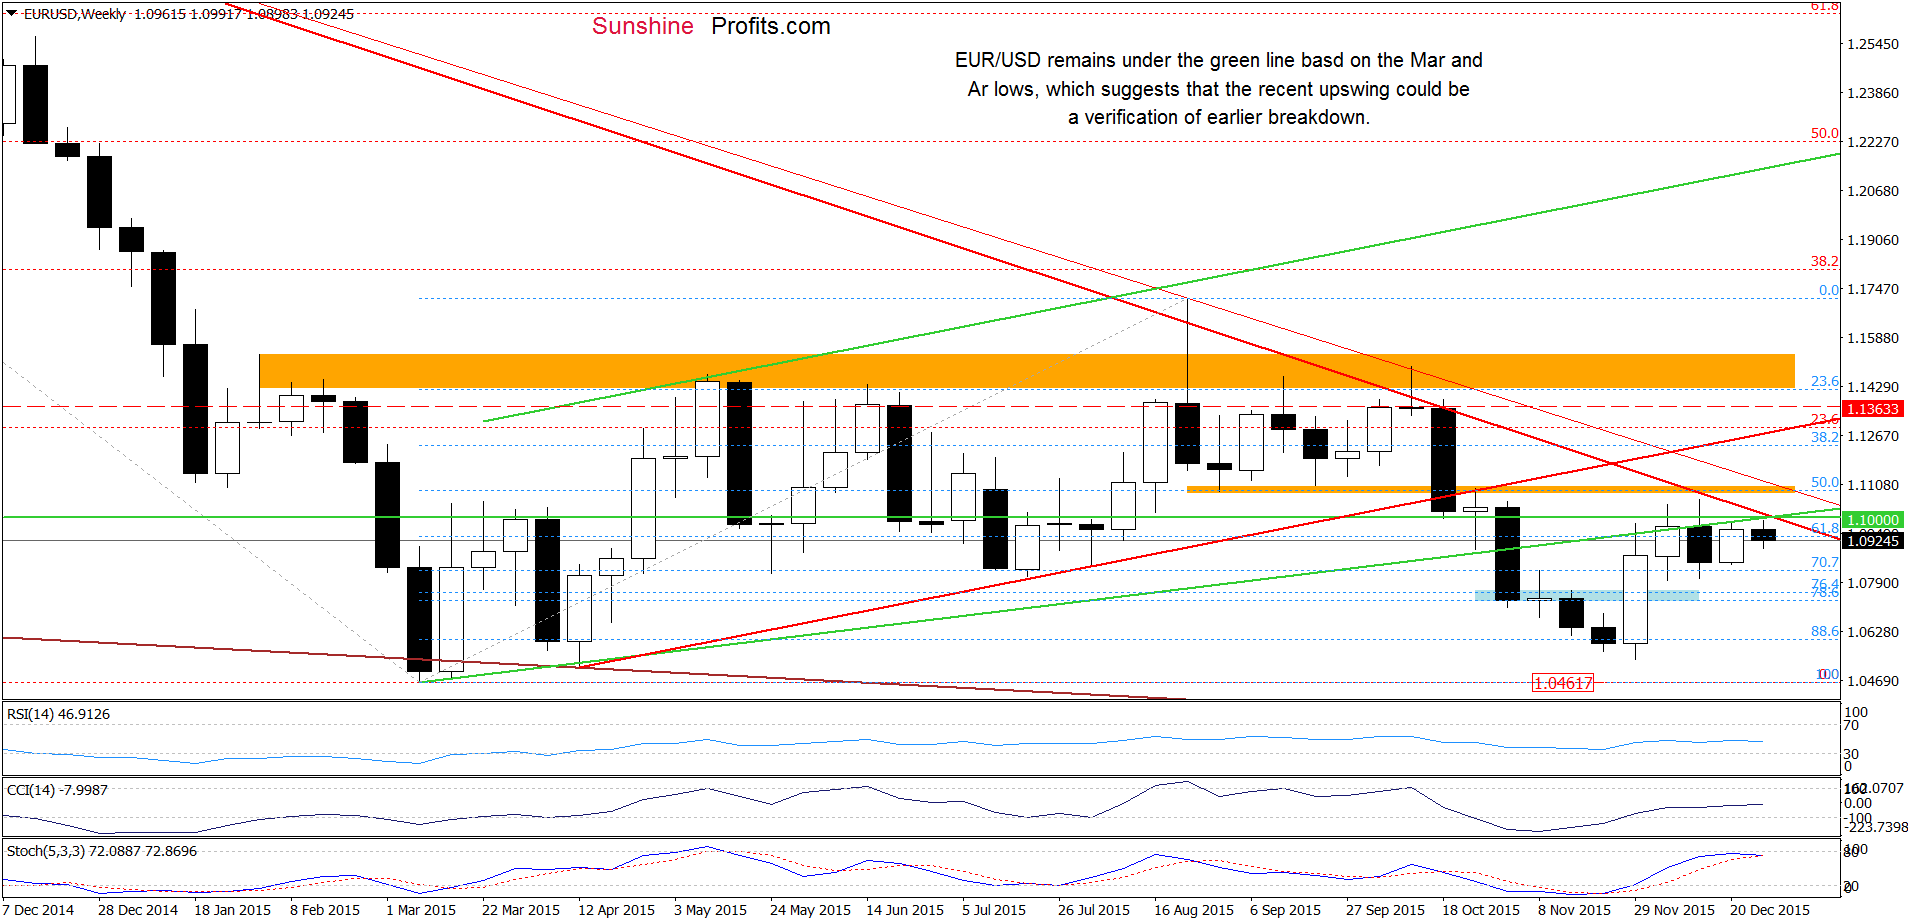
(…) the combination of the previously-broken green resistance line, the barrier of 1.1000 and the orange resistance zone continues to keep gains in check. Additionally, the pair reached long-term red declining resistance line, which has successfully stopped currency bulls several times in the past. Taking all the above into account, and the position of the weekly Stochastic Oscillator (it is very close to generating a sell signal), we believe that reversal and declines from here are just around the corner.
Very short-term outlook: bearish
Short-term outlook: bearish
MT outlook: bearish
LT outlook: mixed
Trading position (short-term; our opinion): Short positions (with a stop-loss order at 1.1363 and the initial downside target at 1.0462) are justified from the risk/reward perspective. We will keep you informed should anything change, or should we see a confirmation/invalidation of the above.
USD/JPY
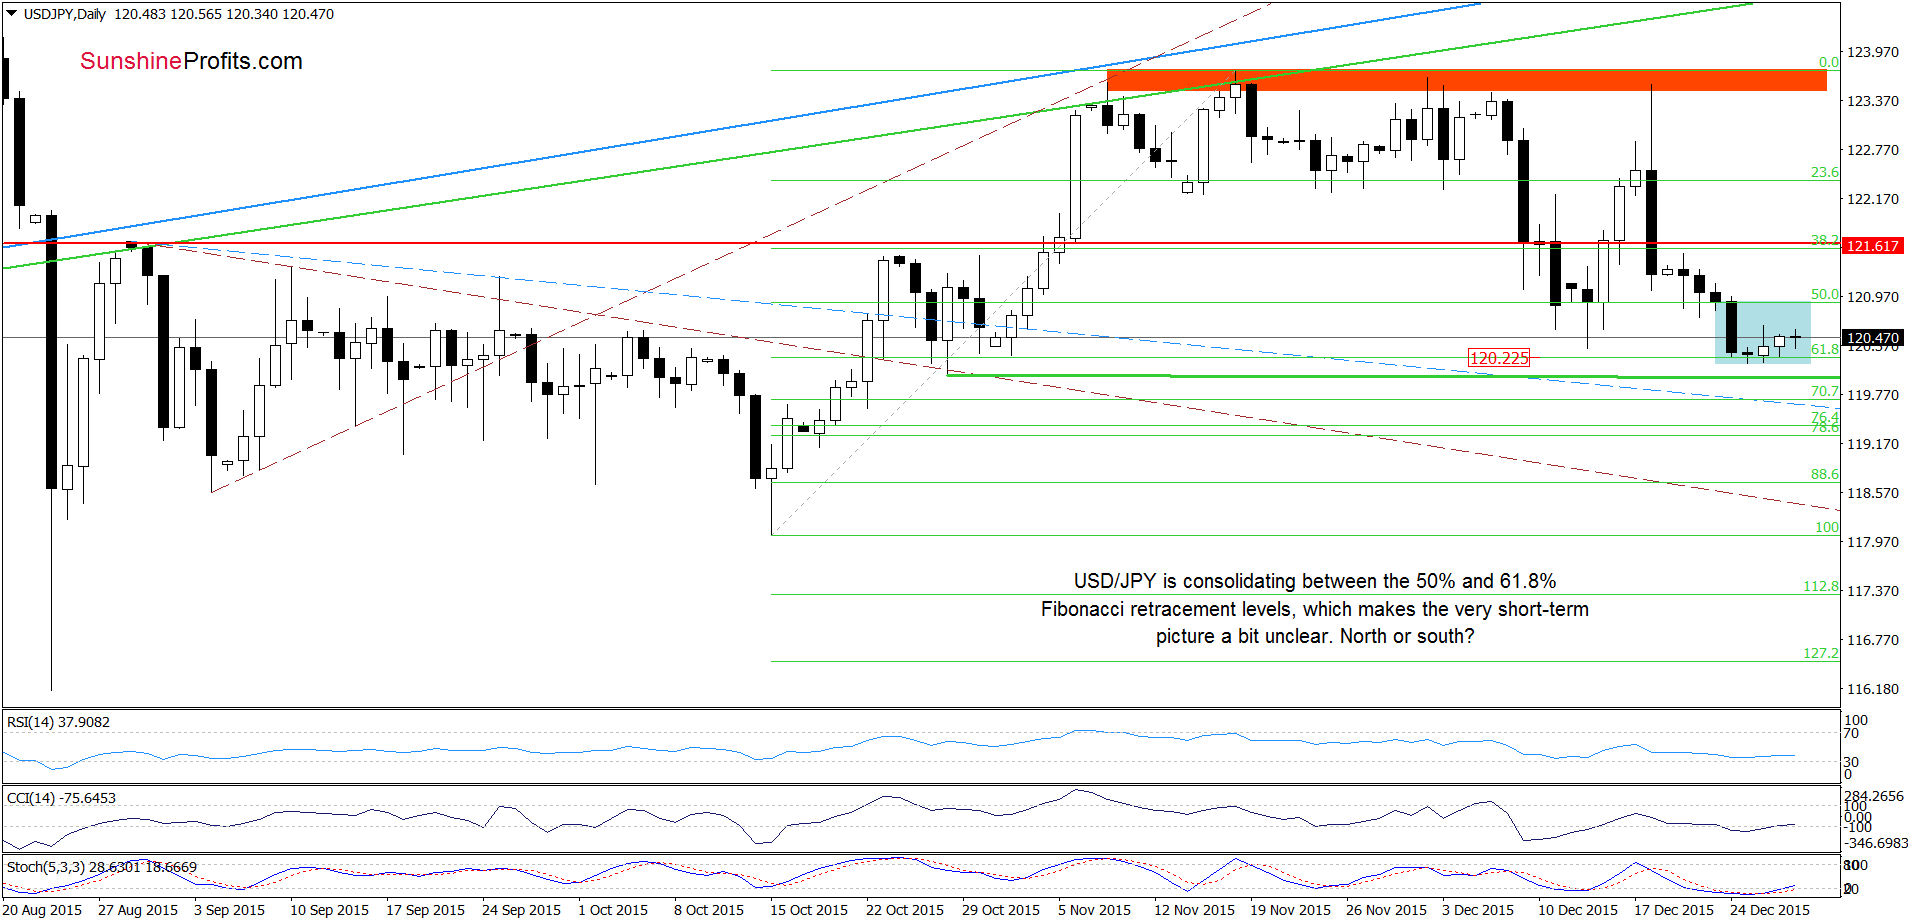
On the daily chart, we see that USD/JPY is consolidating between the 50% and 61.8% Fibonacci retracement levels, which makes the very short-term picture a bit unclear. Therefore, as long as there is no breakout above the upper line of the formation (or a breakdown under the recent lows) another sizable move is doubtful. Nevertheless, the current position of the indicators (the CCI and Stochastic Oscillator generated buy signals) suggests that further improvement is just around the corner.
Are there any other factors that could encourage currency bulls to act? Let’s take a closer look at the long-term chart and find out.
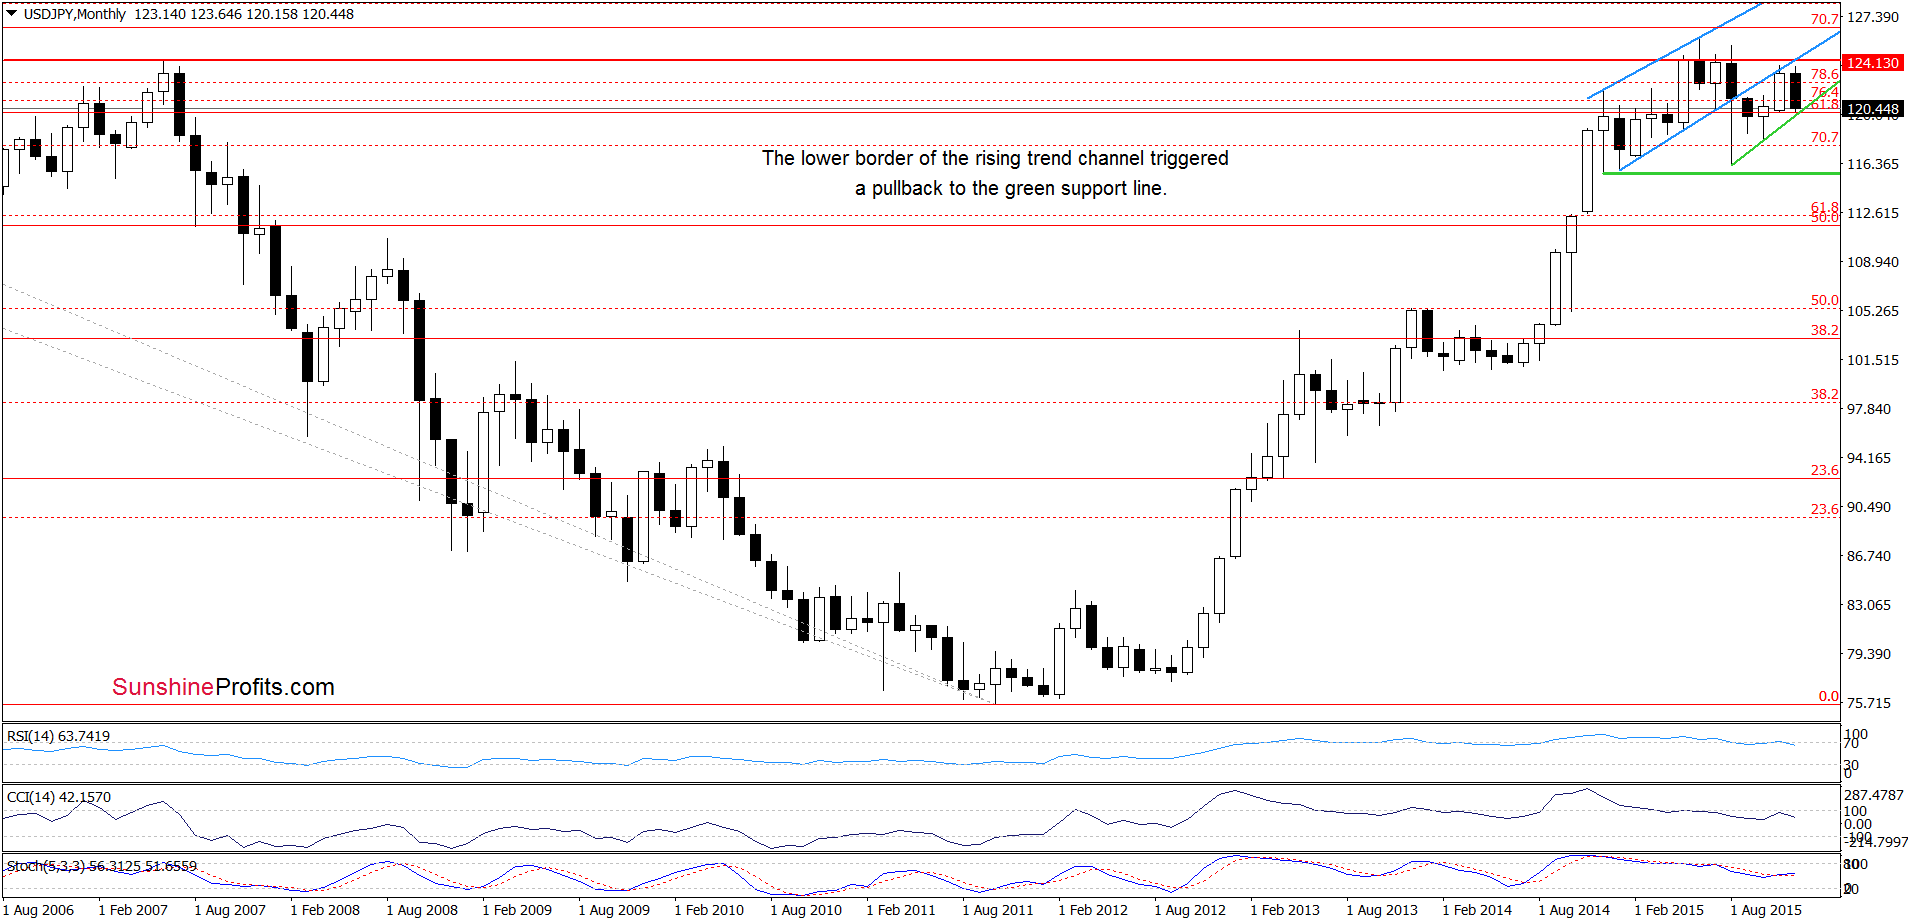
From this perspective, we see that this month’s downward move took the exchange rate to the purple support line based on the previous lows, which suggests that we may see a reversal and rebound from here in the coming month.
Very short-term outlook: mixed
Short-term outlook: mixed
MT outlook: mixed
LT outlook: mixed
Trading position (short-term; our opinion): No positions are justified from the risk/reward perspective. We will keep you informed should anything change, or should we see a confirmation/invalidation of the above.
AUD/USD
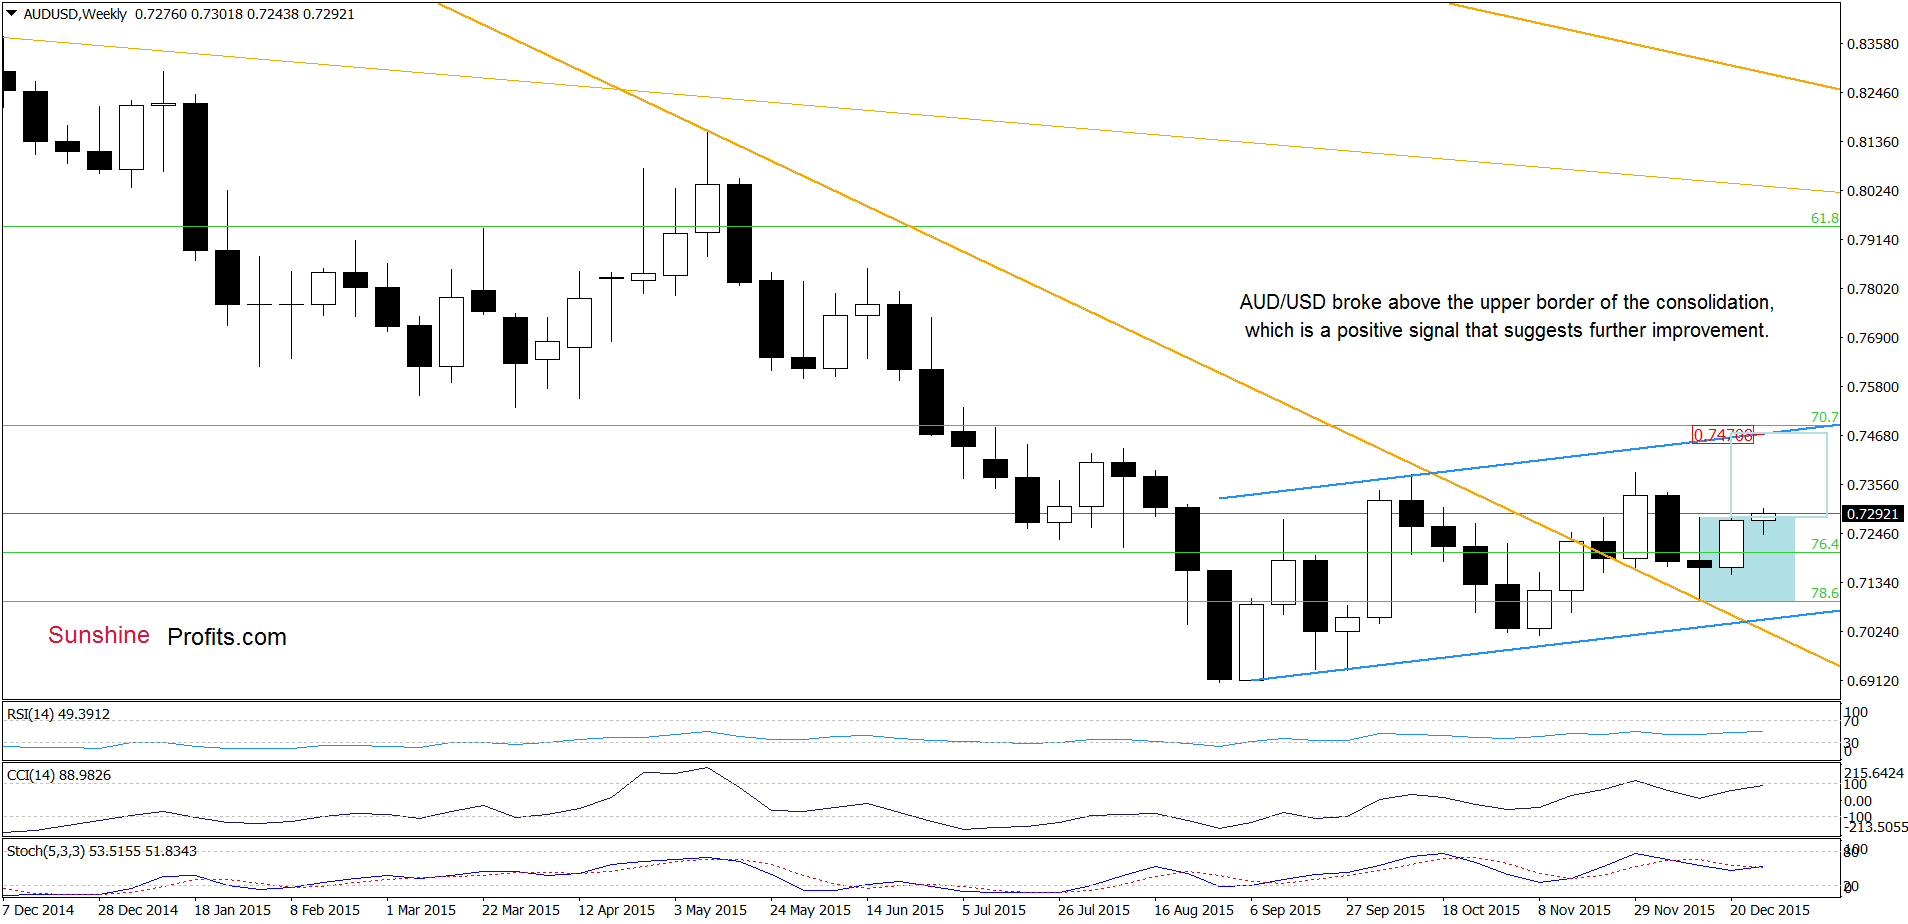
The first thing that catches the eye on the weekly chart is a breakout above the upper border of the consolidation, which is a positive signal that suggests further improvement and an increase to the upper border of the blue rising trend channel (in this area the size of the move will correspond to the height of the consolidation) in the coming week(s).
But will we see such price action? Let’s examine the very short-term picture and find out whether there are any factors that may hinder the realization of this scenario or not.
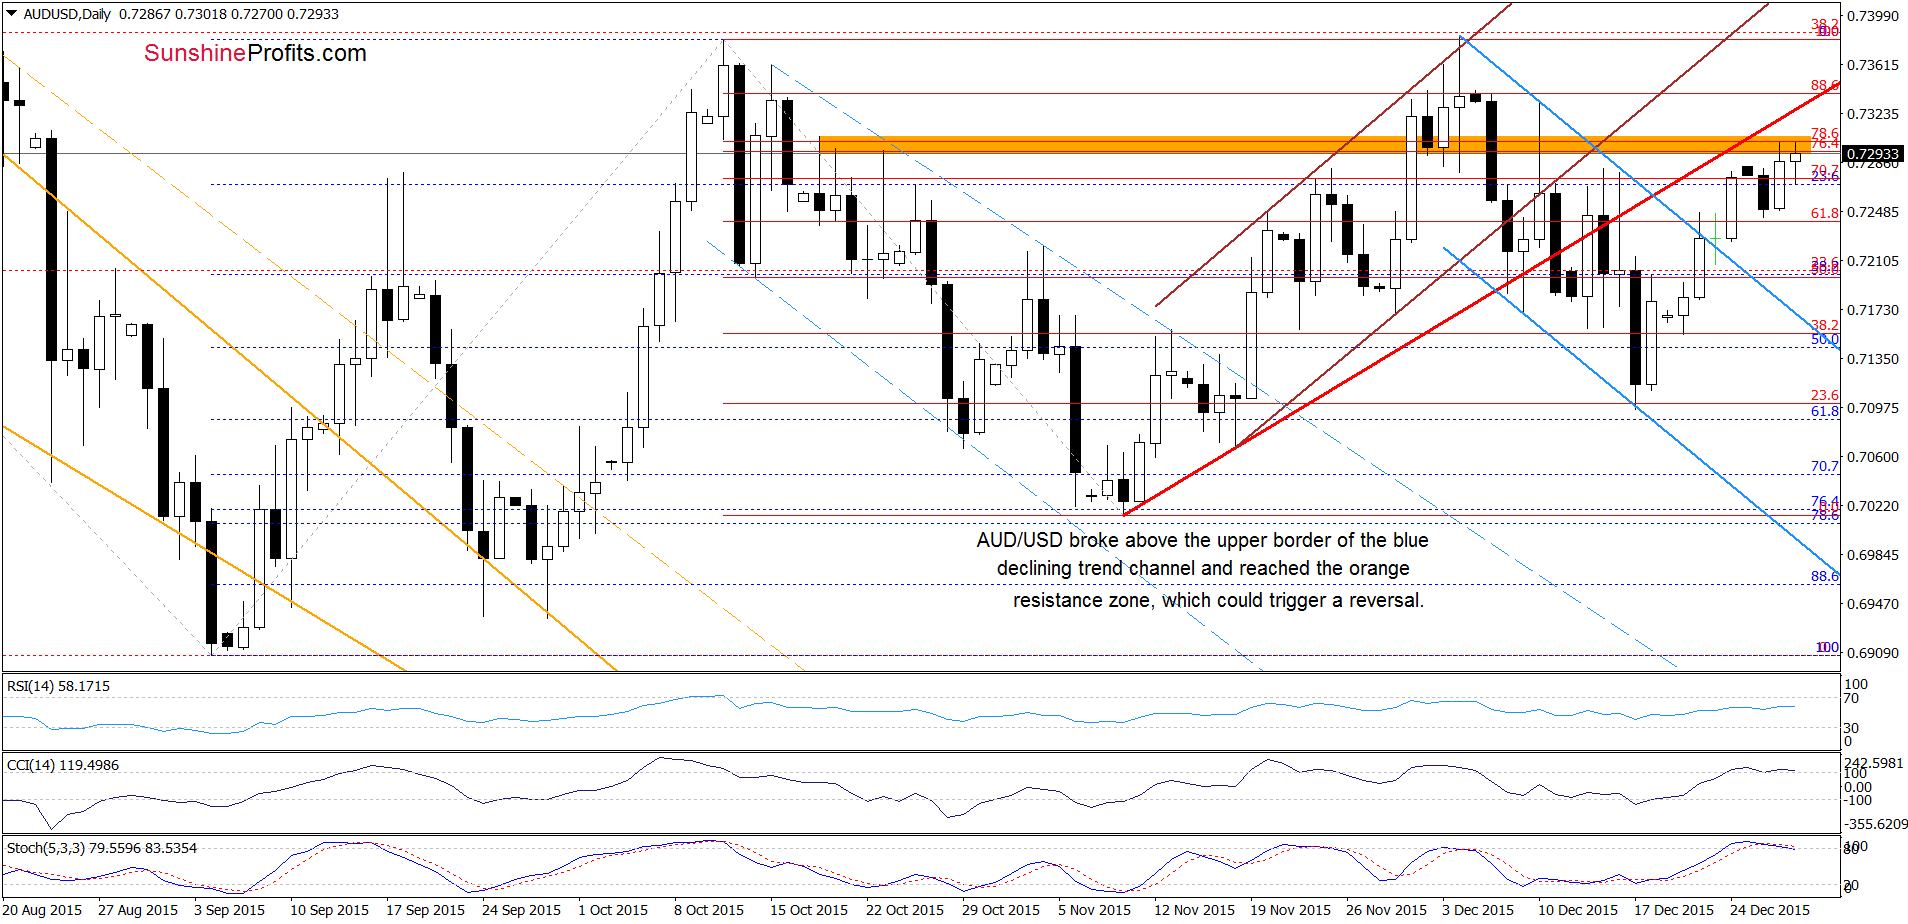
From this perspective, we see that AUD/USD extended gains and the pair reached the orange resistance zone (created by the 76.4% and 78.6% Fibonacci retracements). As you see on the daily chart, the proximity to this resistance area was enough to encourage currency bears to act in the previous week and also in mid-Dec. Taking this fact into account, and combining it with the current position of the indictors (they are very close to generating sell signals), we think that further deterioration is just around the corner. If this is the case, and AUD/USD declines from here, we’ll see a test of the previously-broken upper line of the blue declining trend channel in the coming days.
Very short-term outlook: mixed with bearish bias
Short-term outlook: mixed
MT outlook: mixed
LT outlook: mixed
Trading position (short-term; our opinion): No positions are justified from the risk/reward perspective, however, if AUD/USD invalidates earlier breakout above the upper border of the consolidation, we’ll consider opening short positions. We will keep you informed should anything change, or should we see a confirmation/invalidation of the above.
Thank you.
Nadia Simmons
Forex & Oil Trading Strategist
Przemyslaw Radomski, CFA
Founder, Editor-in-chief
Gold & Silver Trading Alerts
Forex Trading Alerts
Oil Investment Updates
Oil Trading Alerts

