

Earlier today, the U.S. Commerce Department showed that durable goods orders increased by 2.0% in the previous month, beating expectations for a decline of 0.4%. Additionally, core durable goods orders (without volatile transportation items) rose by 0.6% also higher than forecasts. Thanks to these solid numbers, the USD Index erased Monday’s declines and approached the level of 95, pushing the euro to its short-term support line. Will it hold in the coming days?
In our opinion the following forex trading positions are justified - summary:
EUR/USD
Yesterday, we wrote the following:
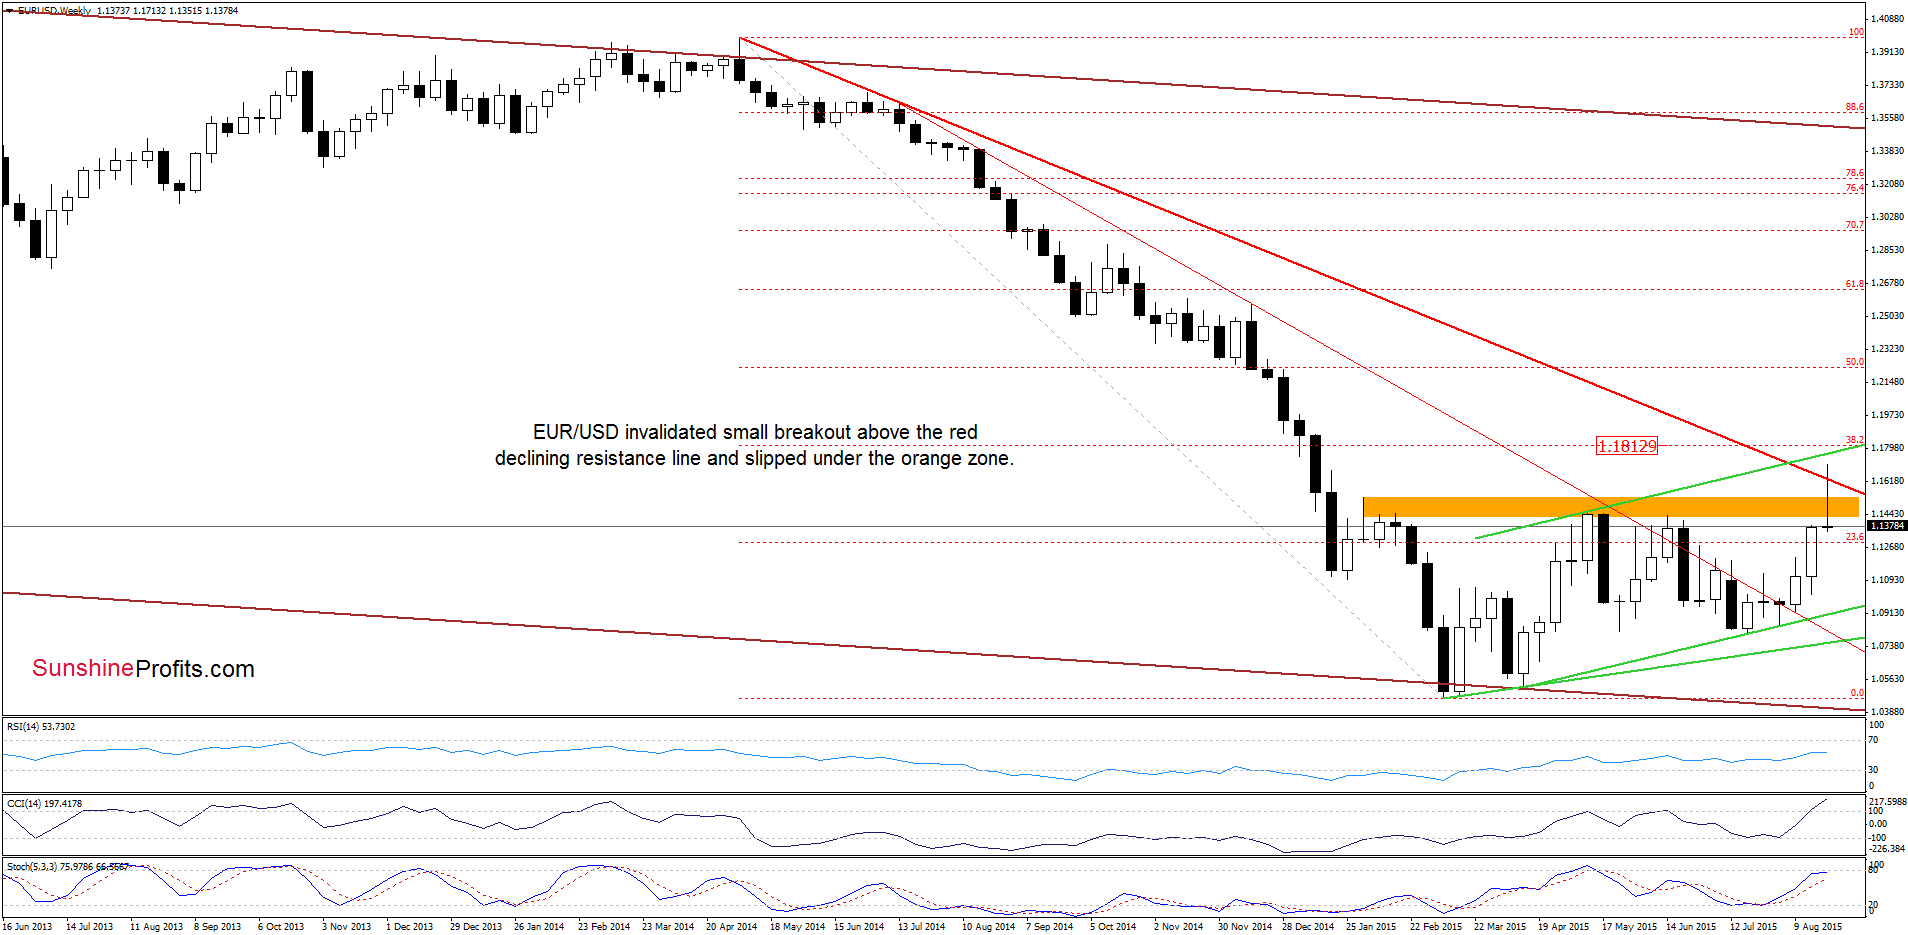
(…) the pair invalidated earlier small breakout above the red line, which is a negative signal that suggests further deterioration.
As you see on the weekly chart, the exchange rate moved lower and dropped under the previously-broken orange resistance line, which is an additional negative sign, which will likely encourage currency bears to act in the coming days.
Having said that, let’s focus on the very short-term picture.
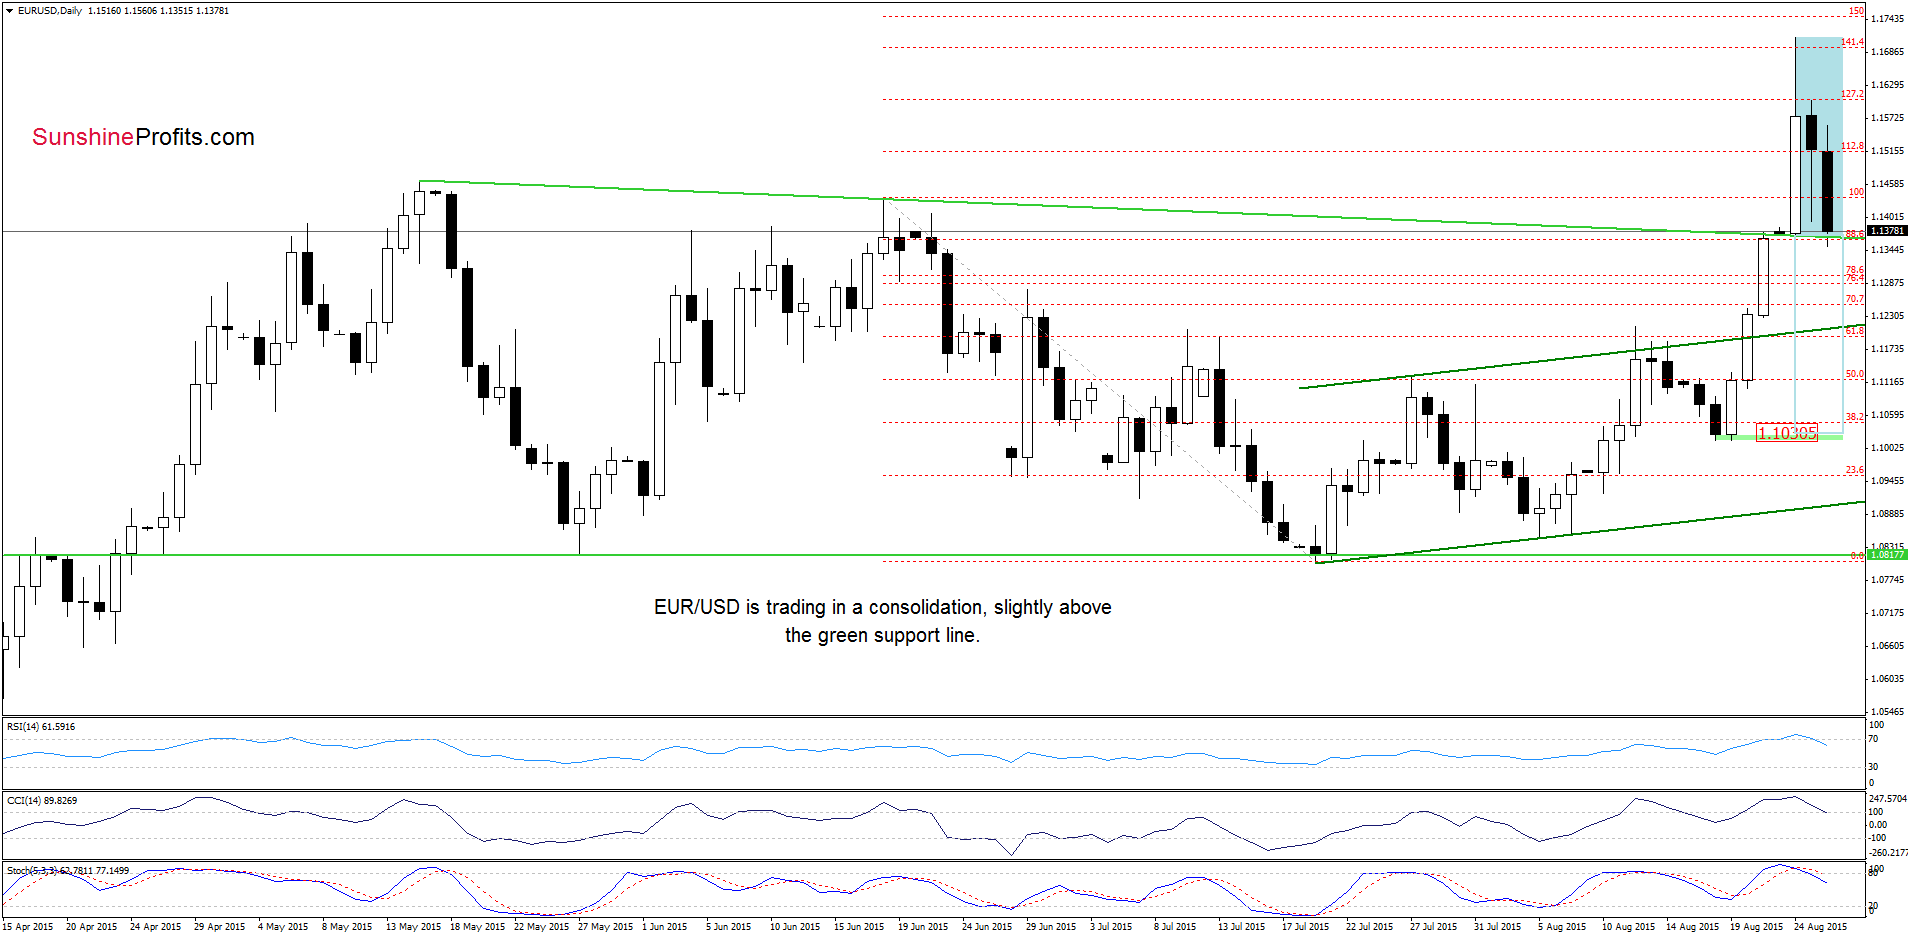
From this perspective we see that EUR/USD moved lower earlier today, but the pair is still trading in the blue consolidation, slightly above the green support line. Nevertheless, taking into account the current position of the indicators (they all generated sell signals), we think that currency bears will try push the pair lower and close the day below the green support line based on the May and June highs (marked on the daily chart). If they succeed, the next downside target would be around 1.1206, (the previously-broken upper line of the rising trend channel) or we may see a decline even to around 1.1030, where the size of the downward move will correspond to the height of the formation and where the mid-Aug lows are.
Very short-term outlook: mixed with bearish bias
Short-term outlook: mixed with bearish bias
MT outlook: mixed with bearish bias
LT outlook: mixed
Trading position (short-term; our opinion): No positions are justified from the risk/reward perspective at the moment. Nevertheless, if we see a daily close under the green support line based on the May and June highs, we’ll consider short positions. We will keep you informed should anything change, or should we see a confirmation/invalidation of the above.
GBP/USD
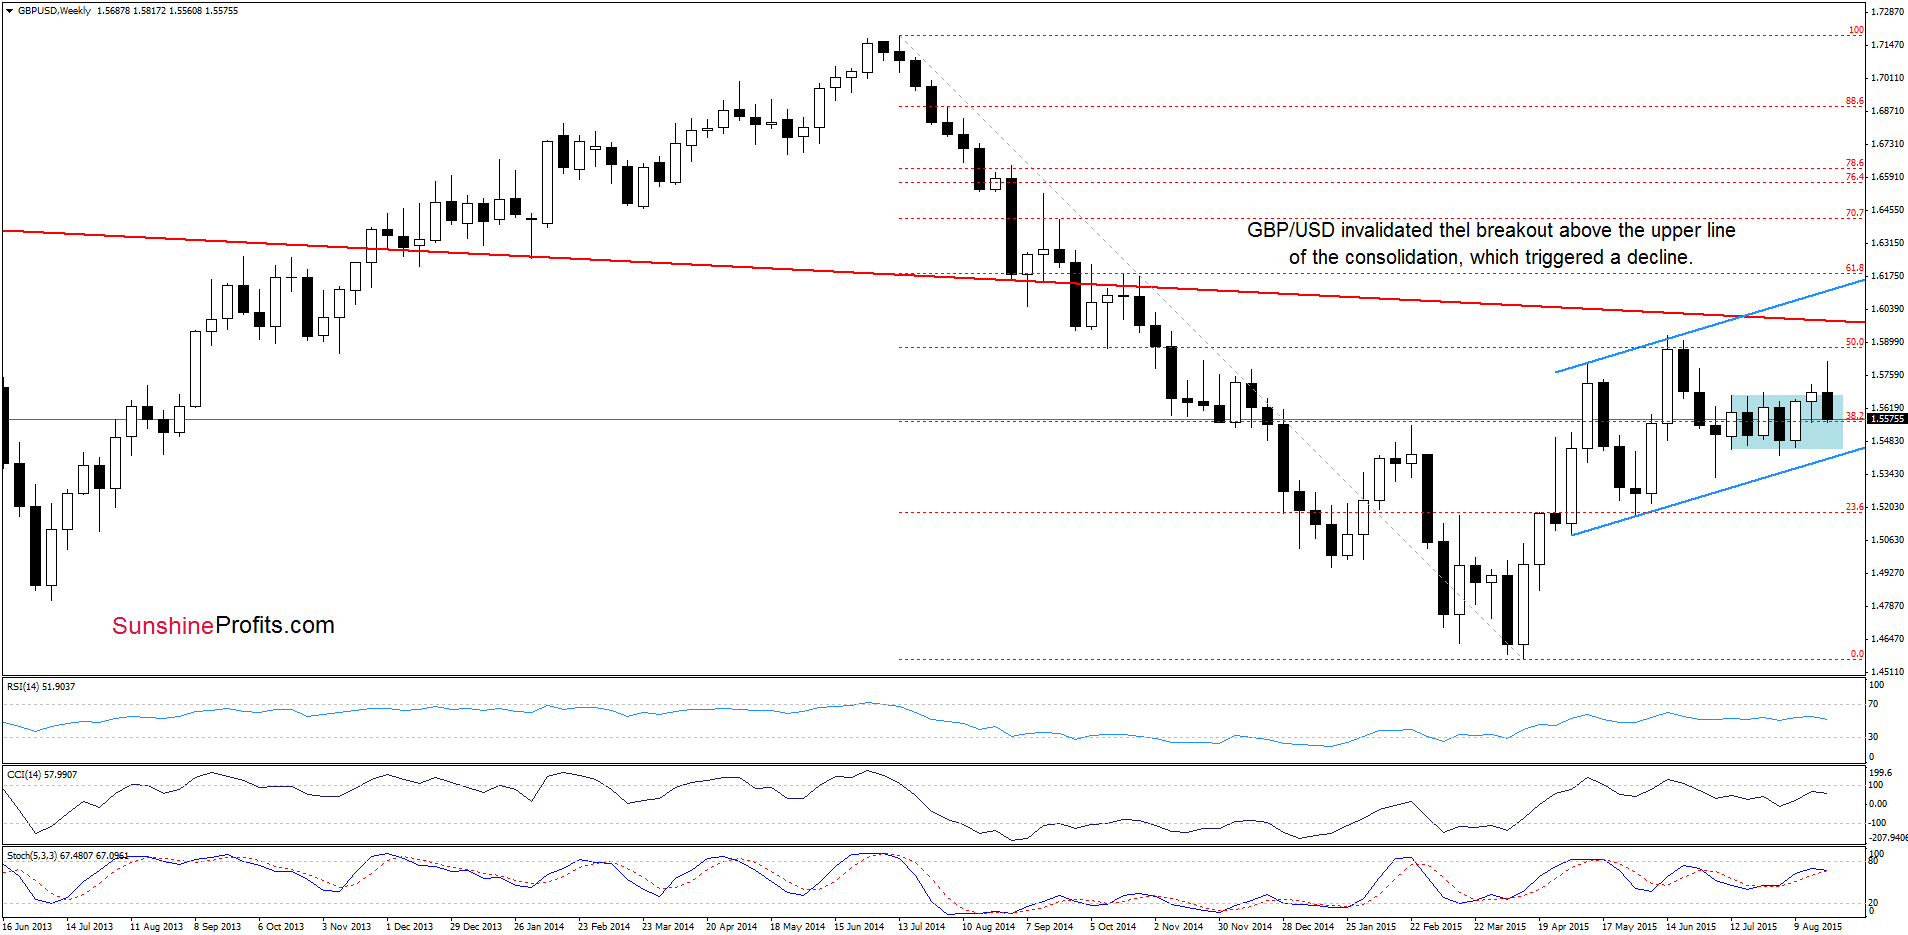
Looking at the weekly chart we see that GBP/USD invalidated earlier breakout above the upper border of the consolidation, which suggests that further declines are just around the corner.
Will the very short-term picture confirm the above? Let’s check.
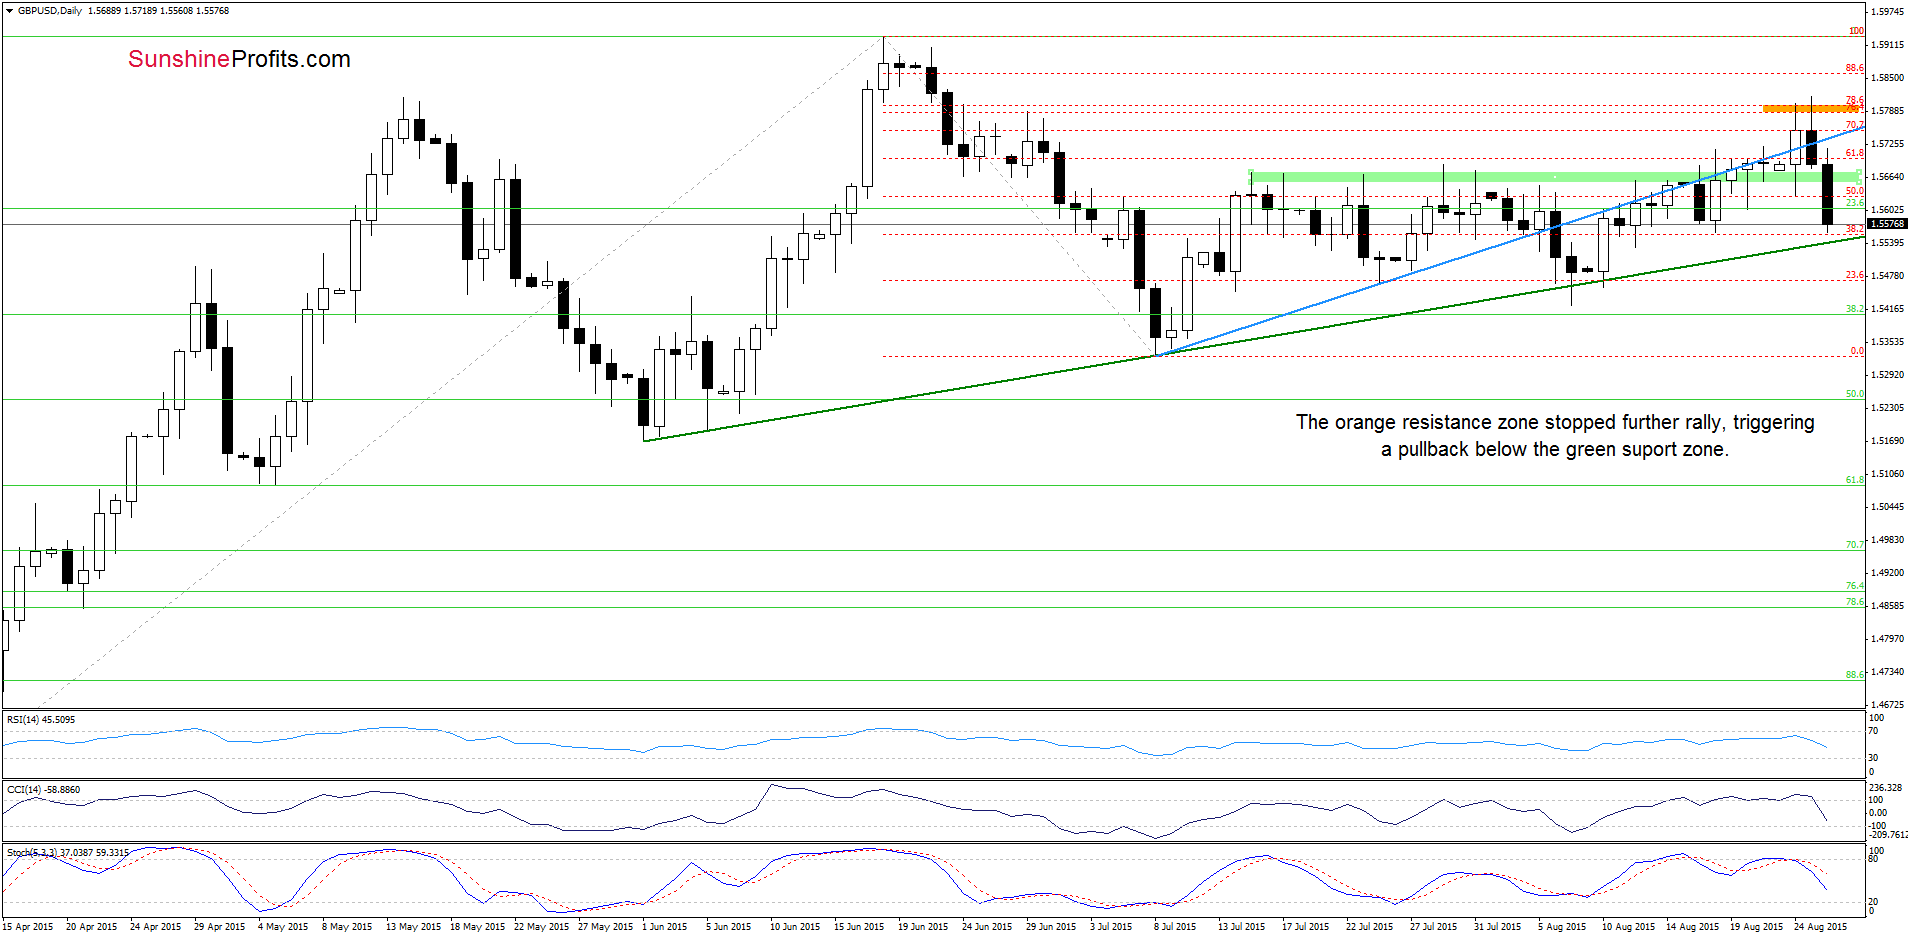
Looking at the daily chart we see that although GBP/USD moved higher in previous days, the orange resistance zone created by the 76.4% and 78.6% Fibonacci retracements successfully stopped further improvement, triggering a pullback, which took the pair under the blue line. This negative signal encouraged currency bears to act, which resulted in a sharp decline earlier today. What’s next? We think that the best answer to this question will be the quote from our Monday’s alert:
(…) it seems that the next move will be to the downside. In this case, the initial target for currency bears would be the green support line (…).
Very short-term outlook: mixed with bearish bias
Short-term outlook: mixed
MT outlook: mixed
LT outlook: mixed
Trading position (short-term; our opinion): No positions are justified from the risk/reward perspective at the moment. We will keep you informed should anything change, or should we see a confirmation/invalidation of the above.
USD/CHF
Quoting our last commentary on this currency pair:
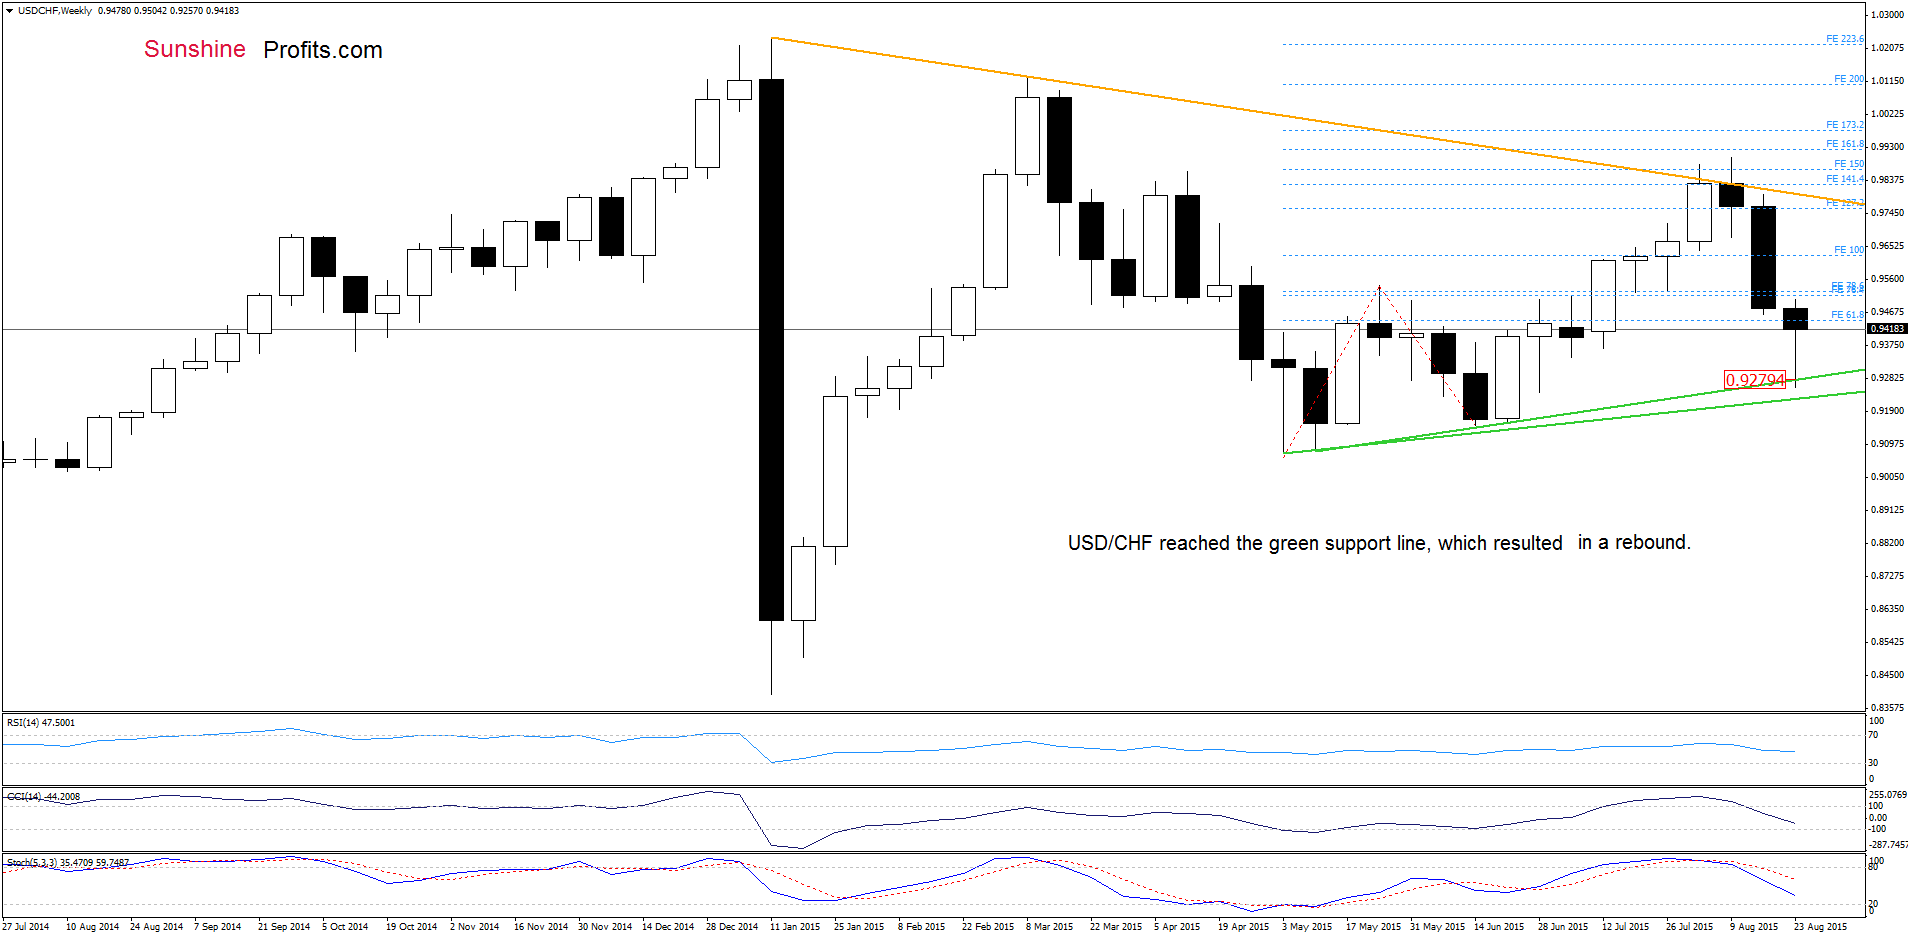
(…) the pair reached the green support zone (…) What could happen if this support area is broken?
(…) On the weekly chart, we see that USD/CHF is still trading under the previously-broken orange resistance line, which suggests that another attempt to move lower (especially when we factor in the current position of the indicators) is likely. Therefore, if the pair moves lower from here, the next downside target would be around 0.9279, where the upper green support line is.
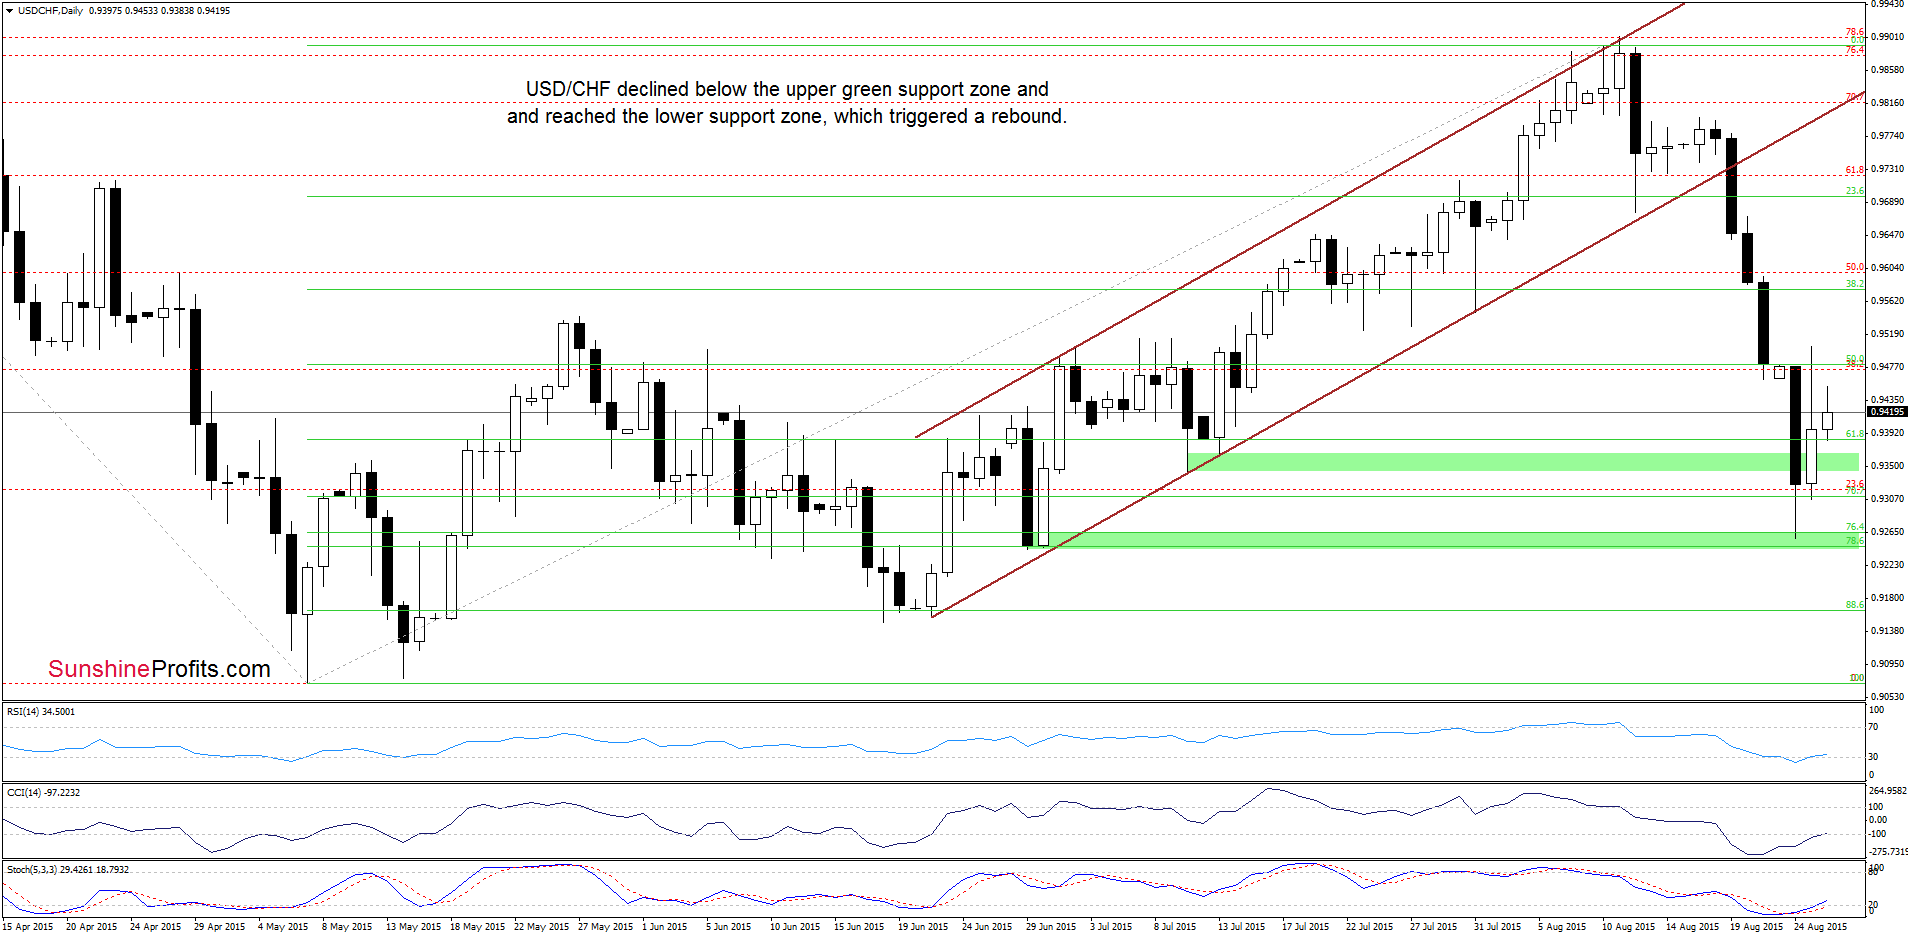
From today’s point of view, we see that the situation developed in line with the above scenario and USD/CHF reached our downside target. As you see on the charts the green support line in combination with the next green support zone (created by the 76.4% and 78.6% Fibonacci retracement levels) encouraged currency bulls to act, which resulted in an upward move that invalidated earlier breakdown under the upper green zone. Taking this positive factor into account and the current position of the indicators (they all generated buy signals), it seems that higher values of the exchange rate are ahead us. If this is the case and the pair extends gains the initial upside target would be around yesterday’s high, where the 38.2% Fibonacci retracement (based on the entire recent decline) is. If it is broken, we may see a rally to around 0.9577, where the next Fibonacci retracement is.
Very short-term outlook: mixed with bullish bias
Short-term outlook: mixed with bullish bias
MT outlook: mixed
LT outlook: mixed
Trading position (short-term; our opinion): No positions are justified from the risk/reward perspective at the moment. We will keep you informed should anything change, or should we see a confirmation/invalidation of the above.
Thank you.
Nadia Simmons
Forex & Oil Trading Strategist
Przemyslaw Radomski, CFA
Founder, Editor-in-chief
Gold & Silver Trading Alerts
Forex Trading Alerts
Oil Investment Updates
Oil Trading Alerts

