

Yesterday’s data showed that wholesale sales declined by 1.0% in May, missing analysts’ expectations for a 0.1% gain, which pushed USD/CAD to its highest levels since Mar 2009. Will we see higher values of the exchange rate in the coming days?
In our opinion the following forex trading positions are justified - summary:
- EUR/USD: short (stop-loss order at 1.1058)
- GBP/USD: none
- USD/JPY: none
- USD/CAD: none
- USD/CHF: none
- AUD/USD: none
EUR/USD
The medium-term picture remains almost unchanged as EUR/USD is trading under the previously-broken lower border of the blue consolidation. Today, we’ll focus on the very short-term changes.
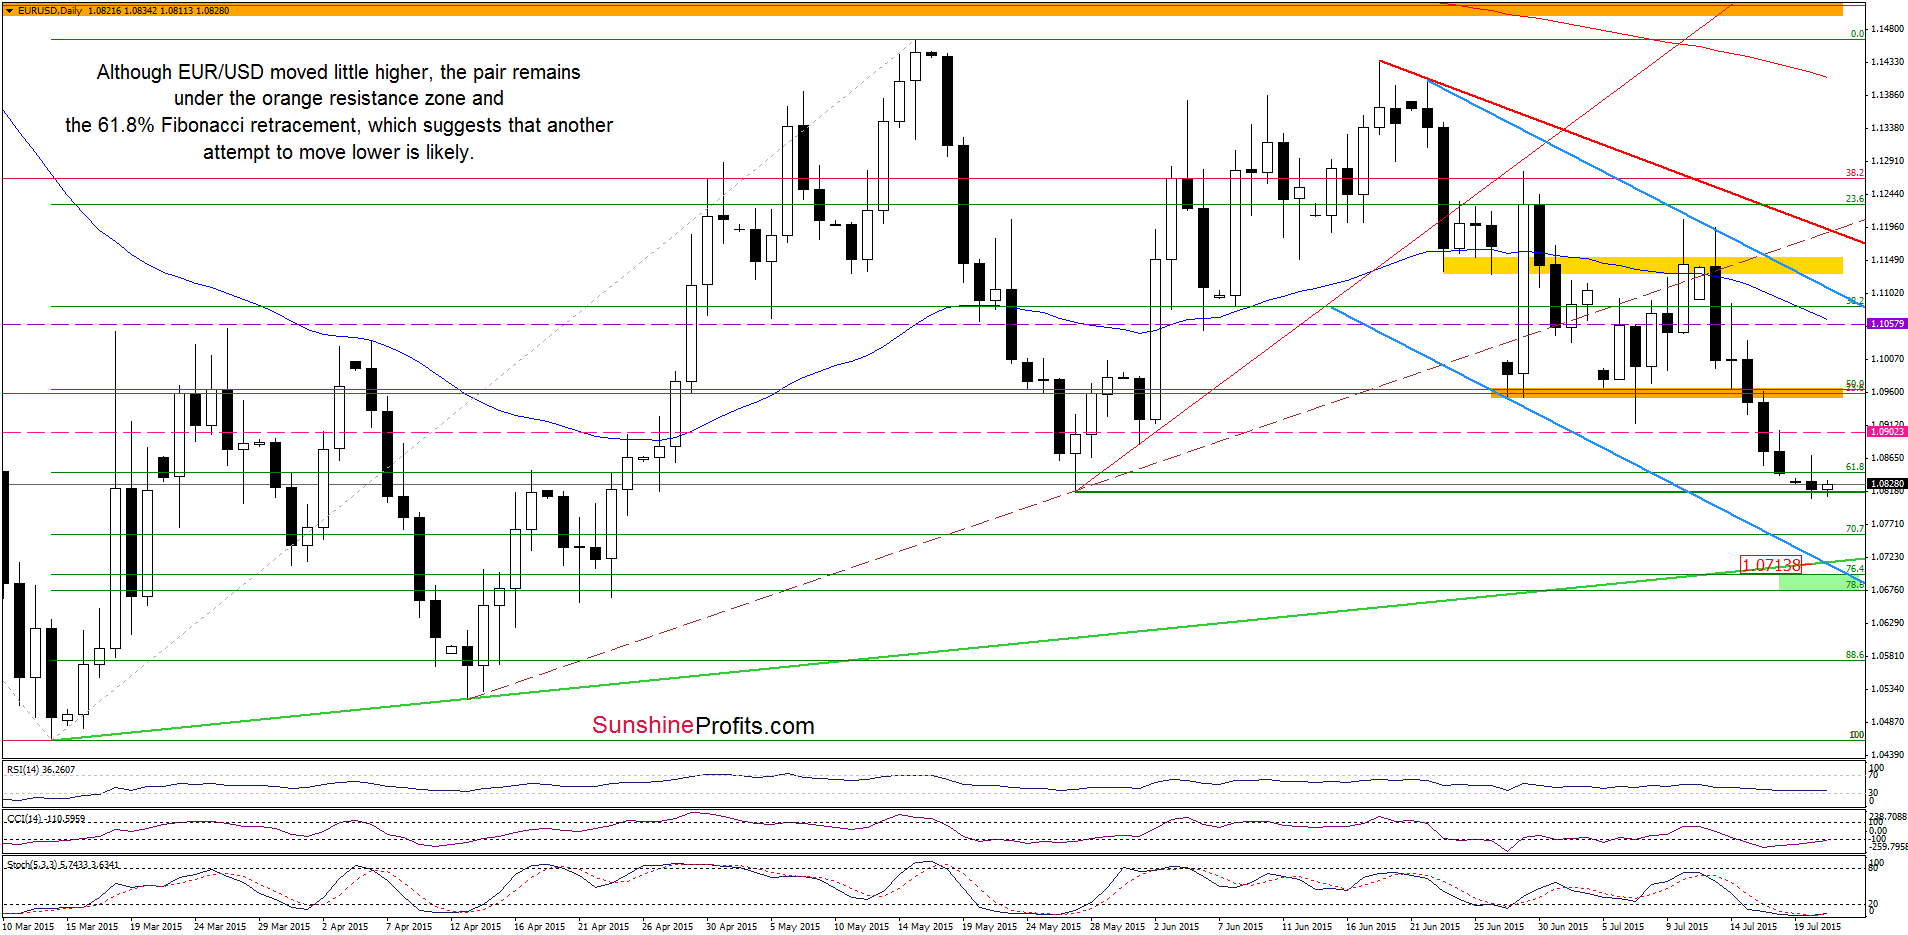
Looking at the daily chart, we see that today’s price action is very similar to what we saw yesterday – EUR/USD is trading slightly above the May low, but under the 61.8% Fibonacci retracement and well below the orange resistance zone. Therefore, we believe that our previous commentary on this currency pair is up-to-date:
(…) another test of the May low is more likely than not. What’s next? If this support is broken, we may see a decline to the medium-term green support line (…) or even to 1.0676-1.0698, where the green support zone (created by the 76.4% and 78.6% Fibonacci retracement levels) is.
Very short-term outlook: bearish
Short-term outlook: mixed with bearish bias
MT outlook: mixed
LT outlook: mixed
Trading position (short-term; our opinion): Short positions with a stop-loss order at 1.1058 are justified from the risk/reward perspective at the moment. We will keep you informed should anything change, or should we see a confirmation/invalidation of the above.
USD/CAD
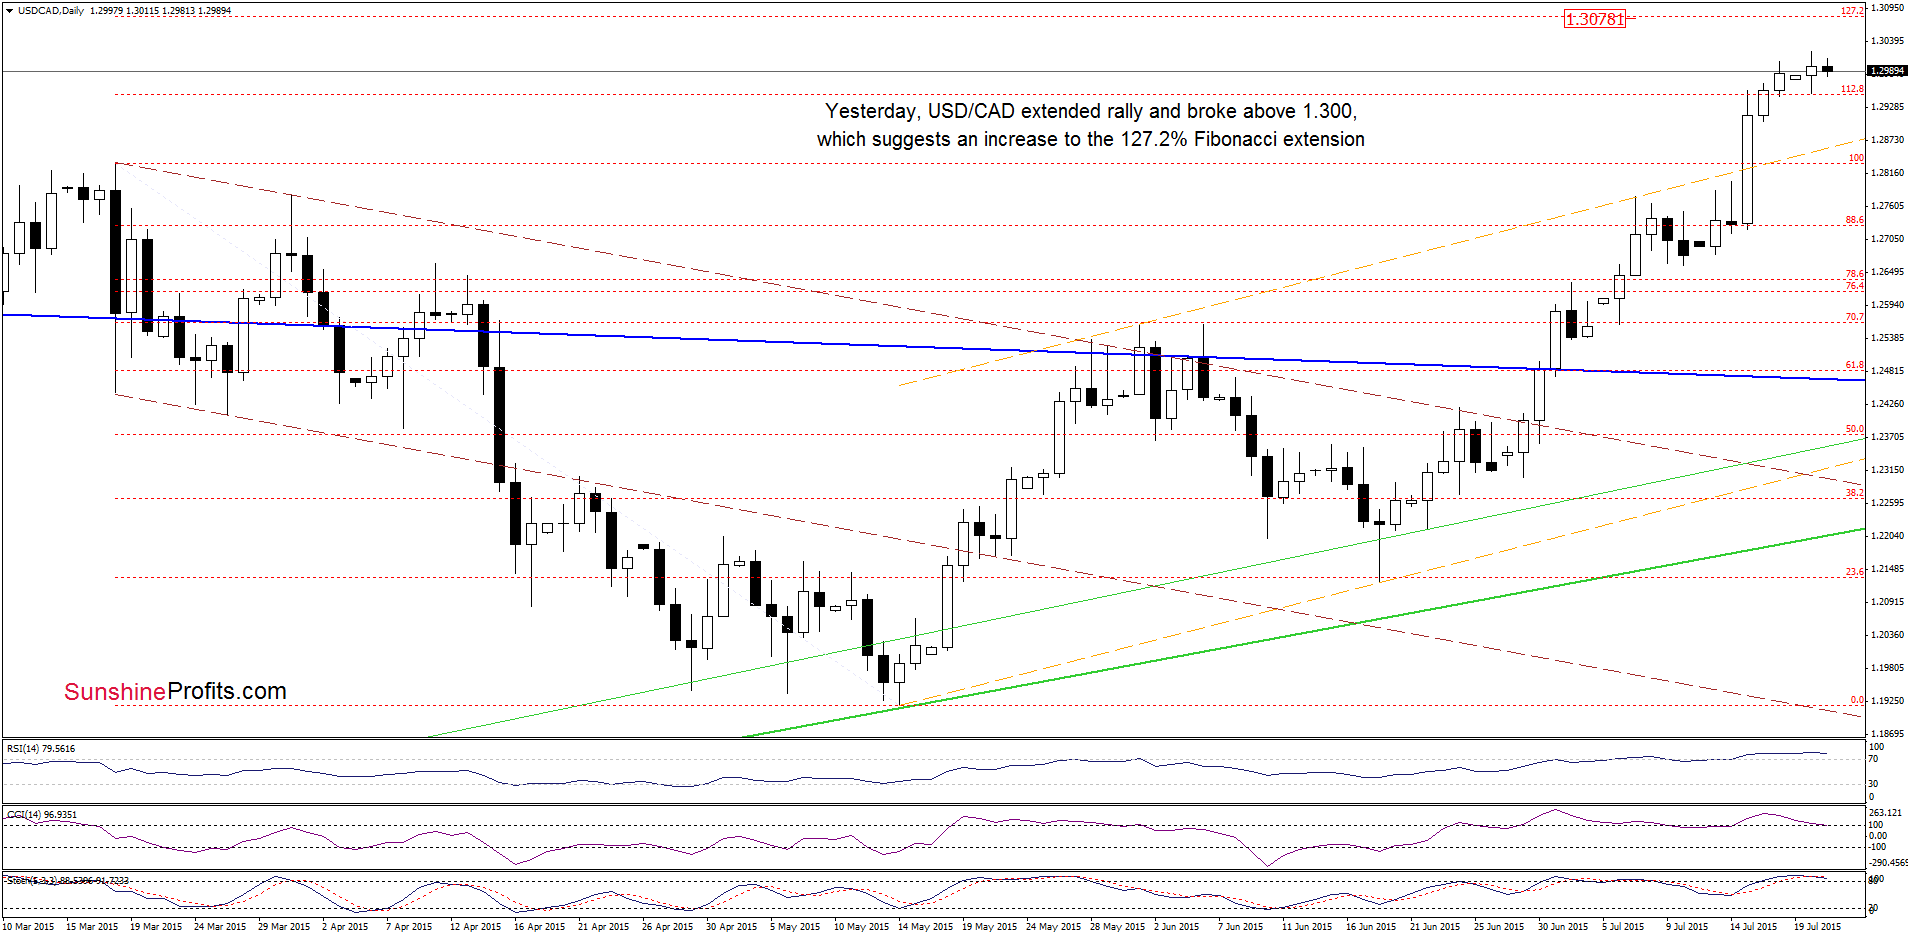
Yesterday, USD/CAD extended rally and broke above the psychological barrier of 1,300, which suggests further improvement and an increase to around 1.3078, where the 127.2% Fibonacci extension is. But will we see such price action? Looking at the current position of the indicators, we see that the RSI remains around the level of 80, the Stochastic Oscillator is extremely overbought (around 90) and there is clearly visible negative divergence between the CCI and the exchange rate, which suggests that we may see a reversal and lower values of USD/CAD in the coming days.
Are there any other factors that could encourage currency bears to act? Let’s examine the weekly chart and find out.
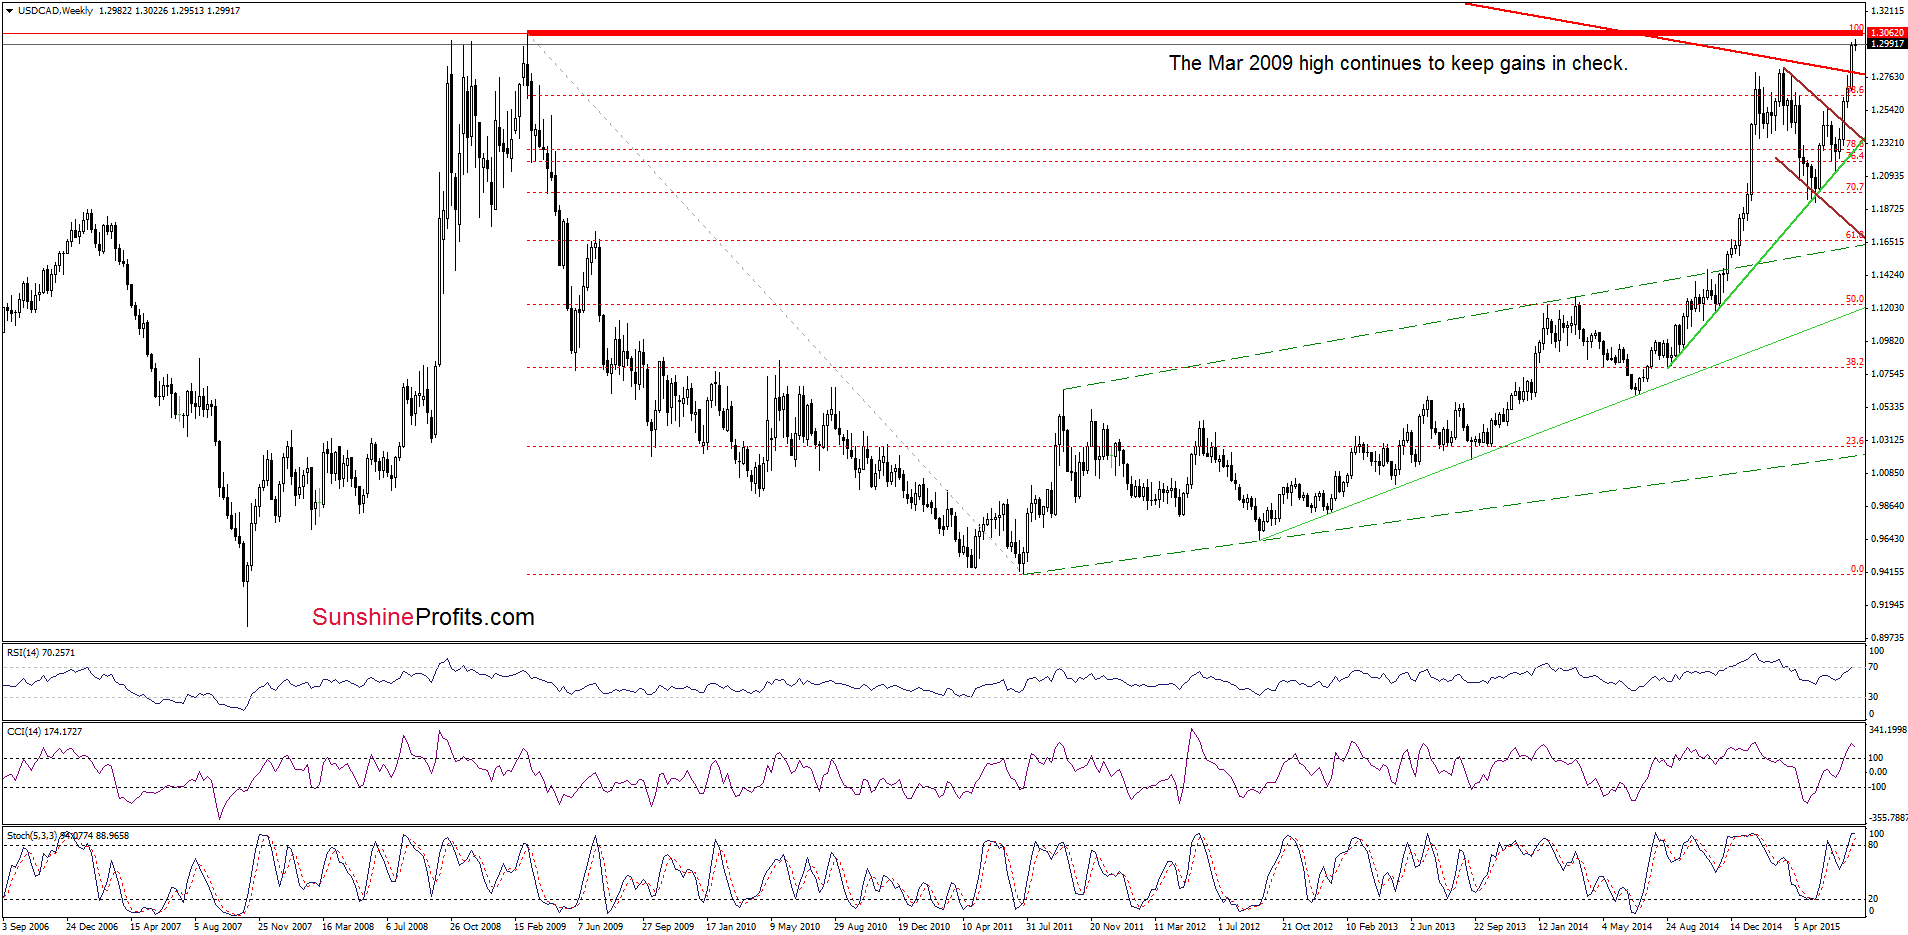
From this perspective, we see that although USD/CAD remains above the previously-broken long-term red declining resistance line, the pair is trading under the Mar 2009 high, which serves as the nearest medium-term resistance. Therefore, we think that as long as the exchange rate remains below it further rally is questionable. Additionally, there are negative divergences between the RSI, CCI and USD/CAD (while the Stochastic Oscillator is overbought), which increases the probability of reversal in the coming week.
Very short-term outlook: mixed
Short-term outlook: mixed with bearish bias
MT outlook: mixed with bearish bias
LT outlook: mixed
Trading position (short-term; our opinion): No positions are justified from the risk/reward perspective at the moment. We will keep you informed should anything change, or should we see a confirmation/invalidation of the above.
USD/CHF
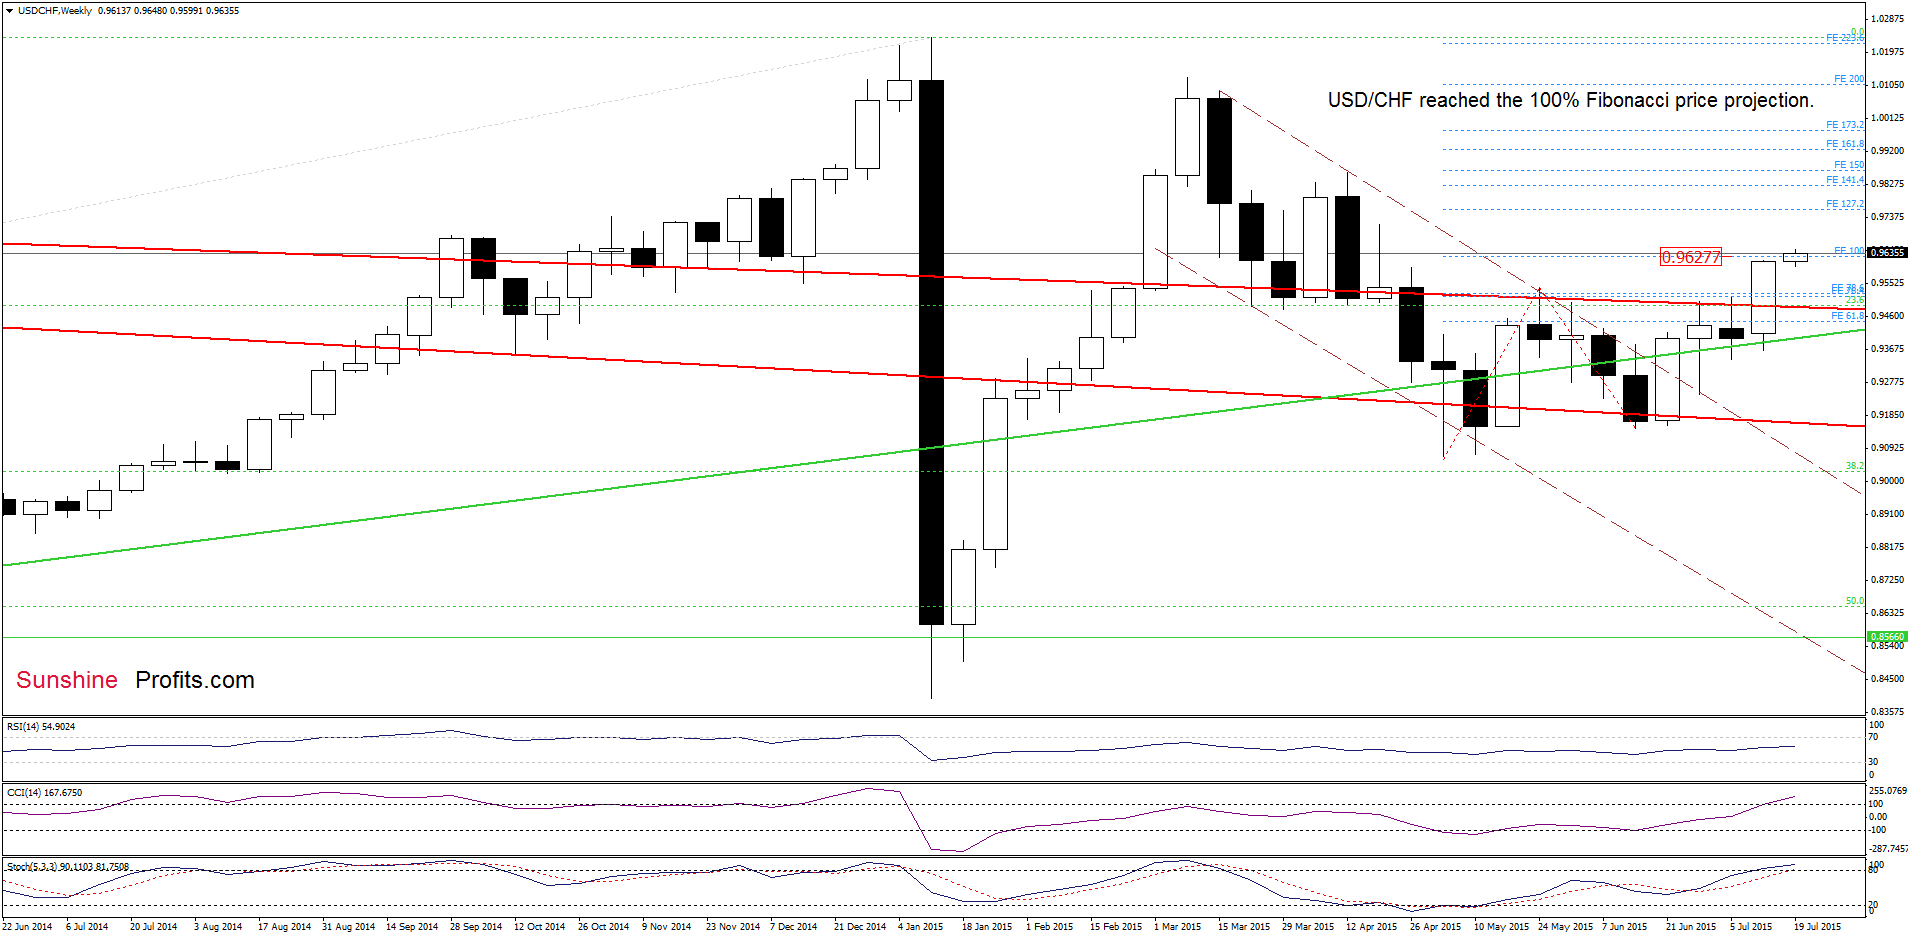
Quoting our Friday’s alert:
(…) as long as there are no sell signals generated by the indicators another attempt to move higher is likely. If this is the case, and the pair increases from here, we may see an upswing to around 0.9627 (the 100% Fibonacci price projection marked with blue on the weekly chart)
As you see on the weekly chart the situation developed in line with the above scenario and USD/CHF not only reached our upside target, but currency bulls managed to push the pair even higher.
Where will the pair head next? Let’s take a closer look at the daily chart and find out.
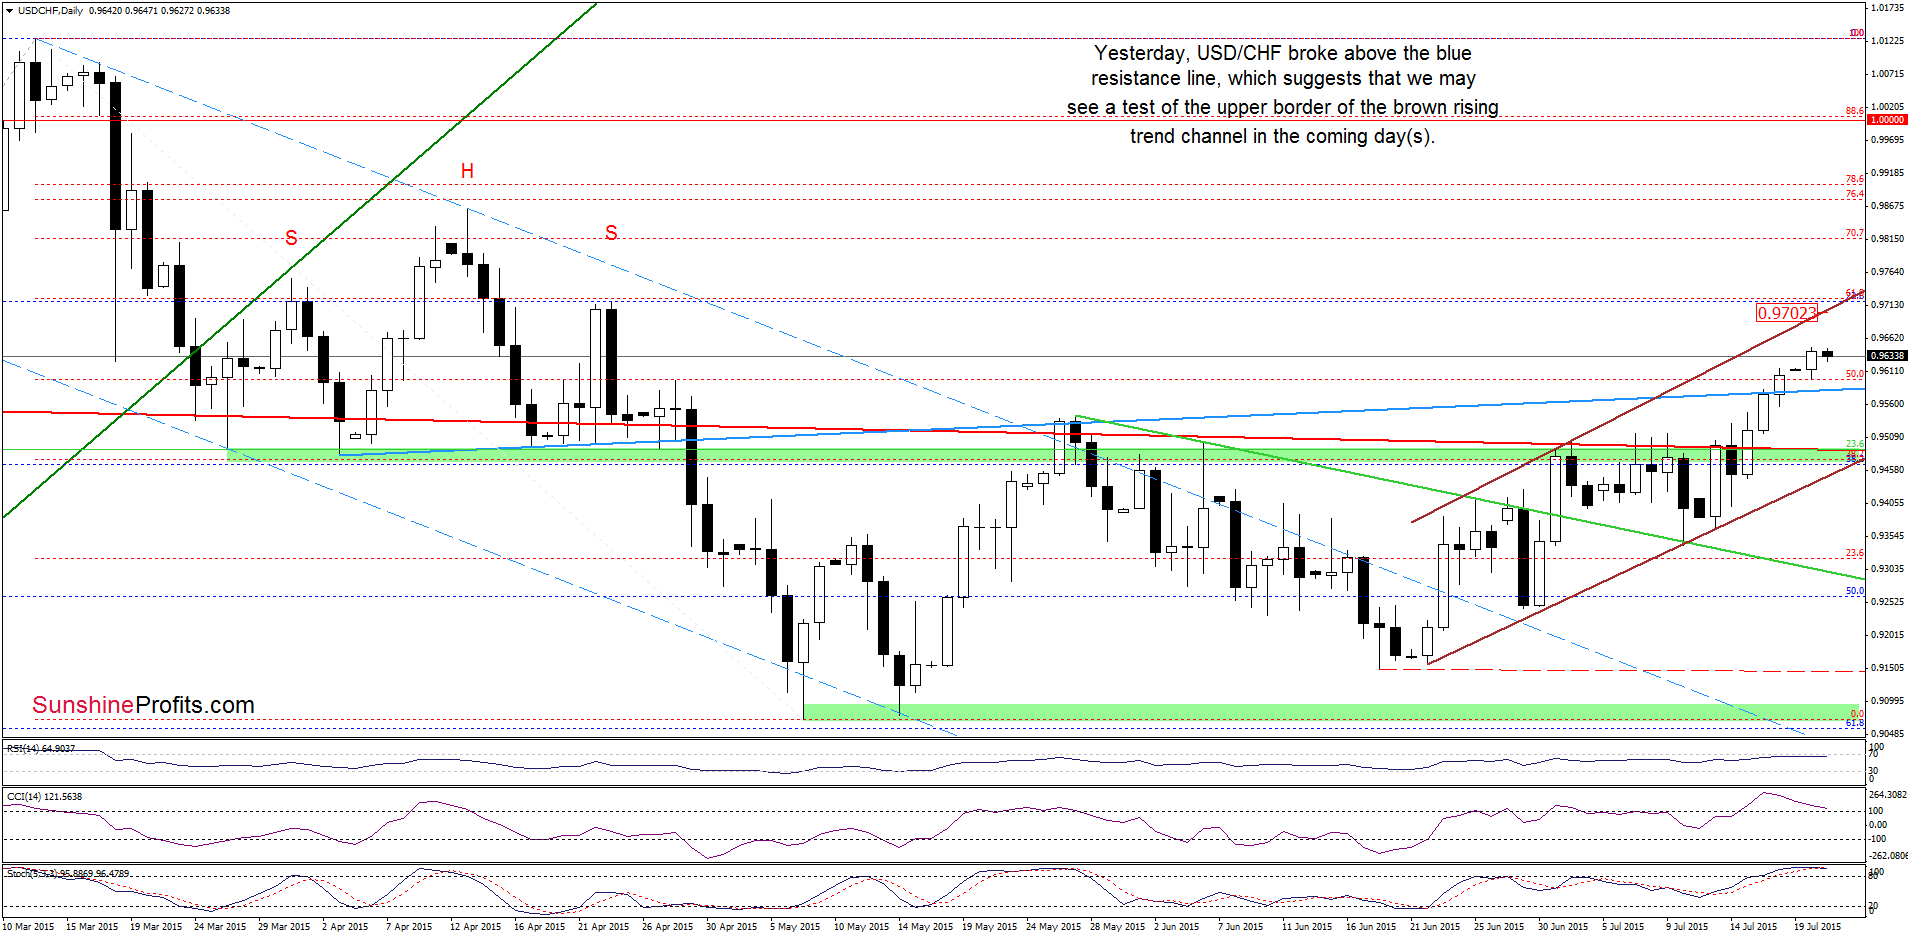
From this perspective, we see that USD/CHF moved higher once again and broke above the blue line (the previously-broken neck line of the head and shoulders formation), which encouraged currency bulls to act. As a result, the exchange rate climbed above the 50% Fibonacci retracement, which suggests that we may see an upswing even to the upper border of the rising trend channel (currently around 0.9702) in the coming days. Nevertheless, we should keep in mind that the current position of the indicators (there is clearly visible negative divergence between the CCI and the exchange rate, while the Stochastic Oscillator is extremely overbought and very close to generating a sell signal) suggests that a reversal is just around the corner.
Very short-term outlook: mixed
Short-term outlook: mixed
MT outlook: mixed
LT outlook: mixed
Trading position (short-term; our opinion): No positions are justified from the risk/reward perspective at the moment. We will keep you informed should anything change, or should we see a confirmation/invalidation of the above.
Thank you.
Nadia Simmons
Forex & Oil Trading Strategist
Przemyslaw Radomski, CFA
Founder, Editor-in-chief
Gold & Silver Trading Alerts
Forex Trading Alerts
Oil Investment Updates
Oil Trading Alerts

