

Earlier today, the Markit’s report showed that its manufacturing PMI climbed to a 10-month high of 52.2 in March, while factory input prices rose for the first time in seven months and selling prices were broadly stable. In response to this positive news EUR/USD bounced off session’s lows, but did this increase change anything in the short-term picture of the exchange rate?
In our opinion the following forex trading positions are justified - summary:
- EUR/USD: none
- GBP/USD: none
- USD/JPY: none
- USD/CAD: short (stop loss order at 1.2876)
- USD/CHF: none
- AUD/USD: none
EUR/USD
The sitution in the medium term hasn’t changed much as EUR/USD still remains above the previously-broken the long-term green support/resistance line. Today, we’ll examine the daily chart and look for more clues about future moves.
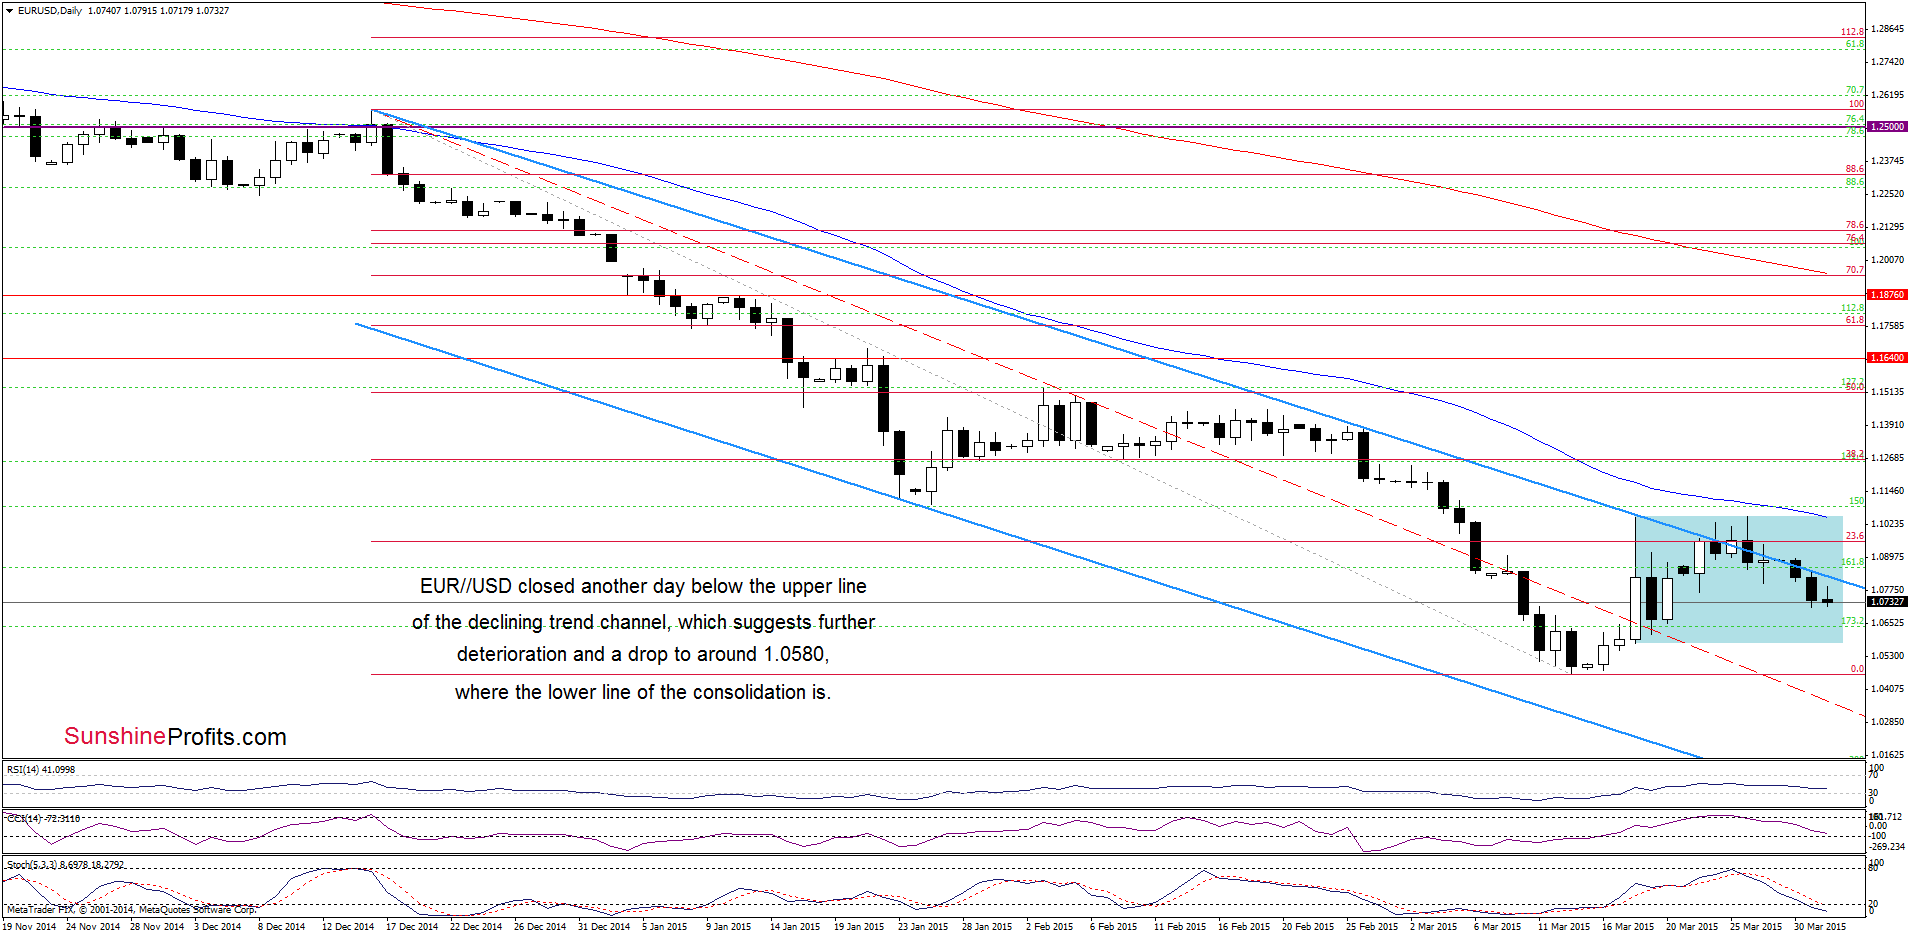
Looking at the daily chart, we see that EUR/USD closed another day under the upper line of the declining trend channel, which means that what we wrote on Monday is up-to-date:
(…) EUR/USD came back to the trend channel, which is a negative signal. In our opinion, if the pair closes the day below the upper line of the formation, we might see further deterioration and a drop to around 1.0580, where the lower line of the consolidation (and the Mar 18 low) is. At this point, it is worth noting that sell signals generated by the CCI and Stochastic Oscillator are still in place, supporting the bearish case.
Very short-term outlook: bearish
Short-term outlook: mixed
MT outlook: mixed
LT outlook: mixed
Trading position (short-term; our opinion): No positions are justified from the risk/reward perspective at the moment. We will keep you informed should anything change, or should we see a confirmation/invalidation of the above.
USD/JPY
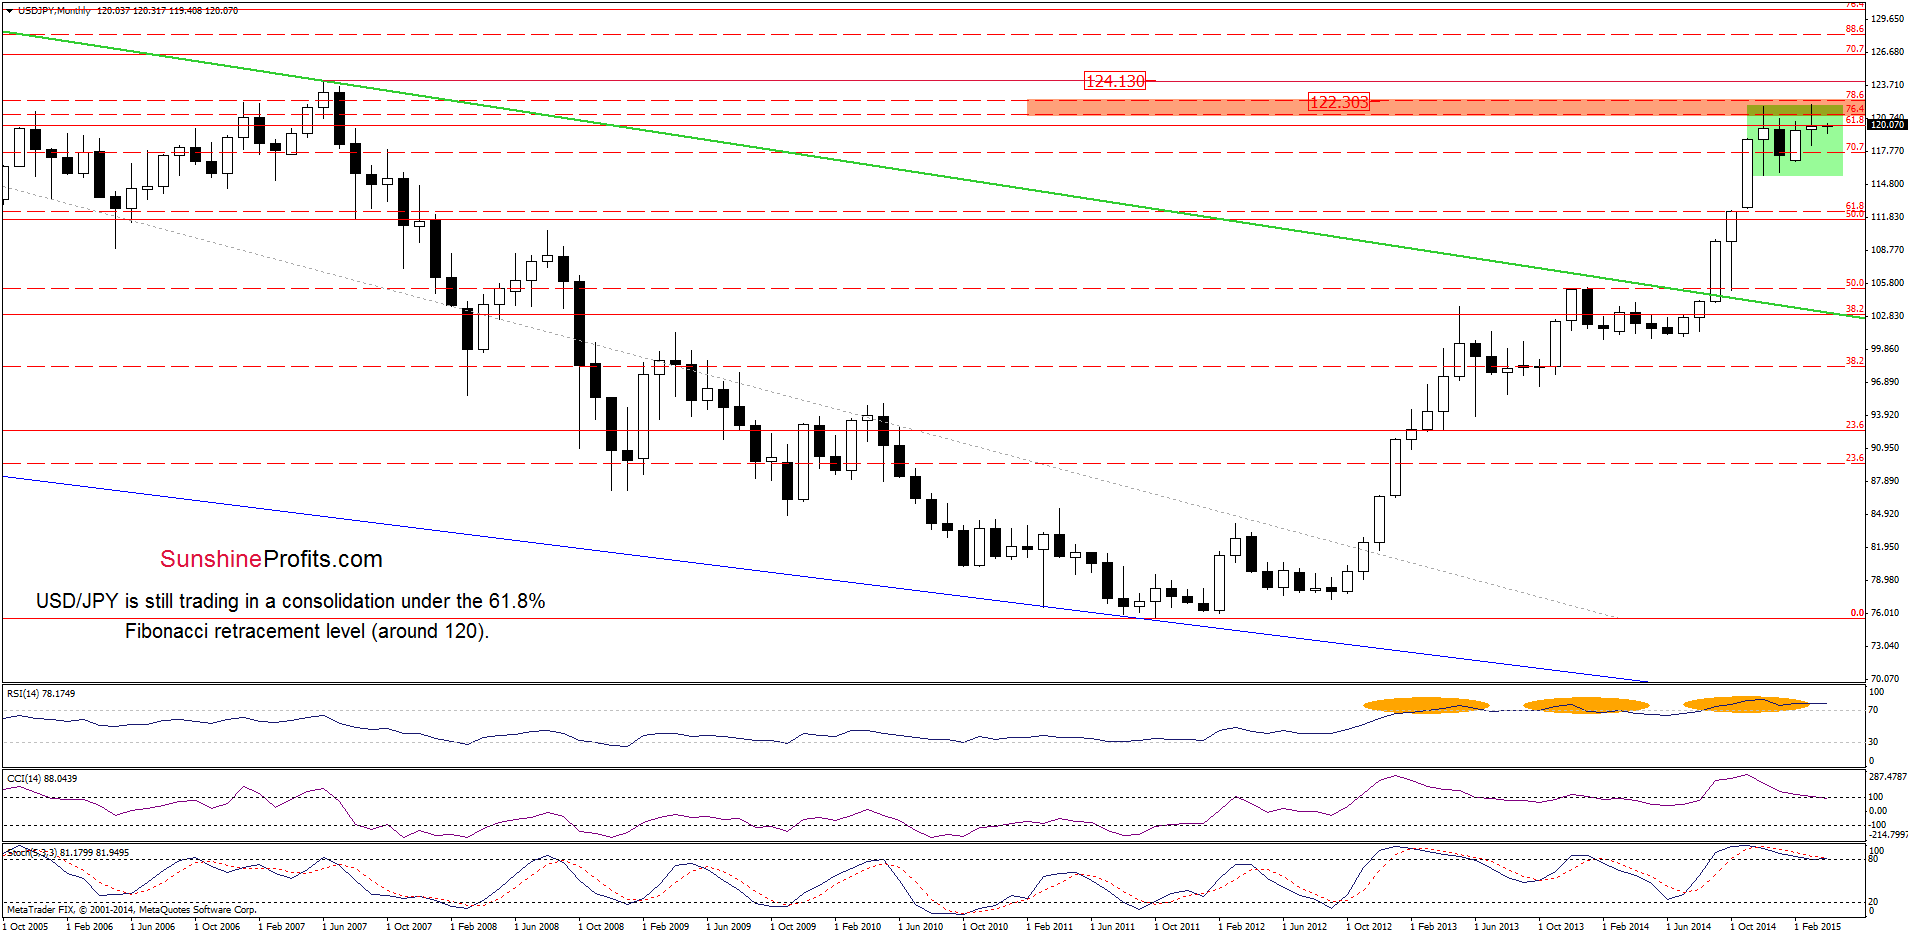
On the above chart, we see that USD/JPY is still trading in a consolidation (between the Dec high and low) around the 61.8% Fibonacci retracement level (based on the entire 1998-2011 declines), which makes the situation a bit unclear. Nevertheless, the current position of the indicators suggests that a trend reversal in the coming month should not surprise us (especially when we factor in a sell signal generated by the CCI).
Having said that, let’s examine the daily chart.
On Monday, we wrote the following:
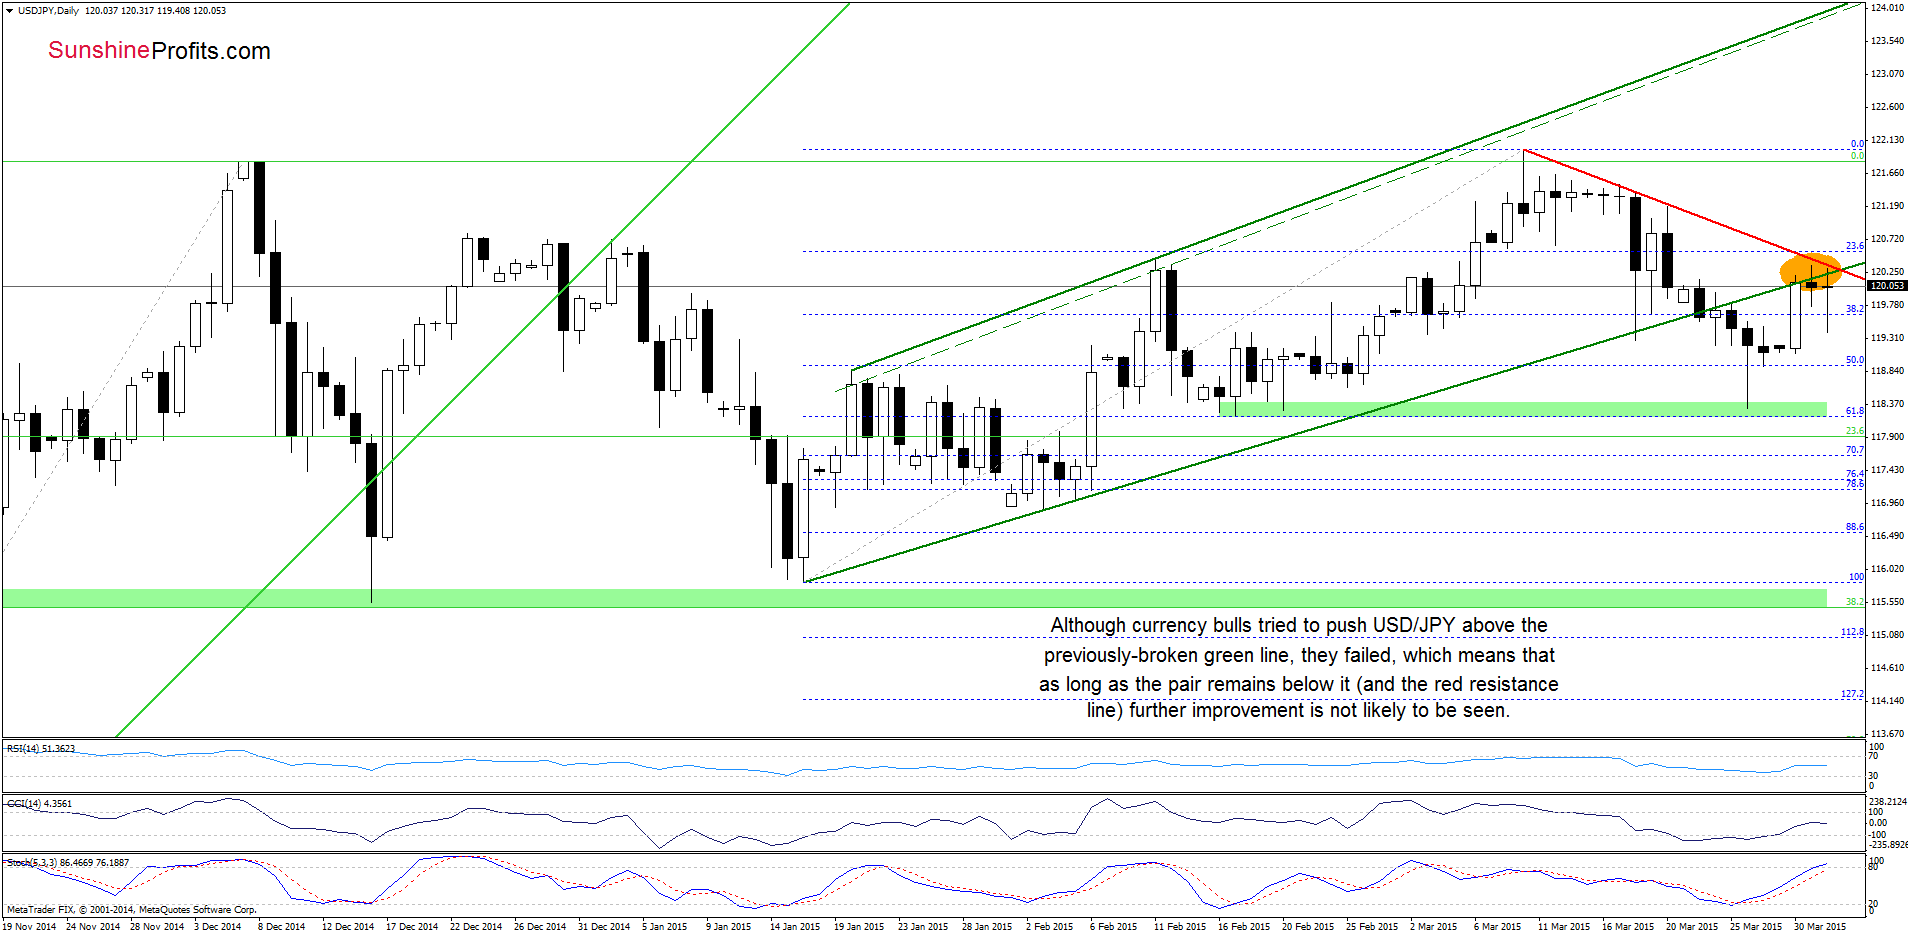
(…) What’s next? Taking into account buy signals generated by the indicators it seems that currency bulls will try to push the exchange rate higher. Nevertheless, we should keep in mind that even if they succeed, we won’t see a comeback to the last week’s high as long as the red resistance line is in play (currently around 120).
As you see on the daily chart, the situation developed in line with the above-mentioned scenario. Although there were three attempts to move higher, they all failed as the proximity to the red resistance line was enough to encourage currency bears to act. As a result, USD/JPY came back below the green support/resistance line, which means that as long as this resistance area (marked with orange ellipse) is in play further improvement is not likely to be seen (especially when we factor in the fact that the above-mentioned zone is also reinforced by the 61.8% Fibonacci retracement marked on the monthly chart).
Please note that the Stochastic Oscillator is almost overbought, which suggests that we’ll see a sell signal in the coming days. If this is the case and currency bulls won’t break above the orange resistance area, we’ll see a pullback to around 118.92-119.10 in the coming days.
Very short-term outlook: mixed with bearish bias
Short-term outlook: mixed
MT outlook: mixed
LT outlook: bullish
Trading position (short-term; our opinion): No positions are justified from the risk/reward perspective at the moment. We will keep you informed should anything change, or should we see a confirmation/invalidation of the above.
USD/CHF
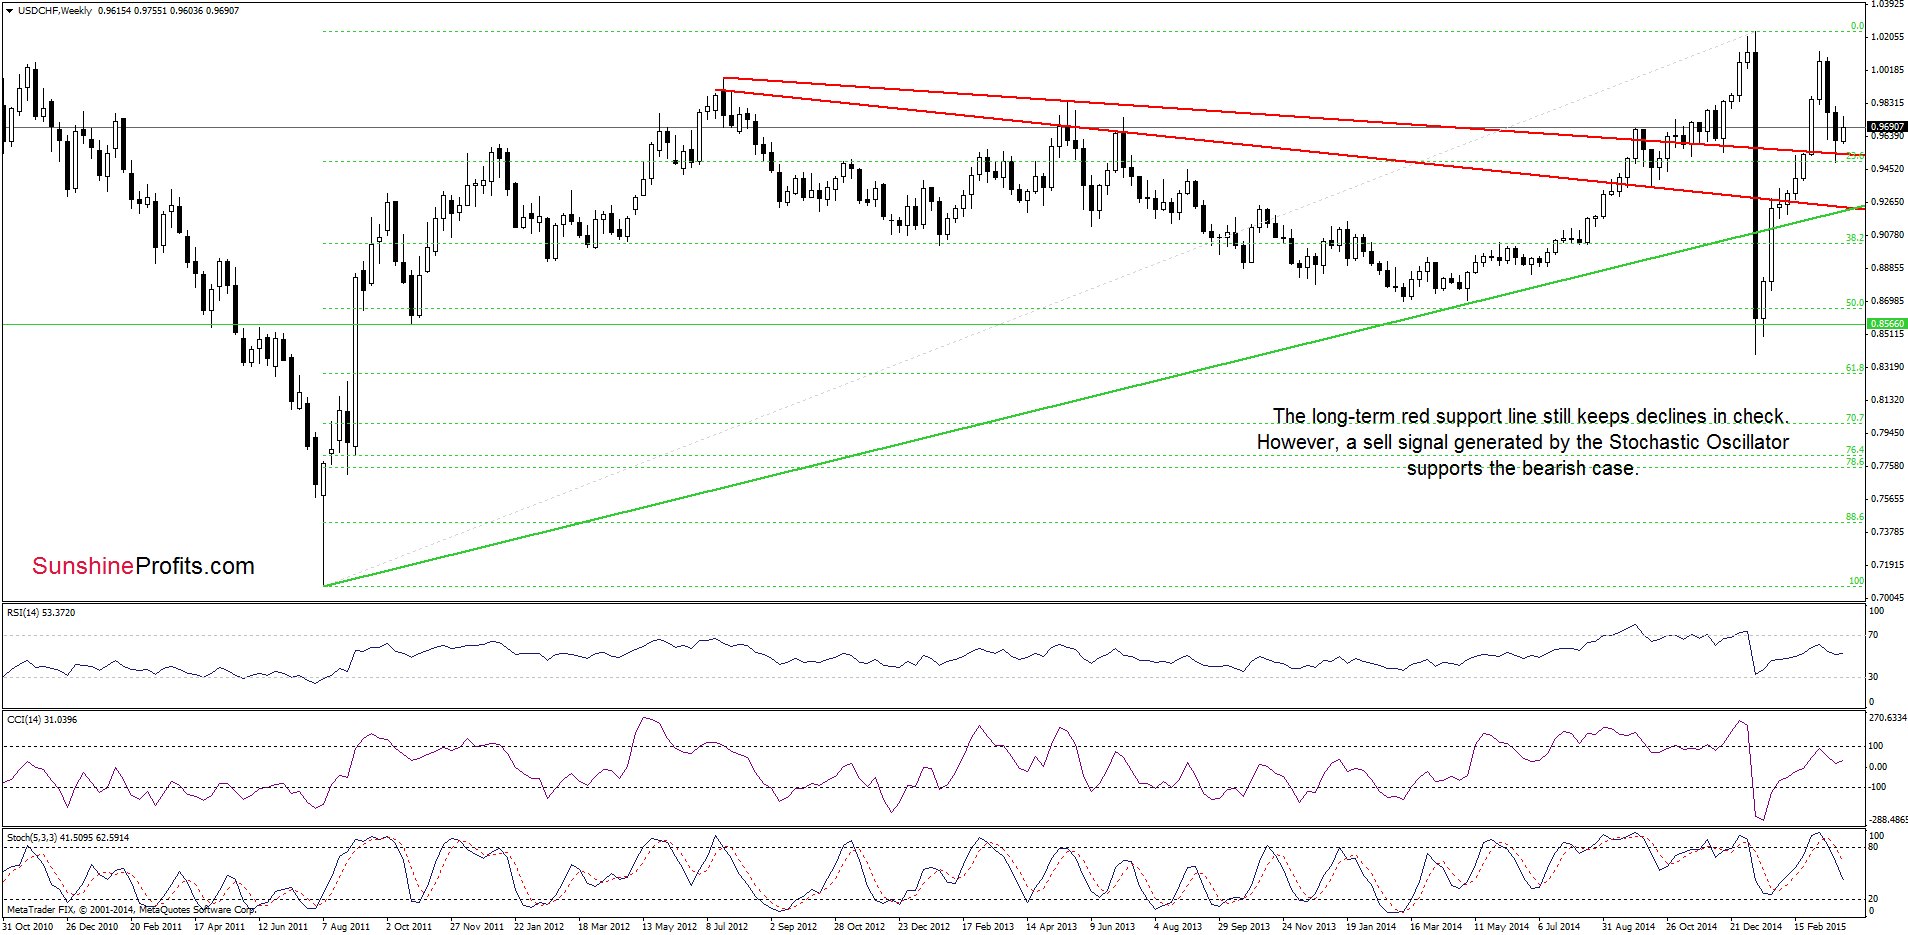
The situation in the medium-term perspective hasn’t changed much as USD/CHF still remains above the long-term red support line. Nevertheless, we should keep in mind that the sell signal generated by the Stochastic Oscillator is still in play, supporting the bearish case.
Having said that, let’s check what we can infer from the daily chart.
In our last commentary on this currency pair, we wrote the following:
(…) the CCI and Stochastic Oscillator generated buy signals, suggesting that currency bulls will try to push the pair higher in the coming week.
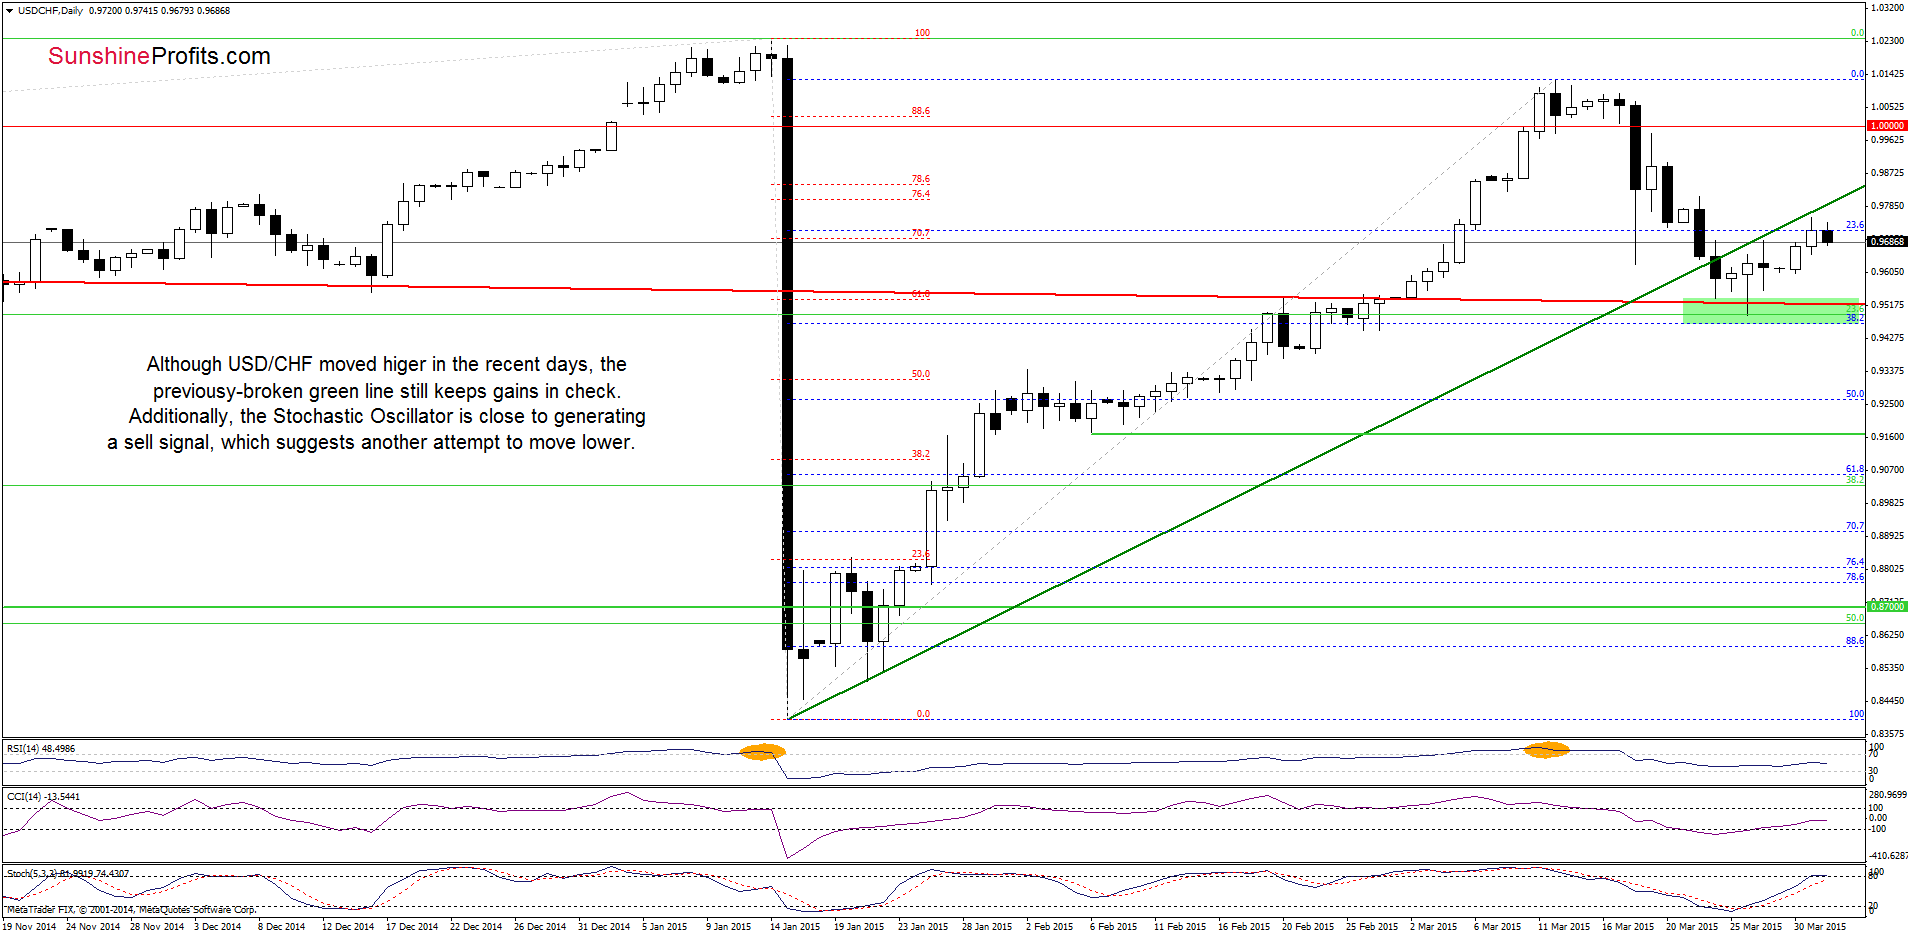
On the above chart we see that the situation developed in tune with the above-mentioned scenario and USD/CHF extended gains, approaching the previously-broken green support/resistance line. Despite this improvement, the proximity to this key resistance line triggered a pullback earlier today. This means that what we wrote on Monday remains valid:
(…) the exchange rate still remains under the green line. This suggests that as long as there is no comeback above it further improvement is questionable and another test of the strength of the long-term support line is likely.
Finishing today’s alert, please note that the Stochastic Oscillator is close to generating a sell signal, which supports the bearish scenario.
Very short-term outlook: mixed with bearish bias
Short-term outlook: mixed
MT outlook: mixed
LT outlook: bearish
Trading position (short-term; our opinion): No positions are justified from the risk/reward perspective at the moment. We will keep you informed should anything change, or should we see a confirmation/invalidation of the above.
Thank you.
Nadia Simmons
Forex & Oil Trading Strategist
Przemyslaw Radomski, CFA
Founder, Editor-in-chief
Gold & Silver Trading Alerts
Forex Trading Alerts
Oil Investment Updates
Oil Trading Alerts

