
Earlier today, the Office for National Statistics showed in a preliminary report that U.K. gross domestic product rose 0.7% in the third quarter. As a result, GBP/USD bounced off the support zone and climbed above 1.6050. What happened with other major currency pairs? Did the recent price moves change their short-term outlooks?
In our opinion the following forex trading positions are justified - summary:
- EUR/USD: none
- GBP/USD: none
- USD/JPY: none
- USD/CAD: none
- USD/CHF: none
- AUD/USD: long (stop-loss order: 0.8587; initial price target: 0.8943)
EUR/USD
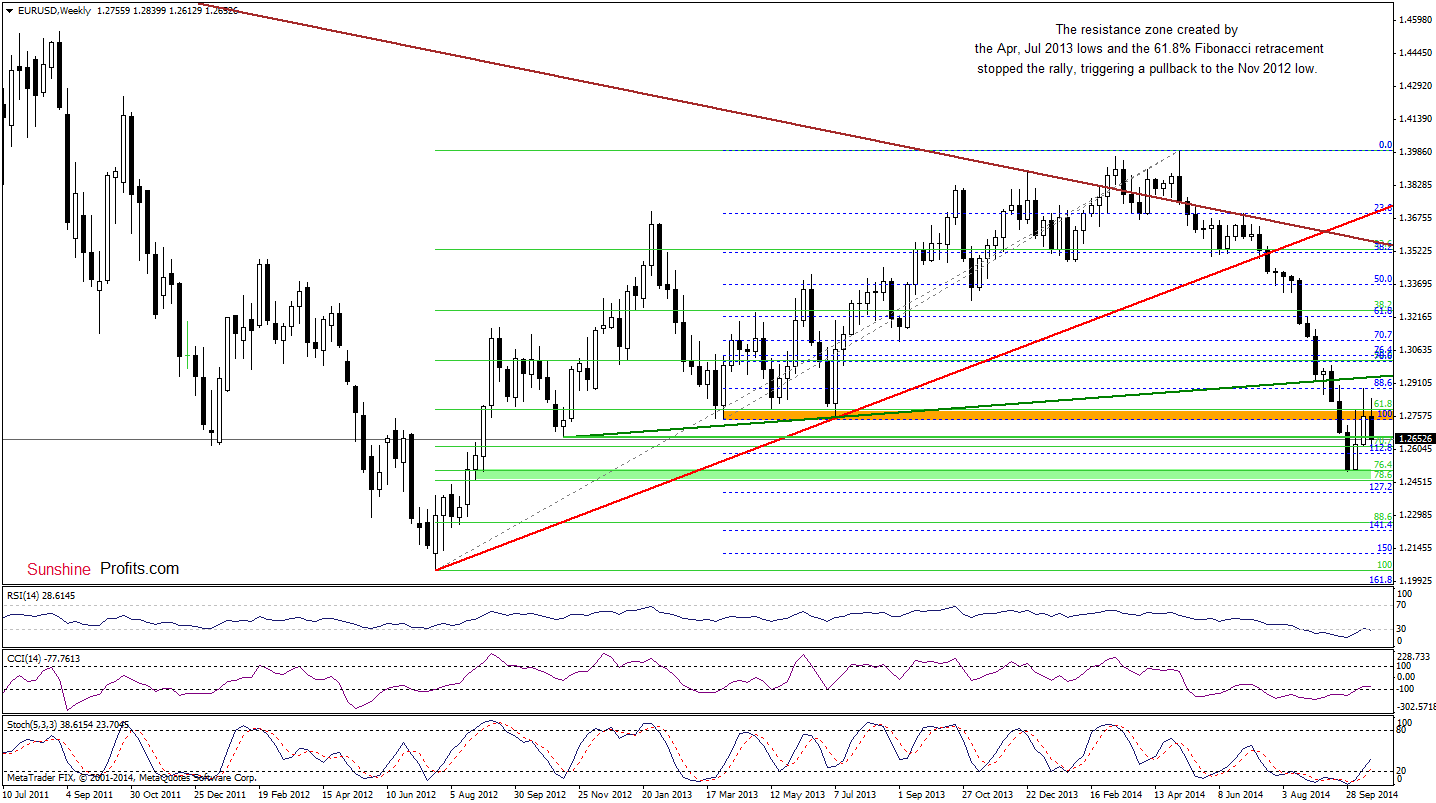
The situation in the medium term hasn’t changed much as EUR/USD is still trading around the Nov 2012 low. If the exchange rate moves lower and closes the week under this support, it seems that the pair will test the strength of the recent lows.
Are there any positive signs in the very short term that could stop currency bears? Let’s take a closer look at the daily chart and find out.
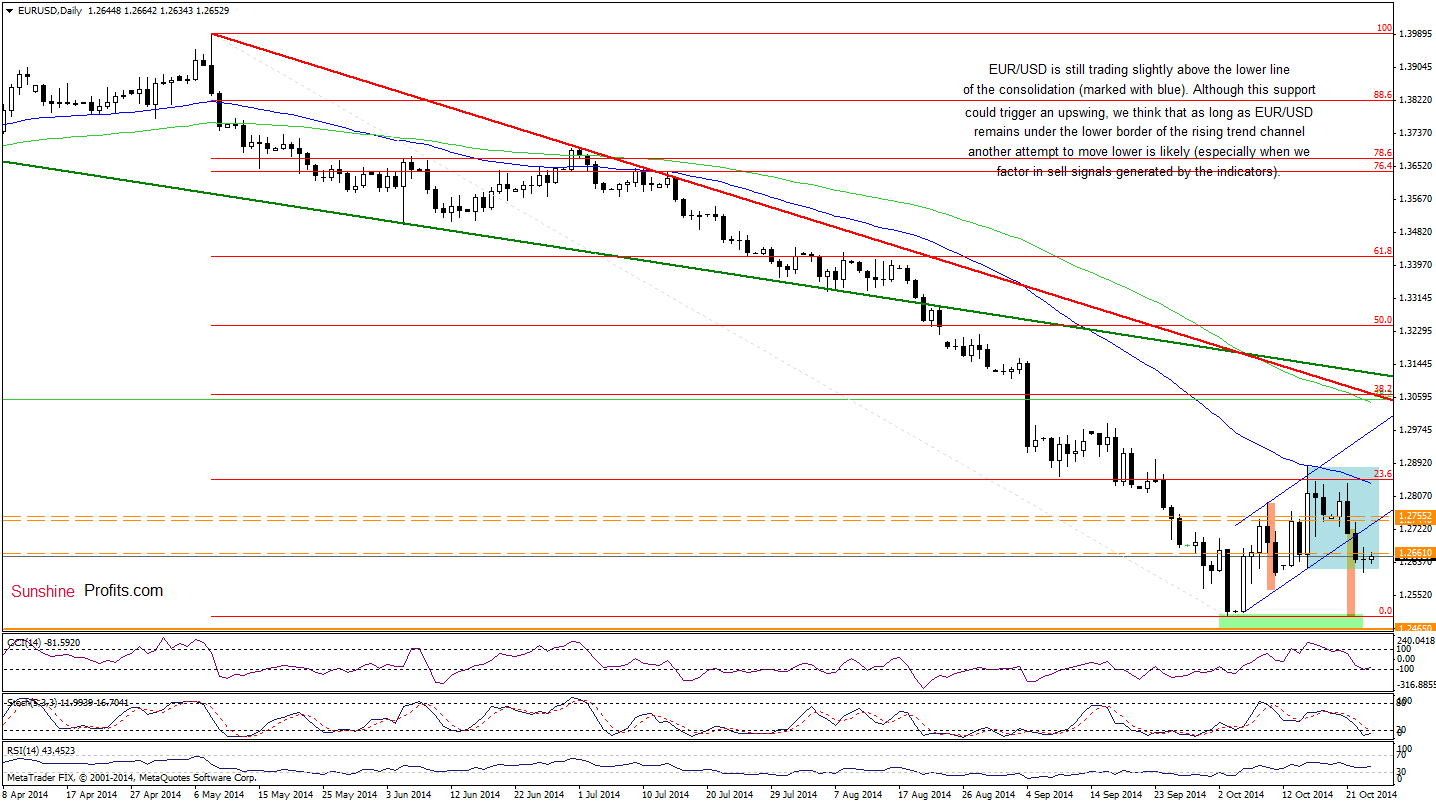
From this perspective, we see that the situation in the very short term also hasn’t changed much as EUR/USD still remains slightly above the lower border of the consolidation (marked with blue). Therefore, what we wrote yesterday is up-to-date:
(…) the pair reached the bottom line of the consolidation (marked with blue), which triggered a small upswing. Although we could see further improvement, we think that as long as EUR/USD is trading under the previously-broken lower line of the trend channel, another attempt to move lower is likely. This scenario is currently reinforced by sell signals generated by the CCI and Stochastic Oscillator and the fact that the exchange rate remains below the Nov 2012 low (at the moment when these words are written). Please note that if the pair closes the day under the lower line of the consolidation, we’ll likely see a test of the strength of the recent lows (as a reminder, in this area the size of the downward move will correspond to the height of the trend channel).
Very short-term outlook: bearish
Short-term outlook: mixed with bearish bias
MT outlook: mixed
LT outlook: bearish
Trading position (short-term): In our opinion, no positions are justified from the risk/reward perspective at the moment. We will consider re-enter long positions at lower levels . We will keep you informed should anything change, or should we see a confirmation/invalidation of the above.
GBP/USD
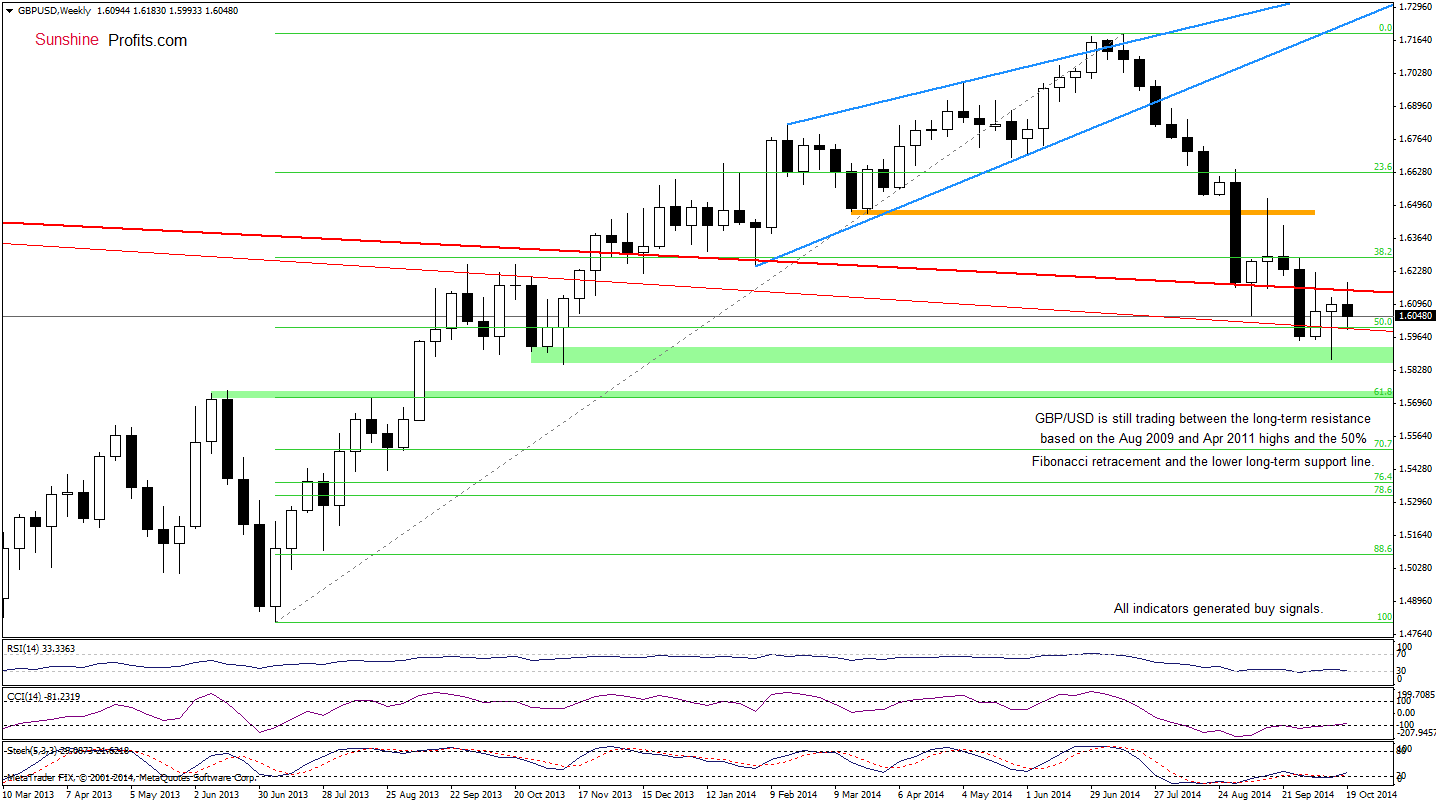
As you see on the weekly chart, the situation in the medium term hasn’t changed much since our last commentary was posted as GBP/USD is still trading between two long-term lines: the resistance line based Aug 2009 and Apr 2011 highs and the support line based on the Apr 2011 and Dec 2012 highs (this line is also reinforced by the 50% Fibonacci retracement. In our opinion, as long as there is no breakout or breakdown another sizable move is not likely to be seen. Nevertheless, we should keep in mind that buy signals generated by the indicators still supports the bullish case.
Having say that, let’s take a closer look at the daily chart.
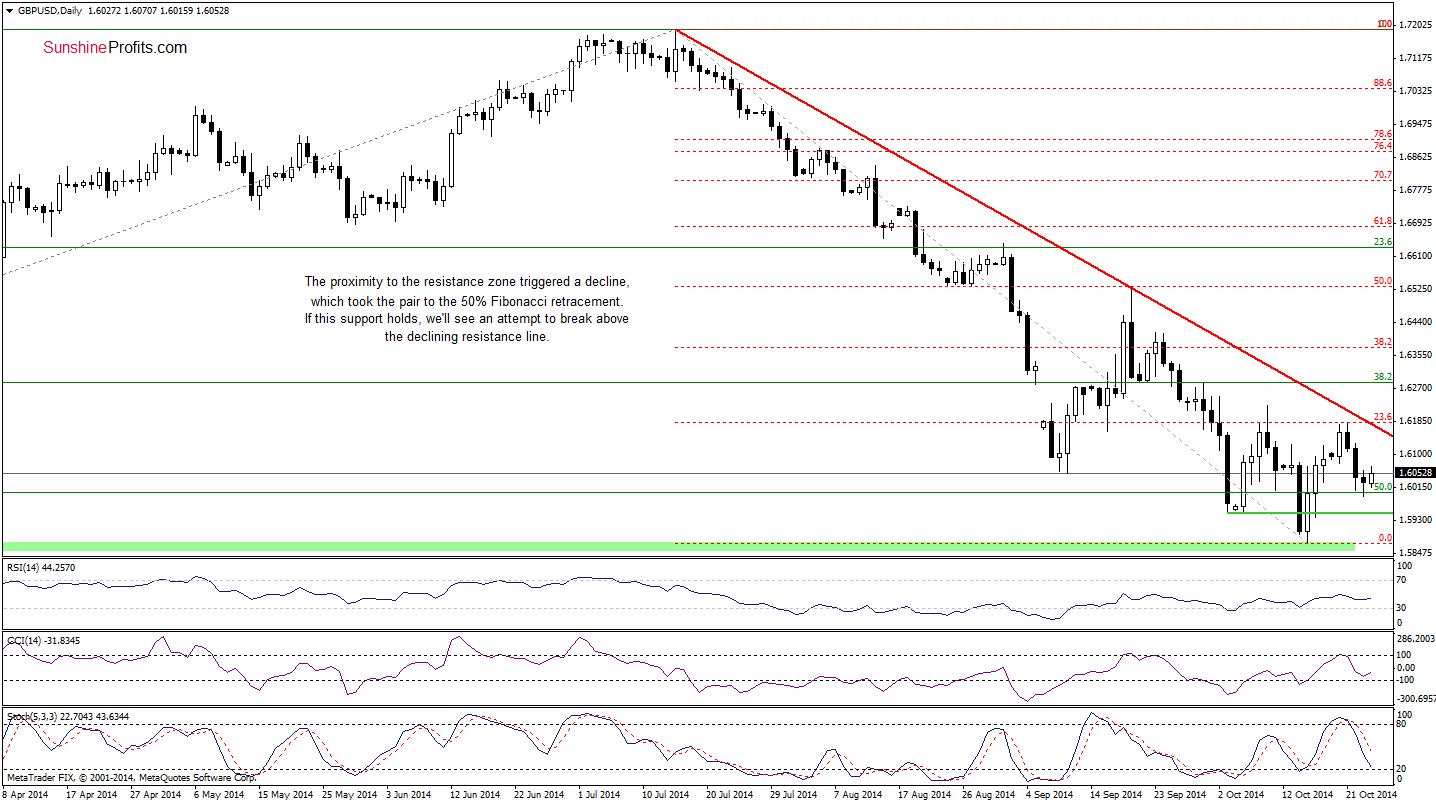
From this perspective, we see that the 50% Fibonacci retracement withstood the selling pressure and the exchange rate rebounded slightly earlier today. Taking this fact into account, we believe that our last commentary on this currency pair is still valid:
(…) If this support area holds, we’ll see an attempt to break above the declining resistance line marked on the daily chart. However, taking into account the medium-term resistance line and sell signals generated by the daily indicators, it seems that the exchange rate will move lower. If this is the case, the initial downside target would be around 1.5953, where the Oct 3, Oct 6 and Oct 16 lows are.
Very short-term outlook: bearish
Short-term outlook: mixed with bearish bias
MT outlook: mixed
LT outlook: mixed
Trading position (short-term): In our opinion, no positions are justified from the risk/reward perspective. We will keep you informed should anything change, or should we see a confirmation/invalidation of the above.
USD/JPY
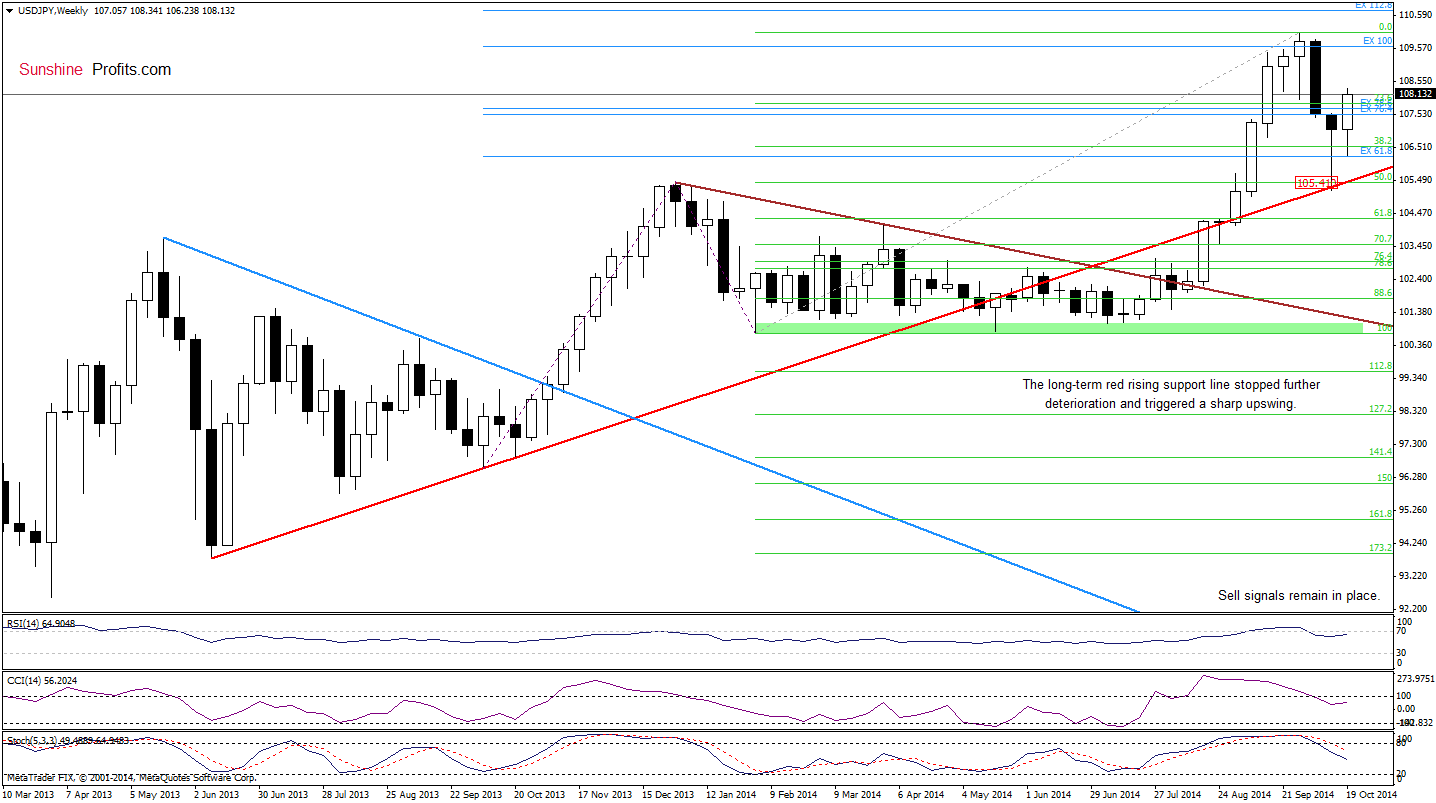
The situation in the medium term has improved as USD/JPY bounced off the long-term rising support line. How this move affected the very short-term picture?
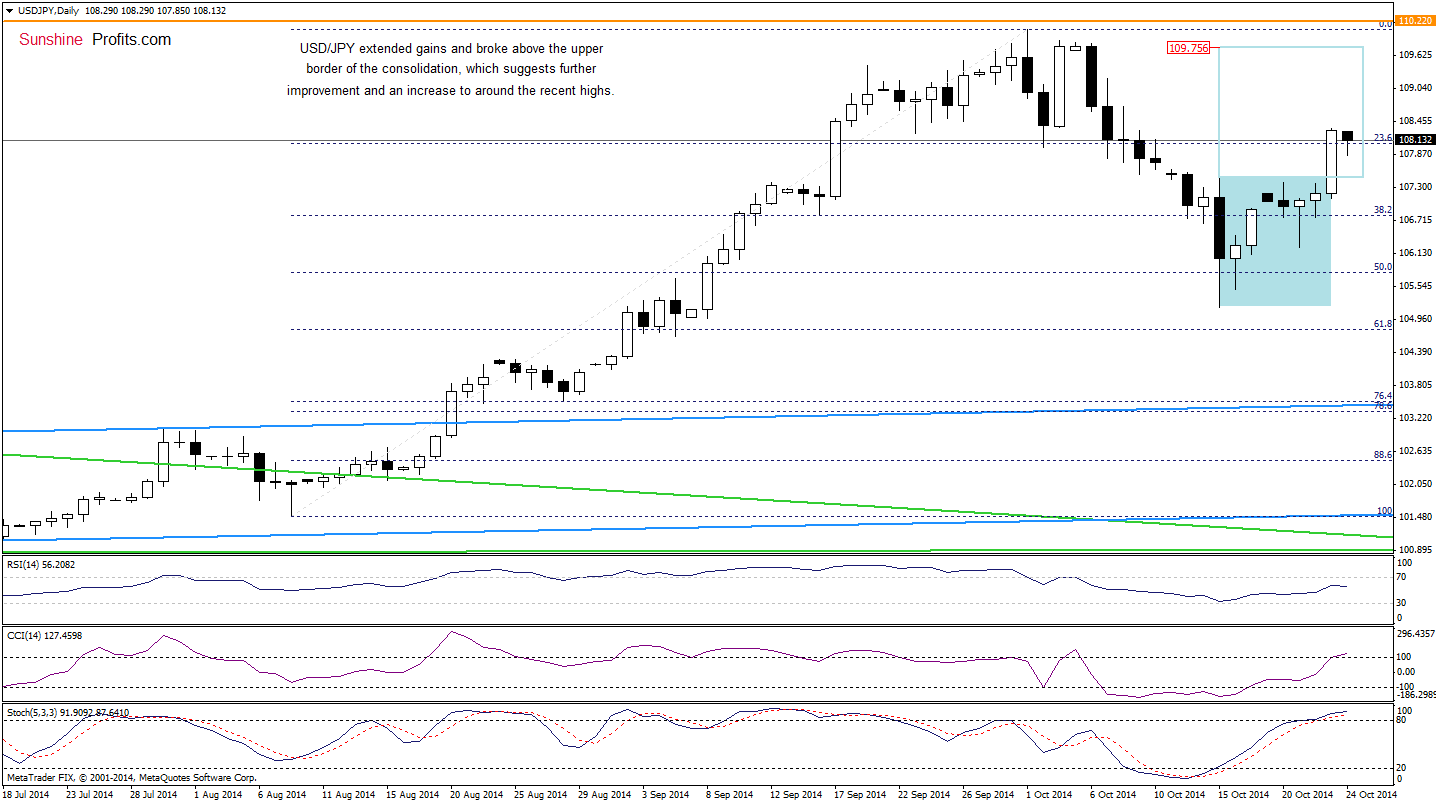
Looking at the above chart, we see that although USD/JPY moved little lower earlier today, the pair is still trading above the previously-broken upper line of the consolidation. Therefore, what we wrote yesterday is up-to-date:
The first thing that catches the eye on the above chart is a breakout above the upper line of the consolidation (marked with blue). This is a bullish signal that suggests further improvement. If this is the case, we could see an increase to around 109.75, where the size of the upward move will correspond to the height of the formation. Please note that although the Stochastic Oscillator climbed above the level of 80, we think that as long as there are no sell signals further improvement is more likely than not.
Very short-term outlook: bullish
Short-term outlook: mixed with bullish bias
MT outlook: mixed
LT outlook: bearish
Trading position (short-term; our opinion): No positions are justified from the risk/reward perspective at the moment. We will keep you informed should anything change, or should we see a confirmation/invalidation of the above.
USD/CAD
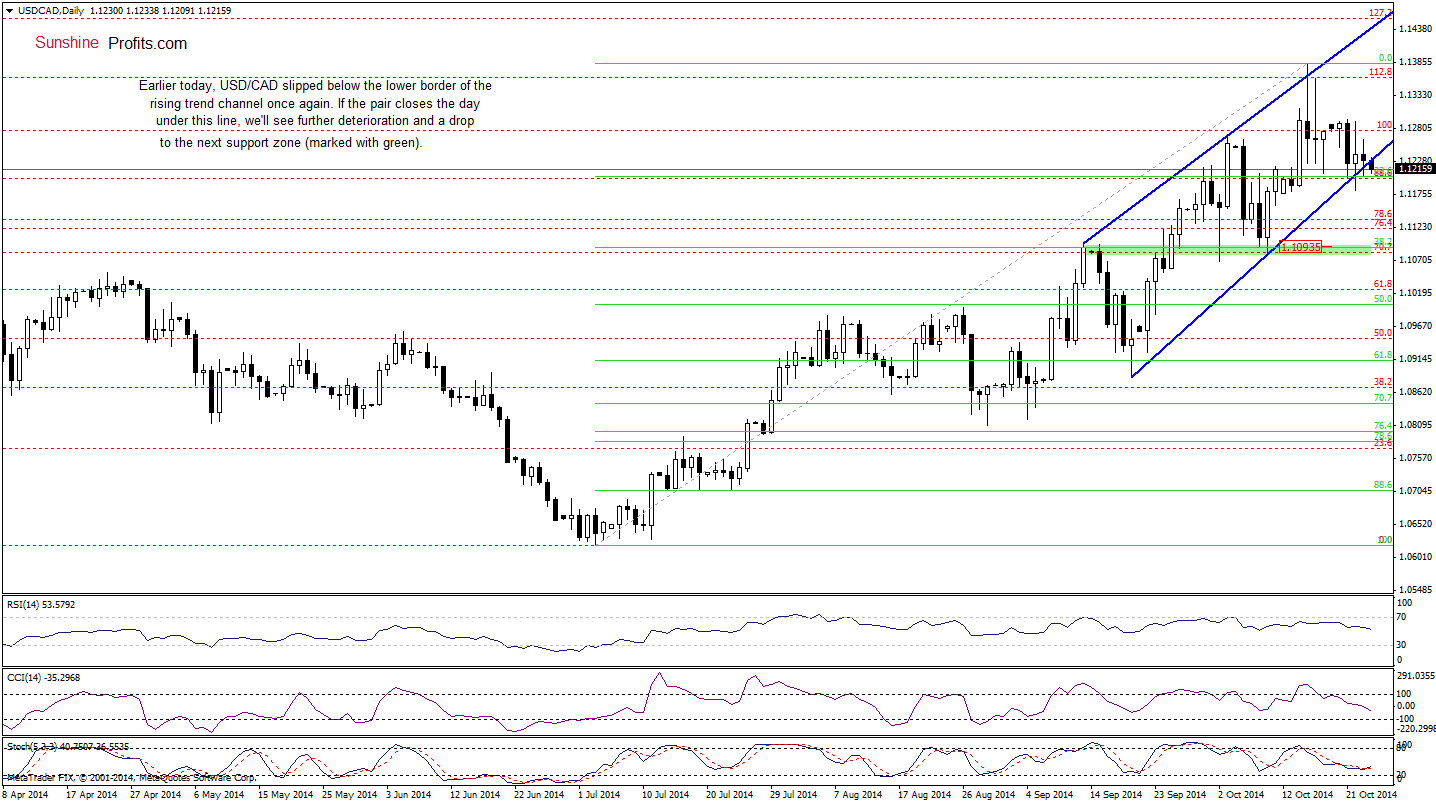
Earlier today, USD/CAD slipped below the lower border of the rising trend channel once again. Although this is a bearish signal, we saw similar price action in the recent days. Therefore, we think that we could say that the very short-term picture will turn to bearish, if the exchange rate closes the day below this key support line. Until this time, the daily picture is a bit unclear and the pair could go both north and south from here.
Will the weekly chart give us more clues about future moves? We think that the best answer to this question will be our last commentary on this currency pair.
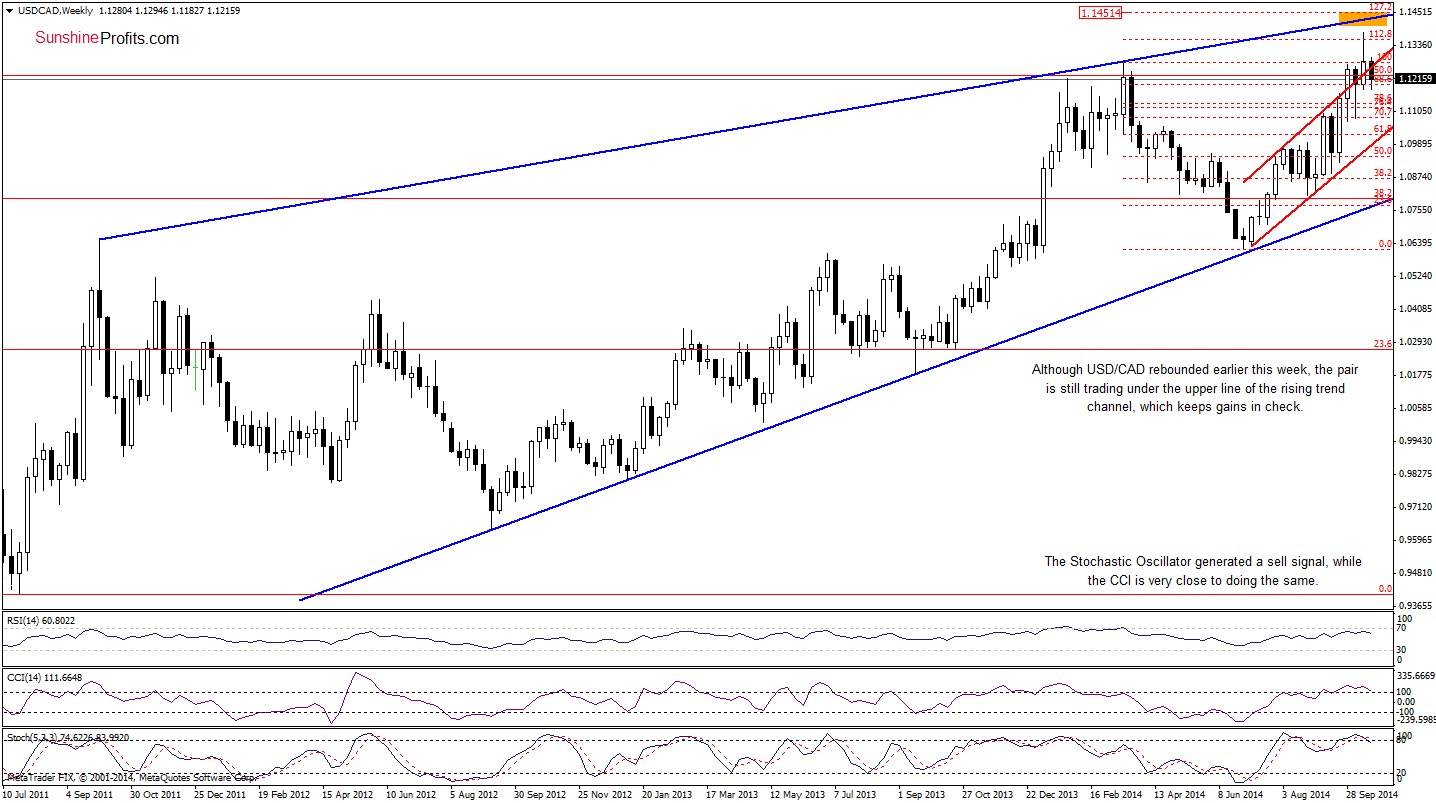
(…) although USD/CAD rebounded earlier this week, the pair is still trading under the previously-broken upper line of the rising trend channel. In our opinion, if currency bulls do not manage to push the exchange rate above this key resistance line, the current upswing will be nothing more than a verification of the breakdown. If this is the case, it will be a bearish signal, which will trigger further deterioration. How low could USD/CAD go?
(…) If (…) the exchange rate drops below the last week’s low, the correction will likely accelerate and the initial downside target would be around 1.1070-1.1096
(…) taking into account the medium-term picture and sell signals generated by the daily indicators, it seems that a breakdown is just a matter of time. If this is the case, we would see a drop to around 1.10.93, where the 38.2% Fibonacci retracement (based on the entire Jul-Oct rally) and the medium-term support zone are.
Very short-term outlook: mixed with bearish bias
Short-term outlook: mixed with bearish bias
MT outlook: mixed with bearish bias
LT outlook: bearish
Trading position (short-term; our opinion): No positions are justified from the risk/reward perspective at the moment. We will keep you informed should anything change, or should we see a confirmation/invalidation of the above.
USD/CHF
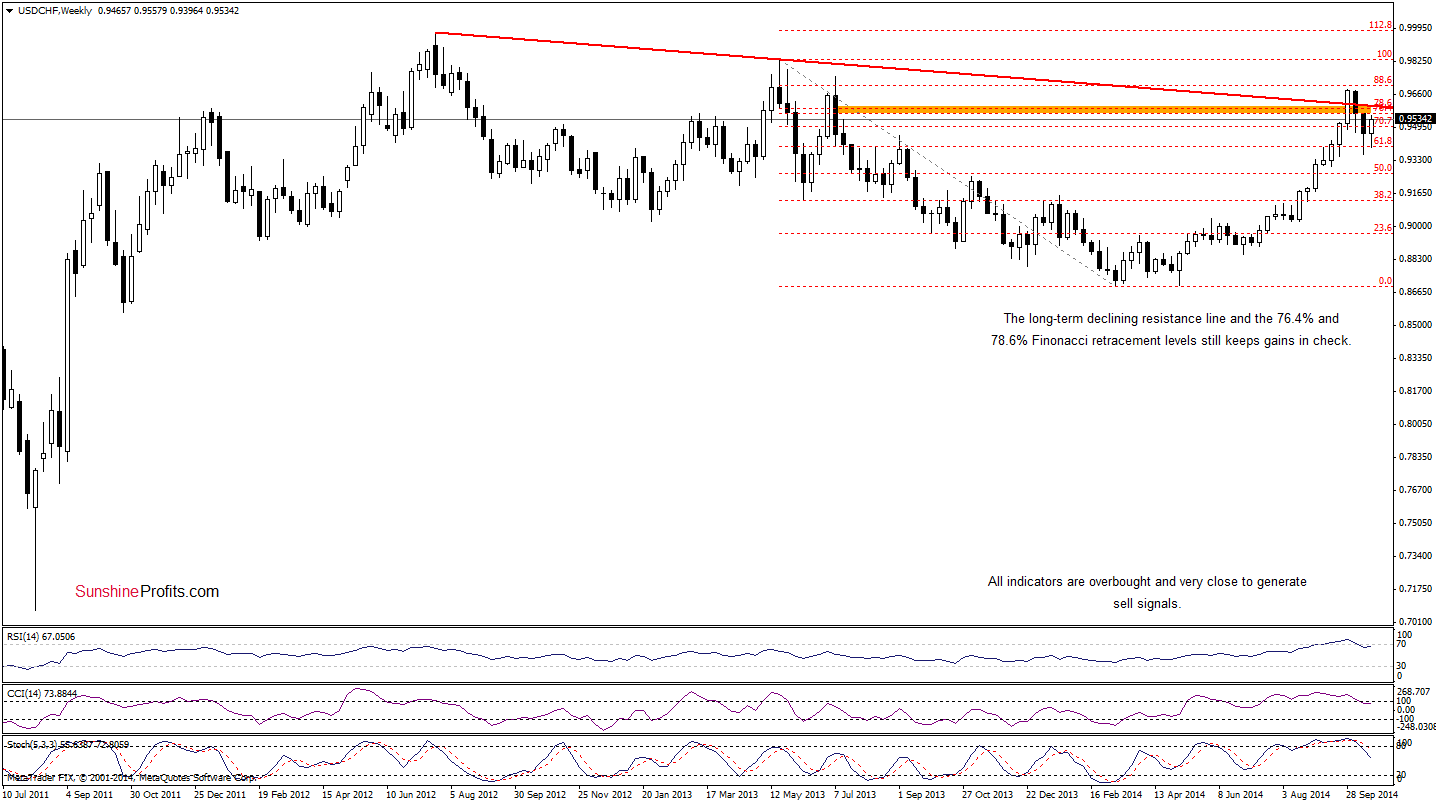
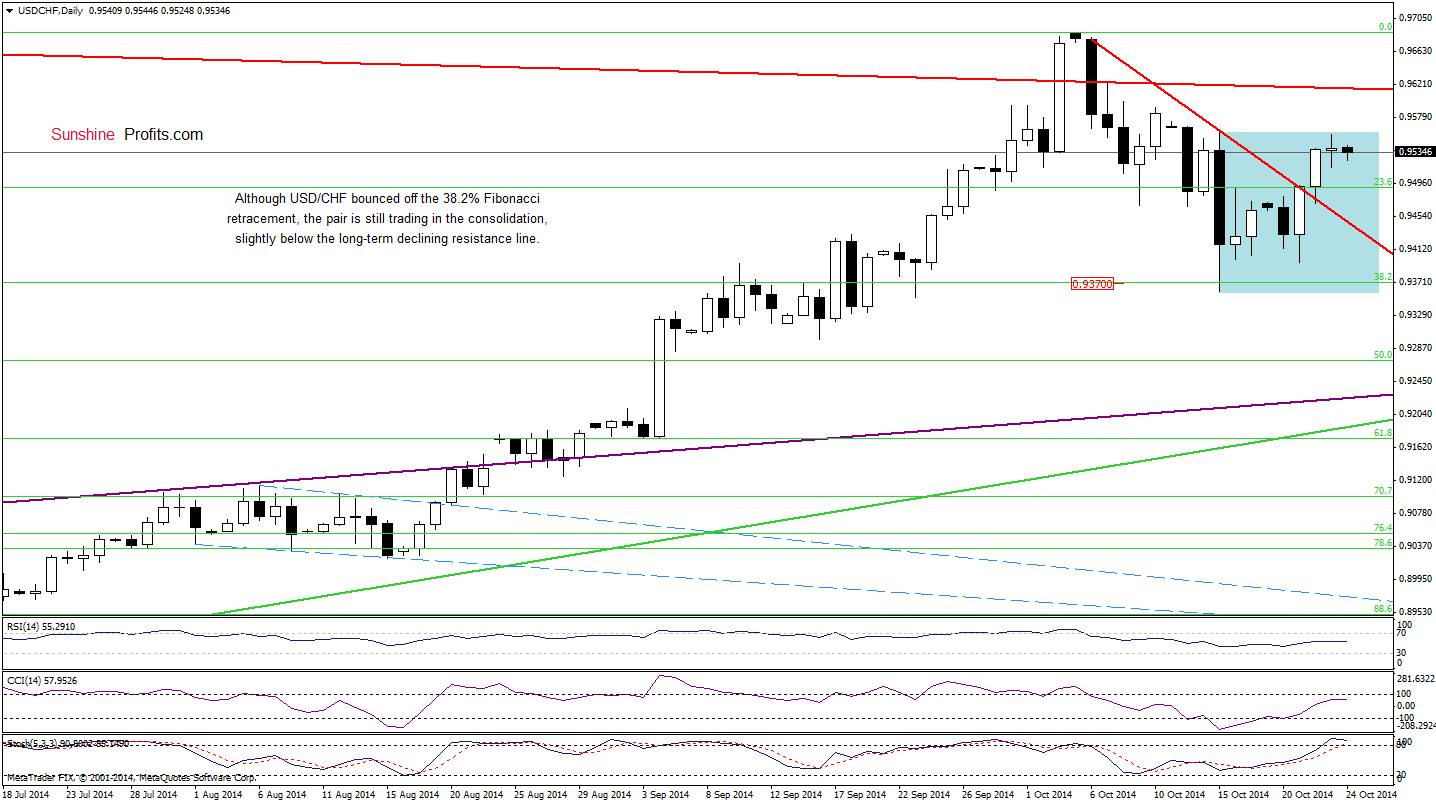
Looking at the above charts, we see that USD/CHF rebounded sharply after a drop to the 38.2% Fibonacci retracement level based on the Jul-Oct rally. As you see on the daily chart, this support level triggered an upswing, which took the pair above the declining resistance line based on the Oct 6 and Oct 15 highs. Although this is a bullish signal, we should keep in mind that the exchange rate is still trading in the consolidation range (marked with blue on the daily chart). Additionally, the pair remains below the long-term declining resistance line (based on the Jul 2012 and May 2013 highs) and the previously-broken 76.4% and 78.6% Fibonacci retracement levels, which together create a solid resistance zone. Taking all the above into account, we think that even if USD/CHF breaks above the upper line of the consolidation, another sizable move is not likely to be seen as long as the medium-term resistance zone is in play. Please note that if this area triggers a pullback, the initial downside target would be around 0.9446, where the very short-term support/resistance line (seen on the daily chart).
Very short-term outlook: mixed with bearish bias
Short-term outlook: mixed with bearish bias
MT outlook: bearish
LT outlook: bearish
Trading position (short-term; our opinion): No positions are justified from the risk/reward perspective at the moment. We will keep you informed should anything change, or should we see a confirmation/invalidation of the above.
AUD/USD
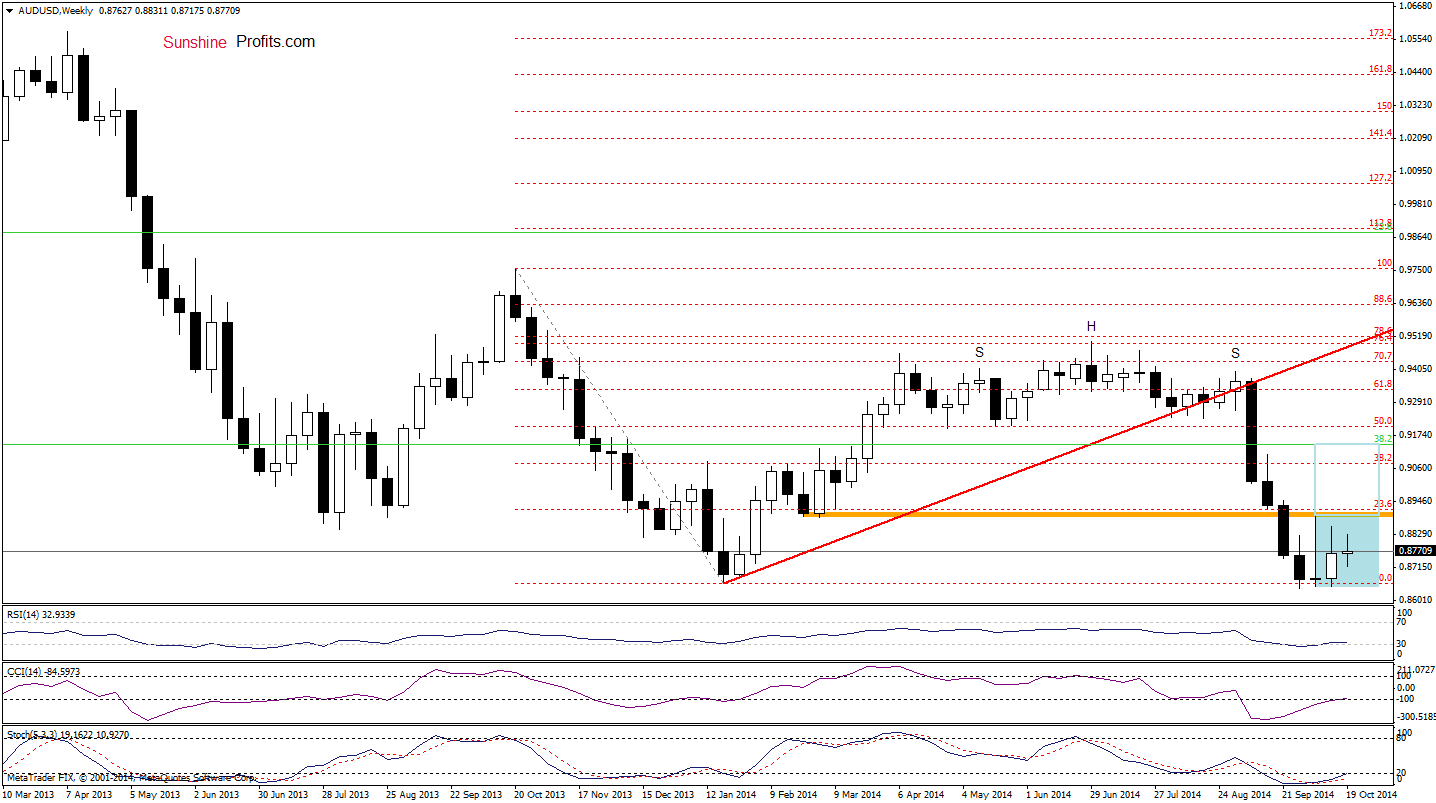
Looking at the weekly chart, we see that the situation hasn’t changed much as AUD/USD is still trading in a narrow range between the resistance level based on the March low (marked with orange) and the recent lows. Will the daily chart give us more clues about future moves? Let’s check.
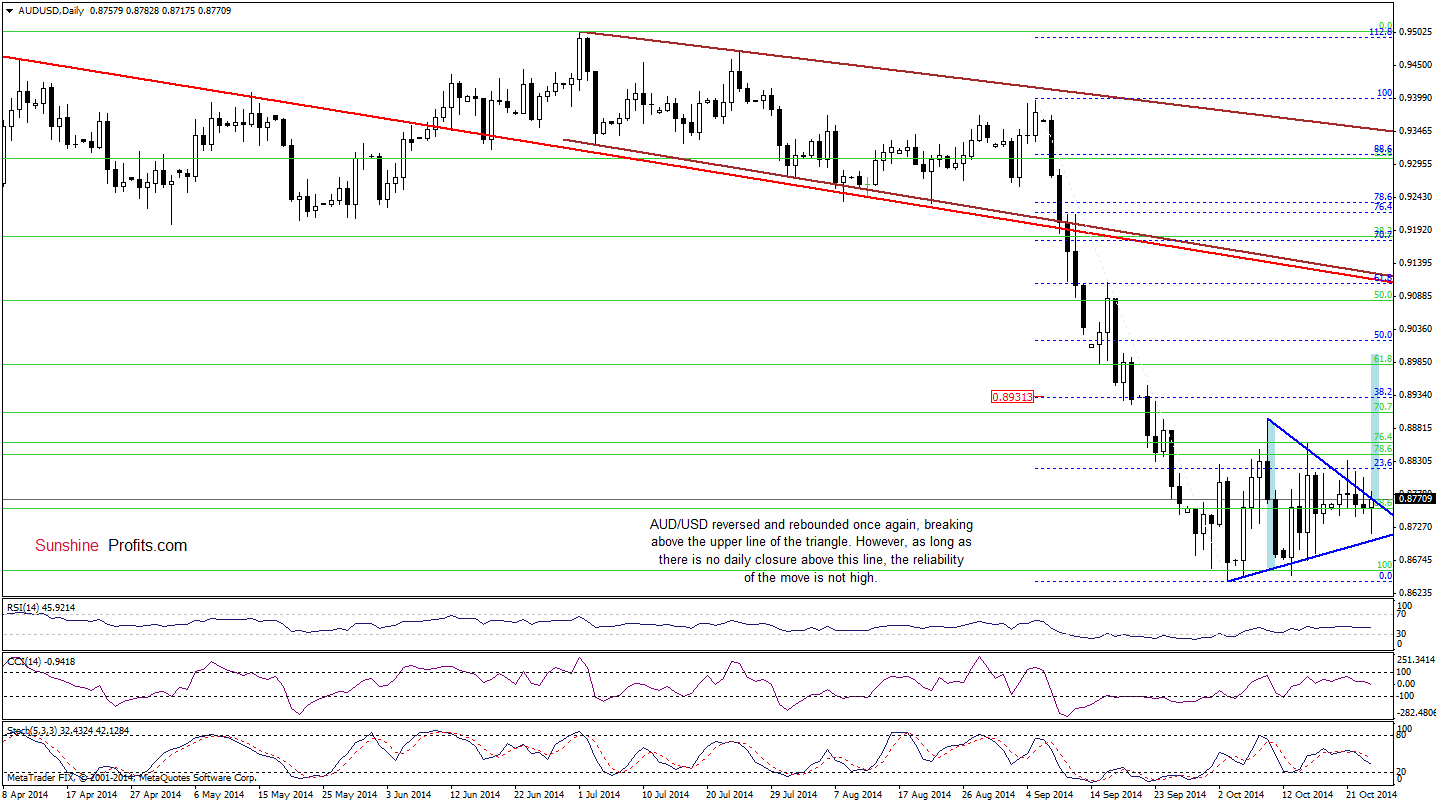
As you see on the above chart, in the recent days there were several attempts to break above the upper line of the blue triangle. Unfortunatelly for currency bulls, they all failed and the exchange rate is still trading around this key resistance line. Therfore, we still think that another bigger upswing will be more likely if the pair closes the day above it. If this is the case, and we’ll see such price action, the initial upside target for currency bulls will be the Oct 9 high of 0.8896 and then the 38.2% Fibonacci retracement based on the Sep-Oct decline around 0.8931.
Very short-term outlook: mixed with bullish bias
Short-term outlook: bullish
MT outlook: mixed
LT outlook: bearish
Trading position (short-term; our opinion): Long positions with a stop-loss order at 0.8587 are still justified from the risk/reward perspective at the moment. We will keep you informed should anything change, or should we see a confirmation/invalidation of the above.
Thank you.
Nadia Simmons
Forex & Oil Trading Strategist
Przemyslaw Radomski, CFA
Founder, Editor-in-chief
Gold & Silver Trading Alerts
Forex Trading Alerts
Oil Investment Updates
Oil Trading Alerts

