
Earlier today, the Census Bureau showed that U.S. retail sales fell 0.3% last month, while core retail sales (without motor vehicles and parts) dropped 0.2% in September. Additionally, U.S. producer price inflation slipped 0.1% in September, missing expectations for a 0.1% rise. On top of that, the Federal Reserve of New York reported that its manufacturing index dropped to a six-month low of 6.2 in October from 27.5 in September. These bearish numbers pushed the greenback lower, which resulted in a sharp increase in the EUR/USD pair. Is this the first sign of the rally?
In our opinion the following forex trading positions are justified - summary:
- EUR/USD: long (stop-loss order: 1.2560; initial price target: 1.3072)
- GBP/USD: none
- USD/JPY: none
- USD/CAD: none
- USD/CHF: short (stop-loss order: 0.9711; initial price target: 0.9332)
- AUD/USD: long (stop-loss order: 0.8587; initial price target: 0.8943)
Today, we are closing our short positions on USD/JPY and USD/CAD. Although, the USD/CAD pair was closed by the stop-loss order, profits from USD/JPY were two times greater than the loss.
EUR/USD
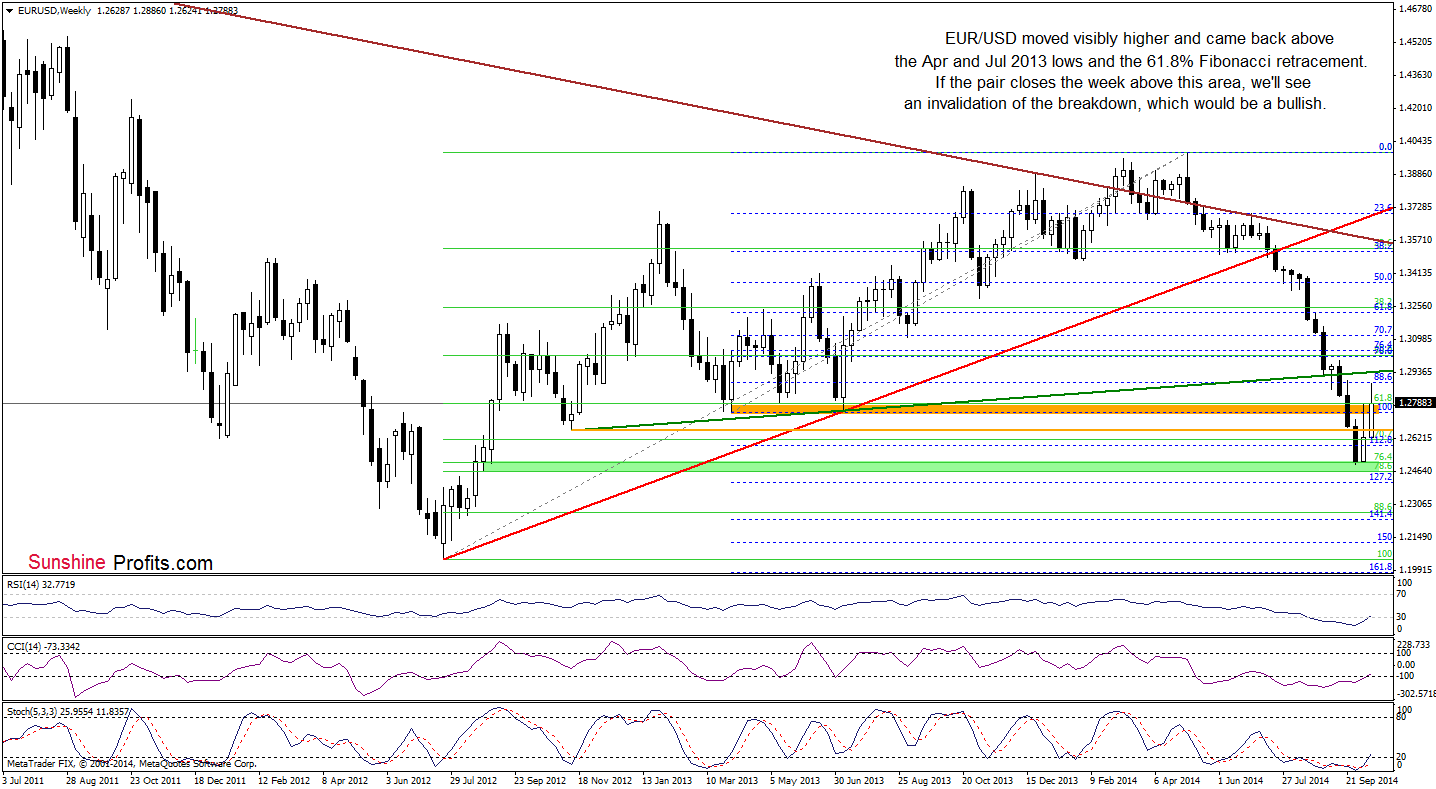
The situation in the medium term has improved slightly as EUR/USD extended gains and climbed above the Apr and Jul 2013 lows and the 61.8% Fibonacci retracement level. This is a positive signal, which will be even more bullish if the pair closes the week above this area. In this case, we’ll see an invalidation of the breakdown, which would likely encourage currency bulls to attack the previously-broken long-term green support/resistance line based on the Nov 2012 and Jul 2013 lows.
What impact did this move have on the very short-term picture? Let’s check.
In our Forex Trading Alert posted on Monday, we wrote the following:
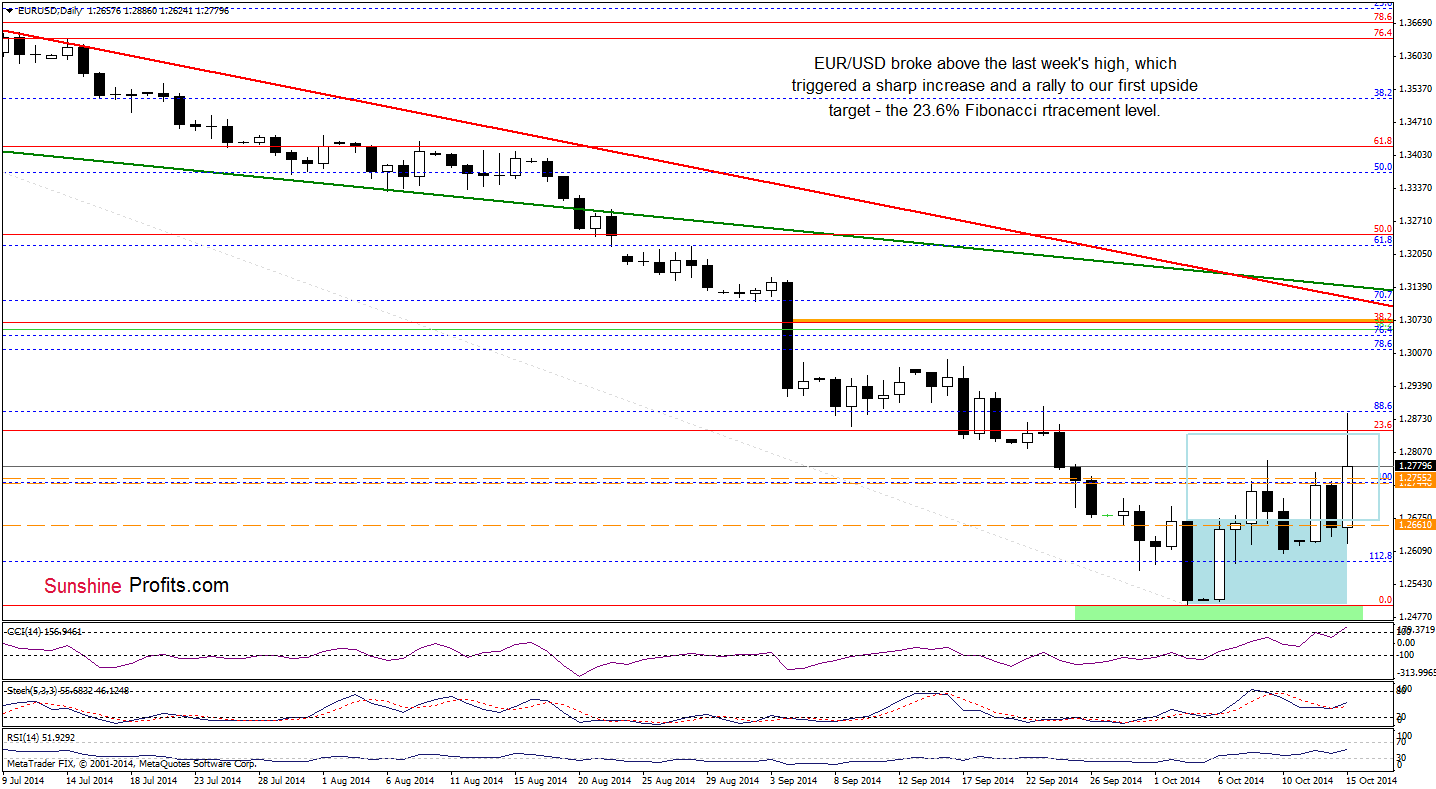
(…)Taking (…) into account (…) a comeback above the Nov 2012 low and buy signals generated by the weekly indicators, we think that the exchange rate will move higher in the near future. If this is the case, we’ll see an increase to the Thursday’s high or even to the 23.6% Fibonacci retracement level at 1.2849.
As you see on the daily chart, the situation developed in line with the above-mentioned scenario as EUR/USD climbed above the 23.6% Fibonacci retracement, hitting an intraday high of 1.2886. Although the pair gave up some gains, it still remains above the previously-broken upper line of the consolidation range and the Apr and Jul 2013 lows. If the exchange rate closes the day above these levels, it will mean an invalidation of the breakdown, which should trigger further improvement. if this is the case, the next upside target for currency bulls will be the Sep 16 high of 1.2994.
Very short-term outlook: bullish
Short-term outlook:mixed with bullish bias
MT outlook: mixed
LT outlook: bearish
Trading position (short-term; in our opinion): Long positions with a stop-loss order at 1.2560 are justified from the risk/reward perspective at the moment. We will keep you informed should anything change, or should we see a confirmation/invalidation of the above.
USD/JPY
Yesterday, we wrote the following:
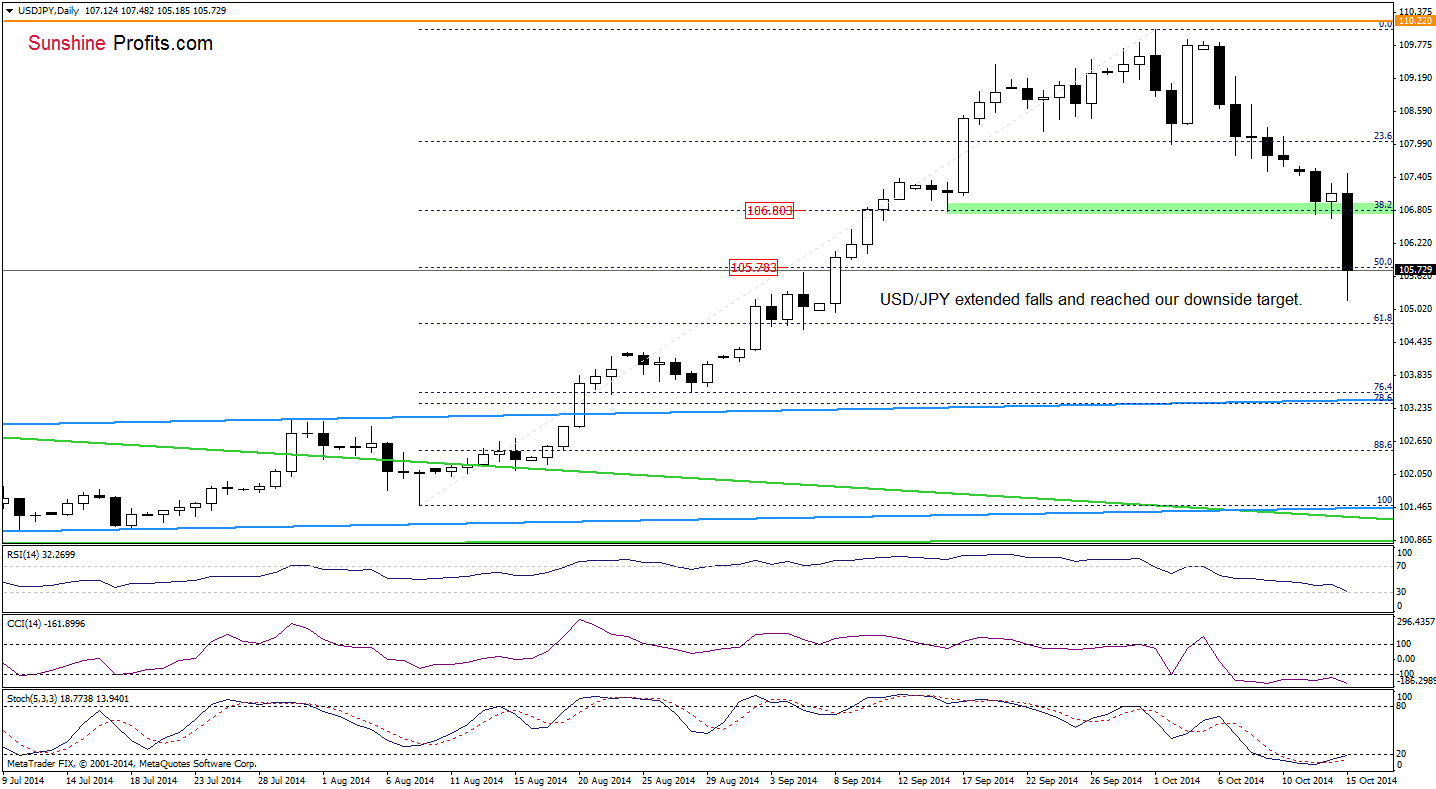
(…) Where the pair head next? Although the 38.2% Fibonacci retracement coud trigger an upswing from here, we still think that further deterioration is just around the corner (…) If this is the case, and the pair moves lower, the next downside target will be around 105.78, where the 50% Fibonacci retracement level is.
Looking at the above chart, we see that currency bears realized the above-mentioned sceanrio as USD/JPY hit an intraday low of 105.18 earlier today. Will we see further deterioration? We think that the weekly chart can give us an answer to this question. Let’s take a closer look.
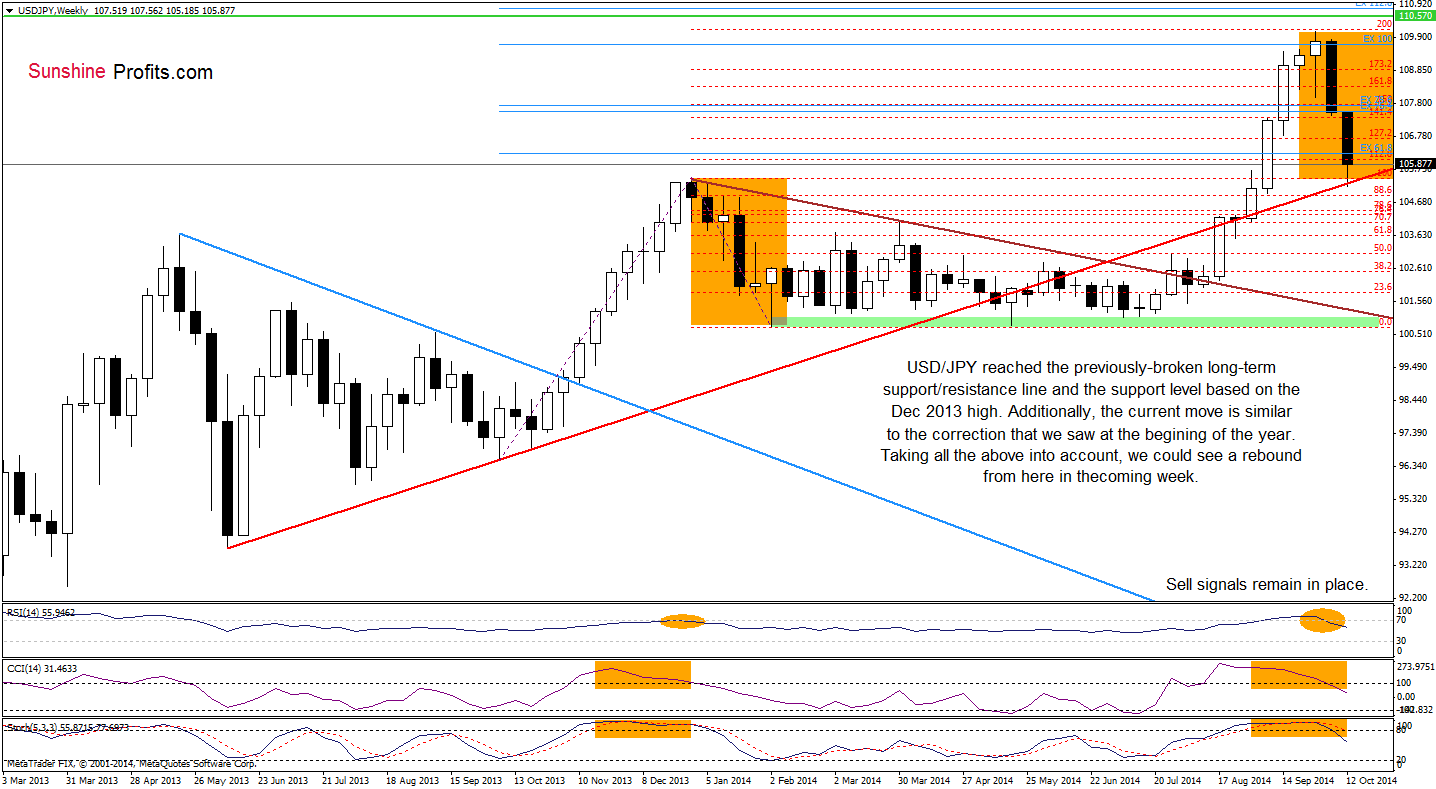
From this perspective, we see that the exchange rate reached the previously-broken long-term support line (marked with red) and the support level based on the Dec 2013 high. Additionally, when we compare the size of thecurrent correction to the one that we saw at the beginning of the year, we clearly see that they are identical. Taking these facts into account, and combining it with the 50% Fibonacci retracement and the position of the daily indicators, it seems that we could see a rebound from here in the coming week.
Very short-term outlook: mixed
Short-term outlook: mixed
MT outlook: mixed
LT outlook: bearish
Trading position (short-term; our opinion): Today, the pair reached our initial downside target. Taking this fact into account, and combining it with the support area, we think that cashing out of the short positions (opened on Sep 25 at 109.20) and taking profits off the table seems to be appropriate.
USD/CHF
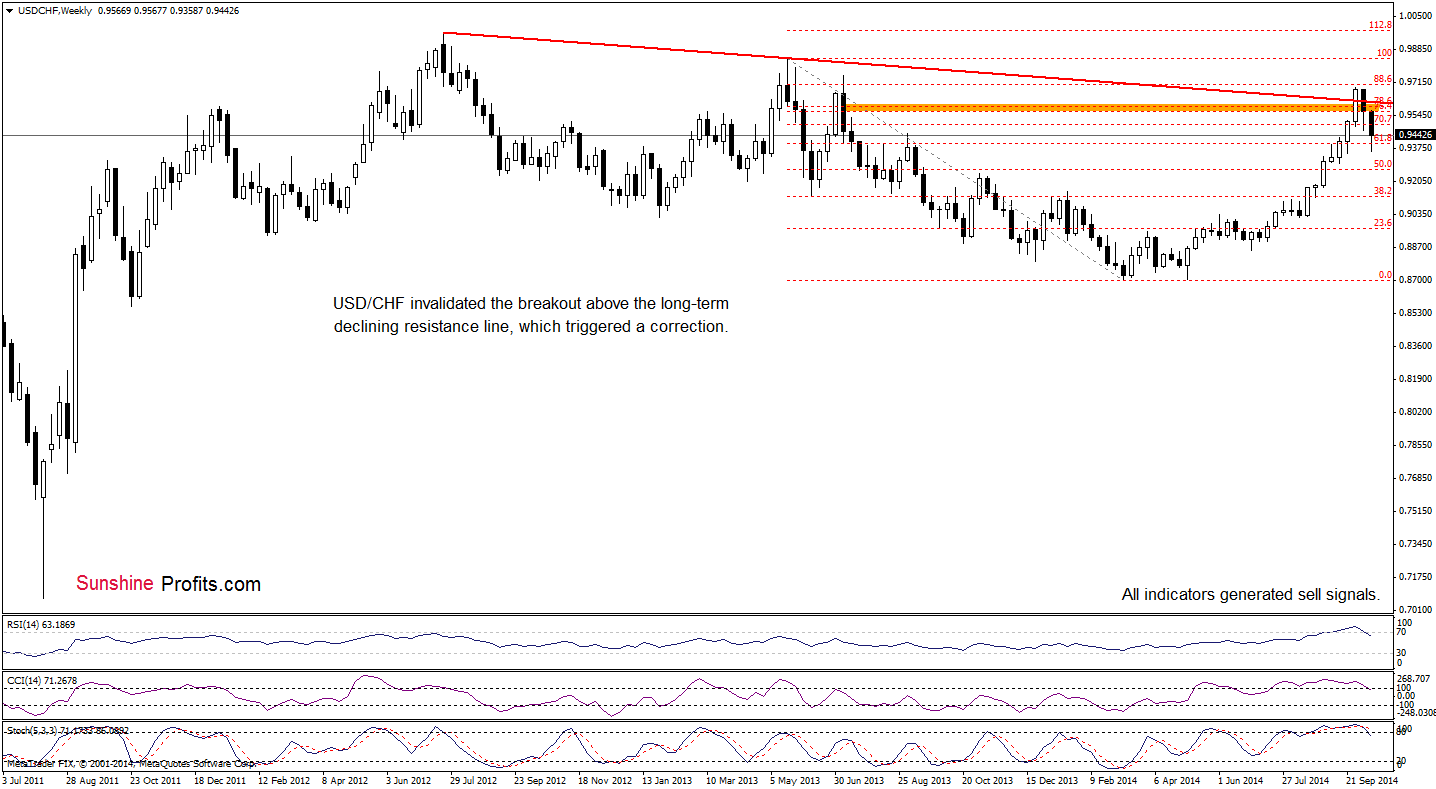
Quoting our last commentary on this currency pair:
(…) The USD/CHF pair is now back below the declining support/resistance line, which is a bearish sign. (…) When we take a closer look, we see that the proximity to this line was enough to trigger a correction in Jul 2013. What’s interesting, back then, all reading of the indicators were lower than now. All the above, provides us with bearish implications and suggests that a bigger correction is just around the corner.
As you see on the weekly chart, currency bears managed to push the pair lower as we expected. With this downward move, the exchange rate also invalidated a breakout above the 76.4% and 78.6% Fibonacci retracement levels, which is an additional bearish signal. How this move affected the very short-term picture? Let’s find out.
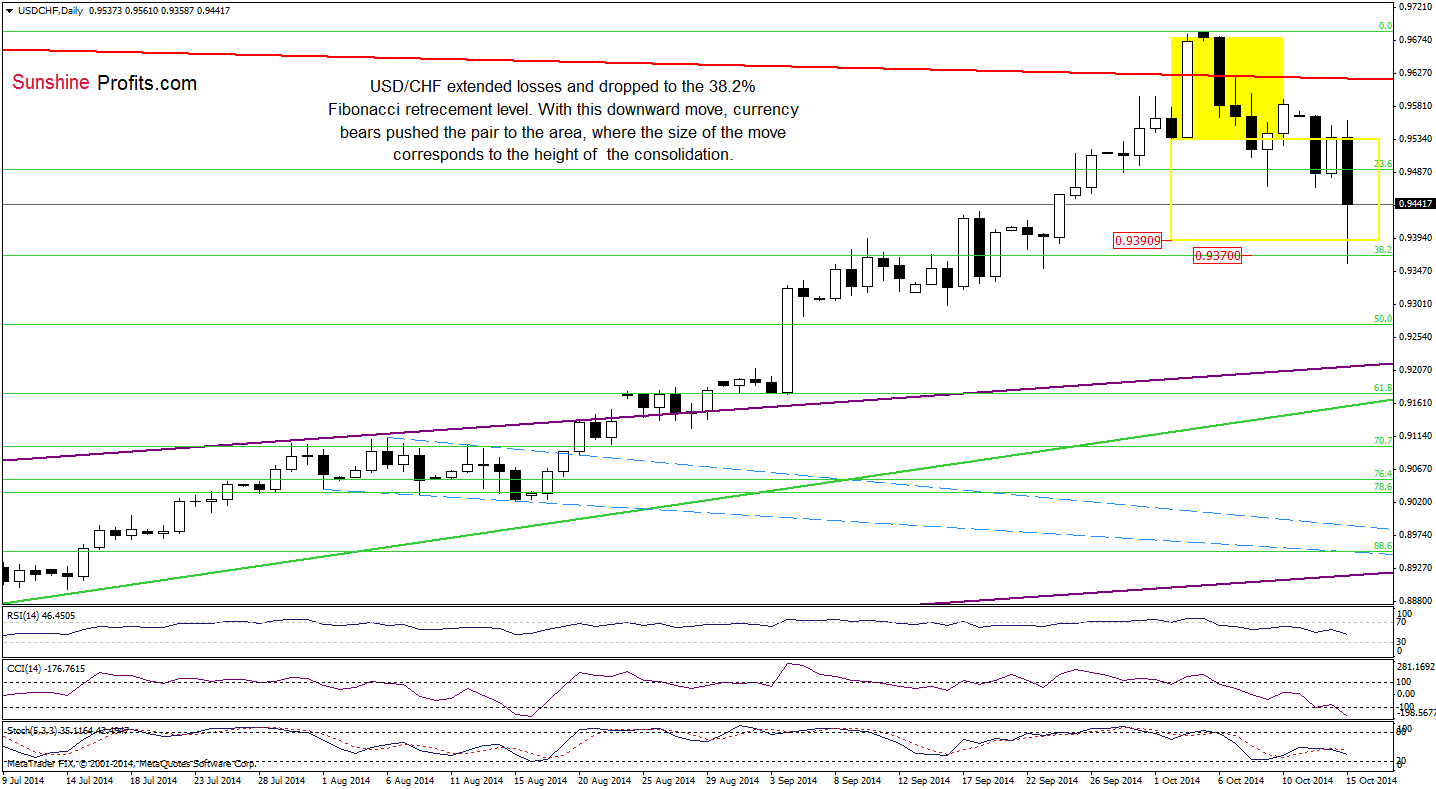
Quoting our Forex Trading Alert posted on Friday:
(…) Although the pair could go both north or south from here, we think that the resistance area marked on the weekly chart will be strong enough to stop further improvement. If this is the case, and the exchange rate drops under the 23.6% Fibonacci retracement, we’ll see a correction to at least 0.9391, where the size of the downward move will correspond to the height of the formation.
The above chart clearly shows that the situation developed in tune with our bearish scenario. As you see, today’s downswing took the exchange rate to the 38.2% Fibonacci retracement. Although this support level triggered a rebound earlier today, we think that the pair will move lower once again as sell signals generated by the daily indicators are still in play.
Very short-term outlook: mixed with bearish bias
Short-term outlook: mixed with bearish bias
MT outlook: bearish
LT outlook: bearish
Trading position (short-term; our opinion): Short positions with a stop-loss order at 0.9711are justified from the risk/reward perspective at the moment. We will keep you informed should anything change, or should we see a confirmation/invalidation of the above.
Thank you.
Nadia Simmons
Forex & Oil Trading Strategist
Przemyslaw Radomski, CFA
Founder, Editor-in-chief
Gold & Silver Trading Alerts
Forex Trading Alerts
Oil Investment Updates
Oil Trading Alerts

