
Earlier today, the University of Michigan reported that its consumer sentiment index rose to a 14-month high of 84.6 this month (from a reading of 82.5 in the previous month), beating analysts’ expectations for an increase to 83.3 in September. As a result, the U.S. currency hit a fresh six-year high against the yen, reaching the next resistance level. Will it manage to stop currency bulls?
In our opinion the following forex trading positions are justified - summary:
- EUR/USD: long (stop-loss order: 1.2846; initial price target: 1.3200)
- GBP/USD: none
- USD/JPY: none
- USD/CAD: none
- USD/CHF: none
- AUD/USD: none
EUR/USD
The medium-term picture hasn’t changed much and EUR/USD still remains above the support zone created by the 88.6% Fibonacci retracement and the long-term green support line based on the Nov 2012 and Jul 2013 lows. Today, we’ll focus on the daily chart.
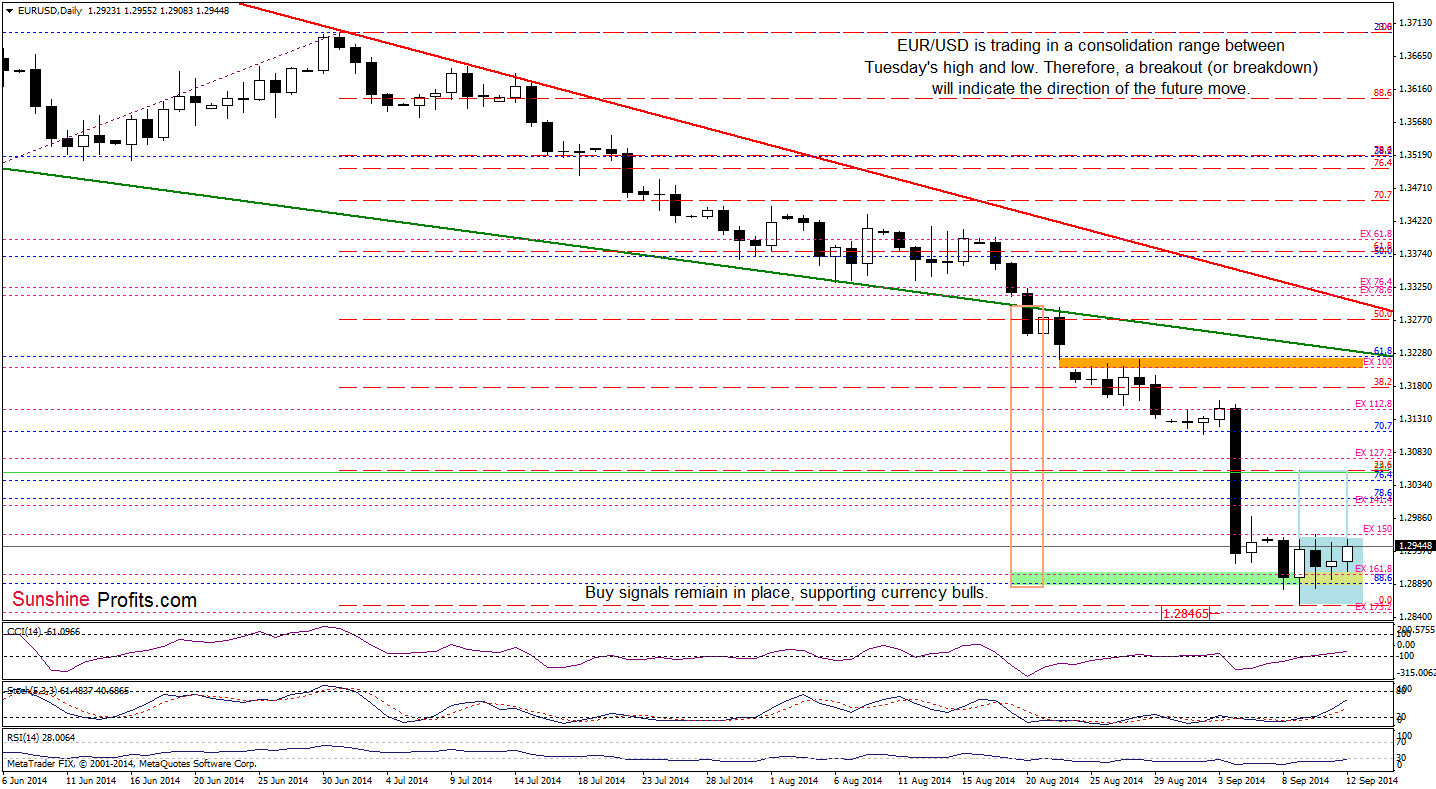
Looking at the above chart, we see that although EUR/USD moved little higher, the very short-term picture hasn’t changed much as the exchange rate remains in a consolidation (marked with blue) between Tuesday’s high and low. Therefore, what we wrote yesterday is up-to-date:
(...) as long as there is no breakout above the upper line of the formation (or a breakdown below the lower line), another sizable move is not likely to be seen. Nevertheless, taking into account buy signals generated by the CCI ad Stochastic Oscillator and an invalidation of the medium-term breakdown, we still believe that the next move will be to the upside. Please note that a breakout above the upper line of the consolidation should result in an increase to at least 1.3055, where the size of the upswing would correspond to the height of the formation and the 23.6% Fibonacci retracement (based on the Jul-Sep decline) is.
Very short-term outlook: bullish
Short-term outlook: mixed with bullish bias
MT outlook: mixed
LT outlook: bearish
Trading position (short-term; our opinion): Long with a stop-loss order at 1.2846. We will keep you informed should anything change, or should we see a confirmation/invalidation of the above.
USD/JPY
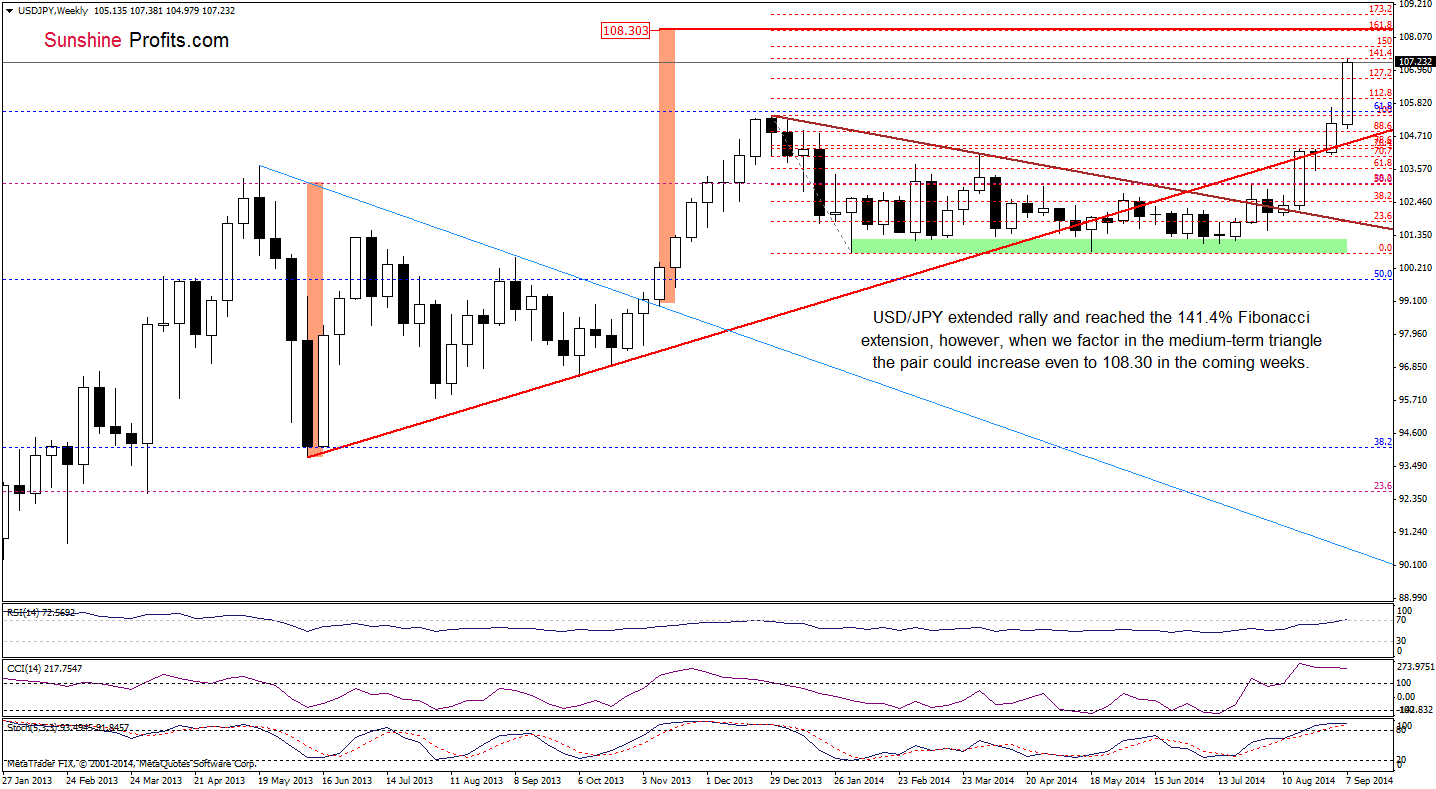
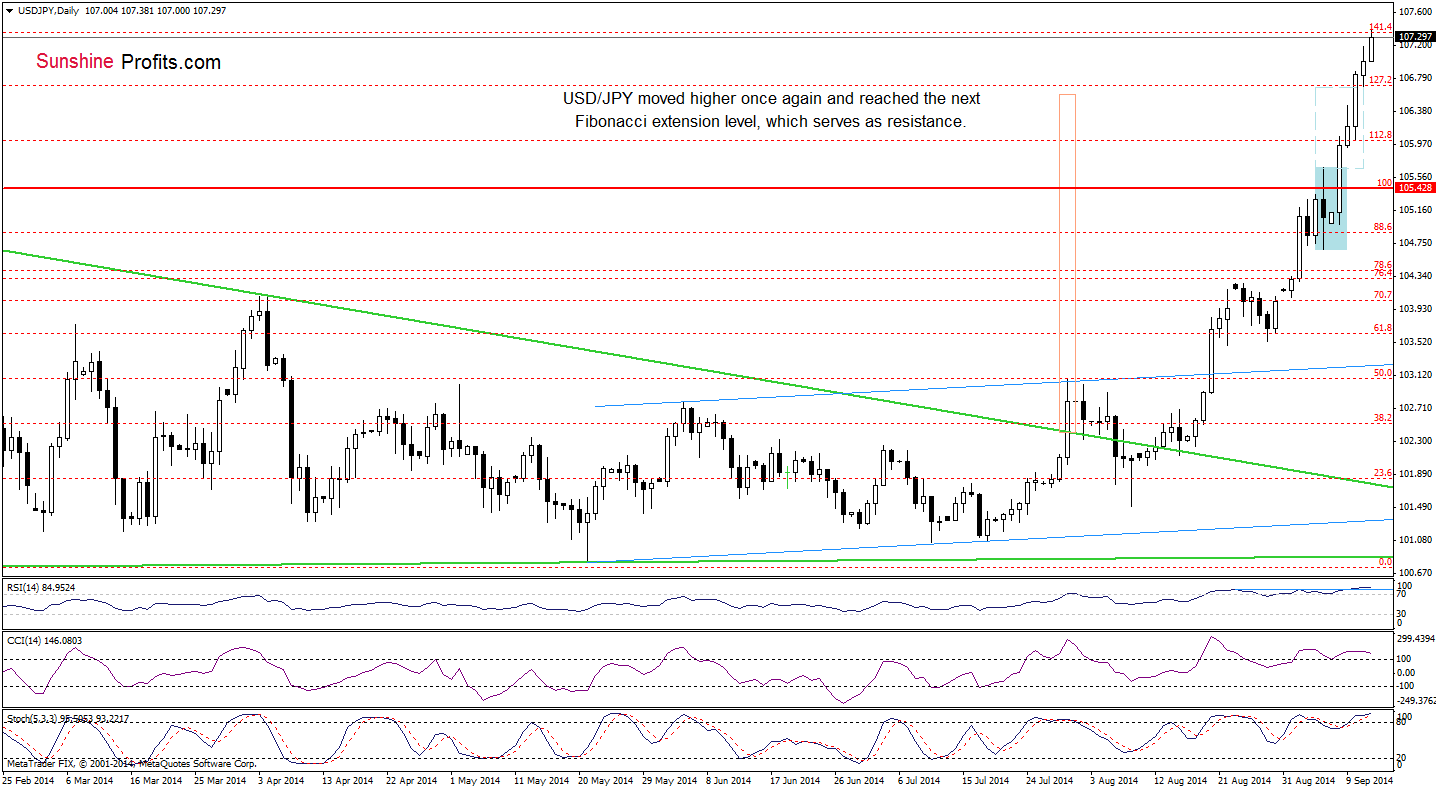
On the above charts, we see that USD/JPY extended rally and reached the next resistance level created by the 141.4% Fibonacci extension. Will we see further improvement in the coming days? Looking at the current position of the short-term indicators (the RSI climbed above the level of 84, while the CCI and Stochastic Oscillator are overbought and there are negative divergences between them and the exchange rate), it seems that correction is just around the corner (in this case, the initial downside target will be around 106, where the 23.6% Fibonacci retracement based on the Aug-Sep rally is).
Nevertheless, as long as there are no sell signals another attempt to move higher can’t be ruled out. If this is the case, you may wonder how high could the exchange rate go? As you see on the weekly chart, in November, there was a breakout above the upper line of the medium-term triangle. Although, the pair moved visibly higher in the following weeks, currency bulls didn’t manage to push USD/JPY above 108, where the size of the upward move corresponds to the height of the formation. As a result, the pair reversed and corrected earlier gains. Despite this drop, after a breakout above the 2013 high, currency bulls received another chance to reach the above-mentioned upside target. Therefore, if we don’t see a bigger or at least similar correction to the one that we saw at the beginning of August, we think that USD/JPY will climb to around 108.30 (please note that this area is reinforced by the 161.8% Fibonacci extension) in the coming weeks.
Very short-term outlook: mixed
Short-term outlook: mixed
MT outlook: mixed
LT outlook: bearish
Trading position (short-term): In our opinion no positions are justified from the risk/reward perspective at the moment. We will keep you informed should anything change, or should we see a confirmation/invalidation of the above.
AUD/USD
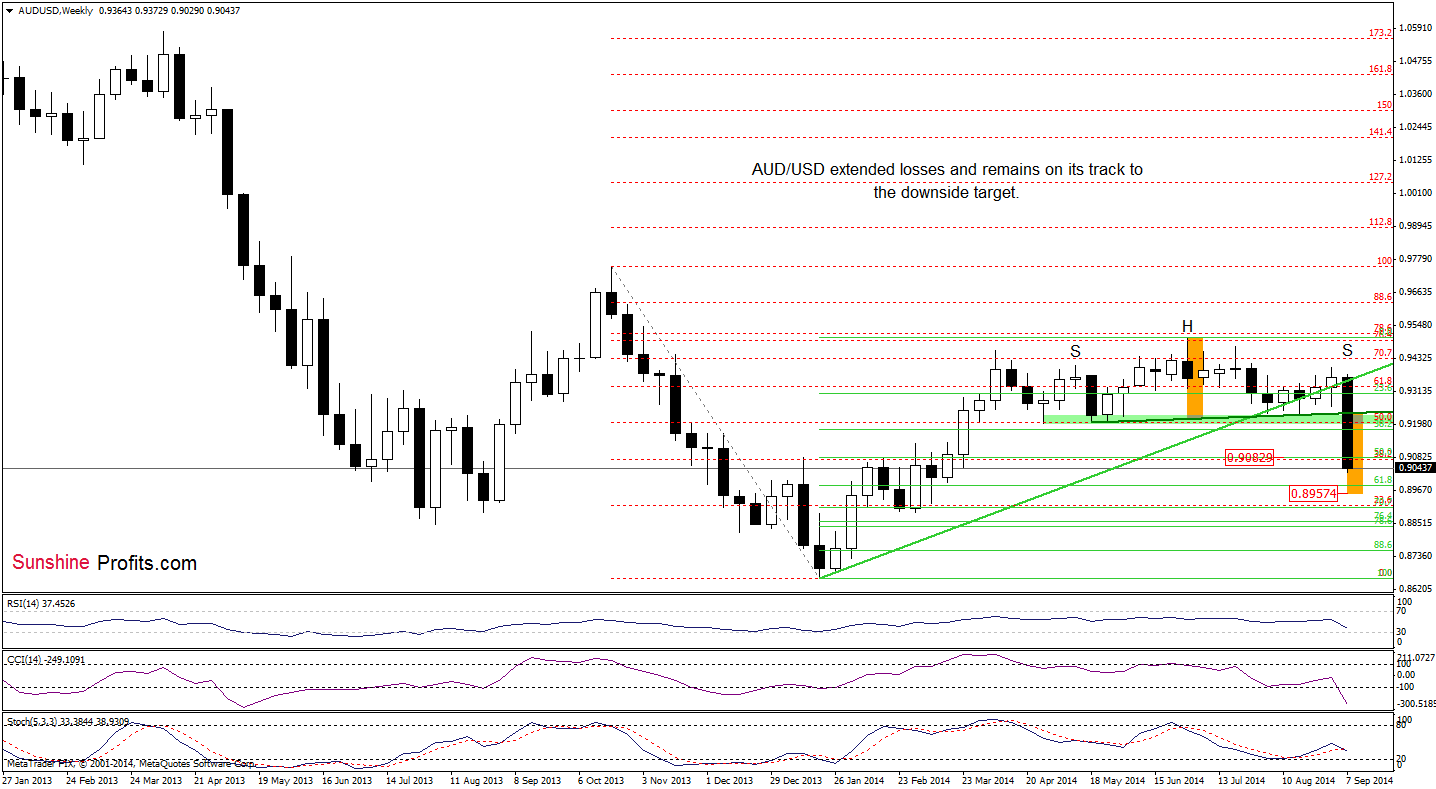
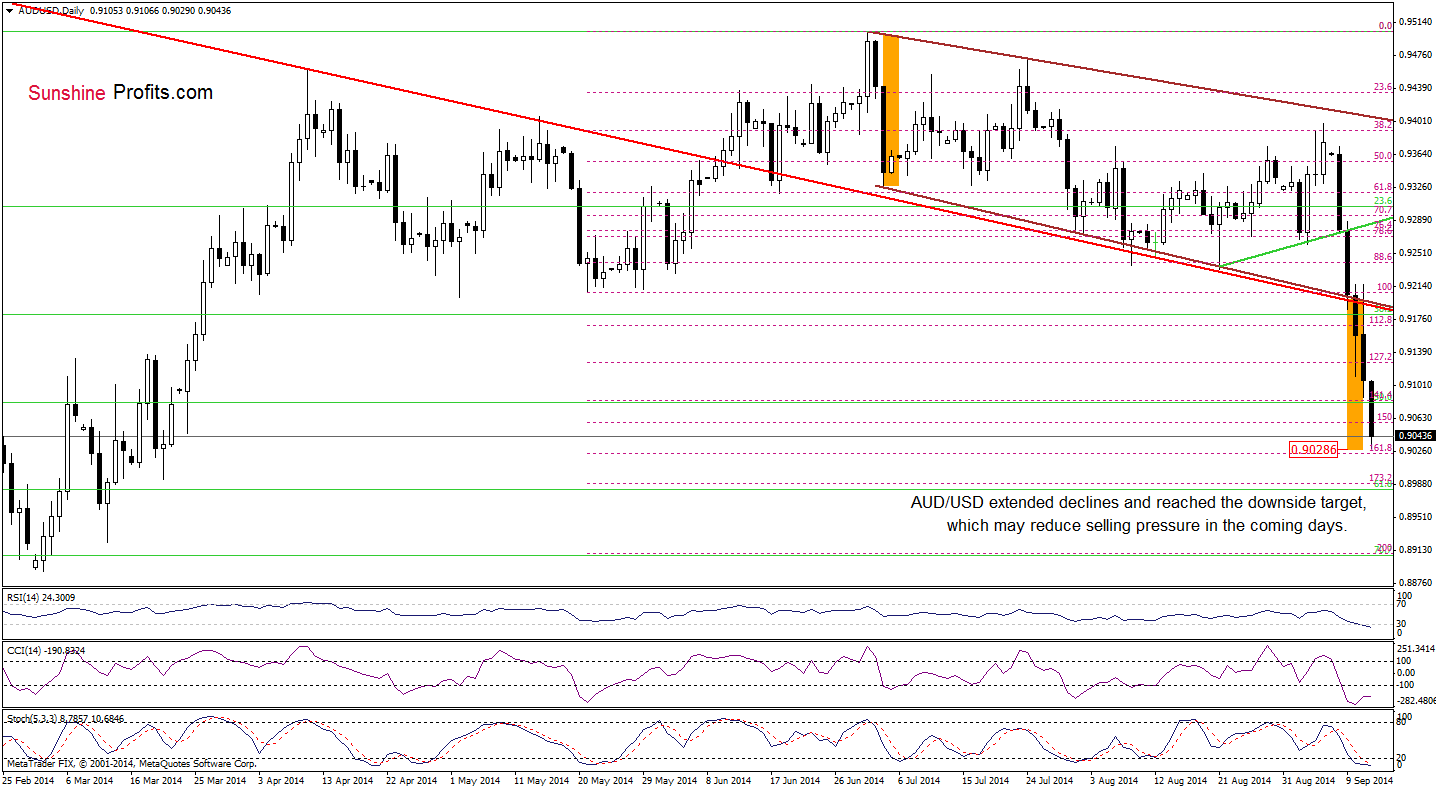
On the above chart, we see that the head and shoulders top formation is underway. Therefore, it seems to us that the exchange rate will extend losses and drop to 0.8957, where the size of the downward move will correspond to the height of the formation.
Are there any short-term support levels that could hinder the realization of the above-mentioned scenario? Let’s check.
Quoting our last commentary on this currency pair:
(…) a sharp decline (…) took the pair to slightly below the 127.2% Fibonacci extension. Although this support level caused a small upswing, we should keep in mind that a drop under the lower border of the declining trend channel suggests further deterioration and correction to around 0.9026, where the size of the move will correspond to the height of the formation (please note that this area is reinforced by the 161.8% Fibonacci extension). As you see on the above chart, the position of the indicators also favors currency bears at the moment.
Looking at the daily chart, we see that the situation developed in line with the above-mentioned scenario and the exchange rate reached our downside target. Taking this fact into account and combining it with the current position of the indicators (they are all oversold), we may see a reduce of selling pressure and a rebound from here in the coming days (especially when we factor in the strong support level created by the 161.8% Fibonacci extension). Nevertheless, as long as there are no buy signals, another attempt to move lower to realize the medium-term bearish scenario can’t be ruled out.
Very short-term outlook: mixed
Short-term outlook: mixed with bearish bias
MT outlook: mixed with bearish bias
LT outlook: bearish
Trading position (short-term): In our opinion no positions are justified from the risk/reward perspective. We will keep you informed should anything change, or should we see a confirmation/invalidation of the above.
Thank you.
Nadia Simmons
Forex & Oil Trading Strategist
Przemyslaw Radomski, CFA
Founder, Editor-in-chief
Gold & Silver Trading Alerts
Forex Trading Alerts
Oil Investment Updates
Oil Trading Alerts

