
Earlier today, the Department of Labor reported that the U.S. economy added 142,000 jobs in August, missing expectations for a 225,000 increase. Additionally, the report showed that the U.S. unemployment rate ticked down to 6.1% last month, from 6.2%, but in line with expectations. These disappointing numbers dampened demand for the greenback. What impact did it have on major currency pairs? Did it change their short-term outlook?
In our opinion the following forex trading positions are justified - summary:
EUR/USD
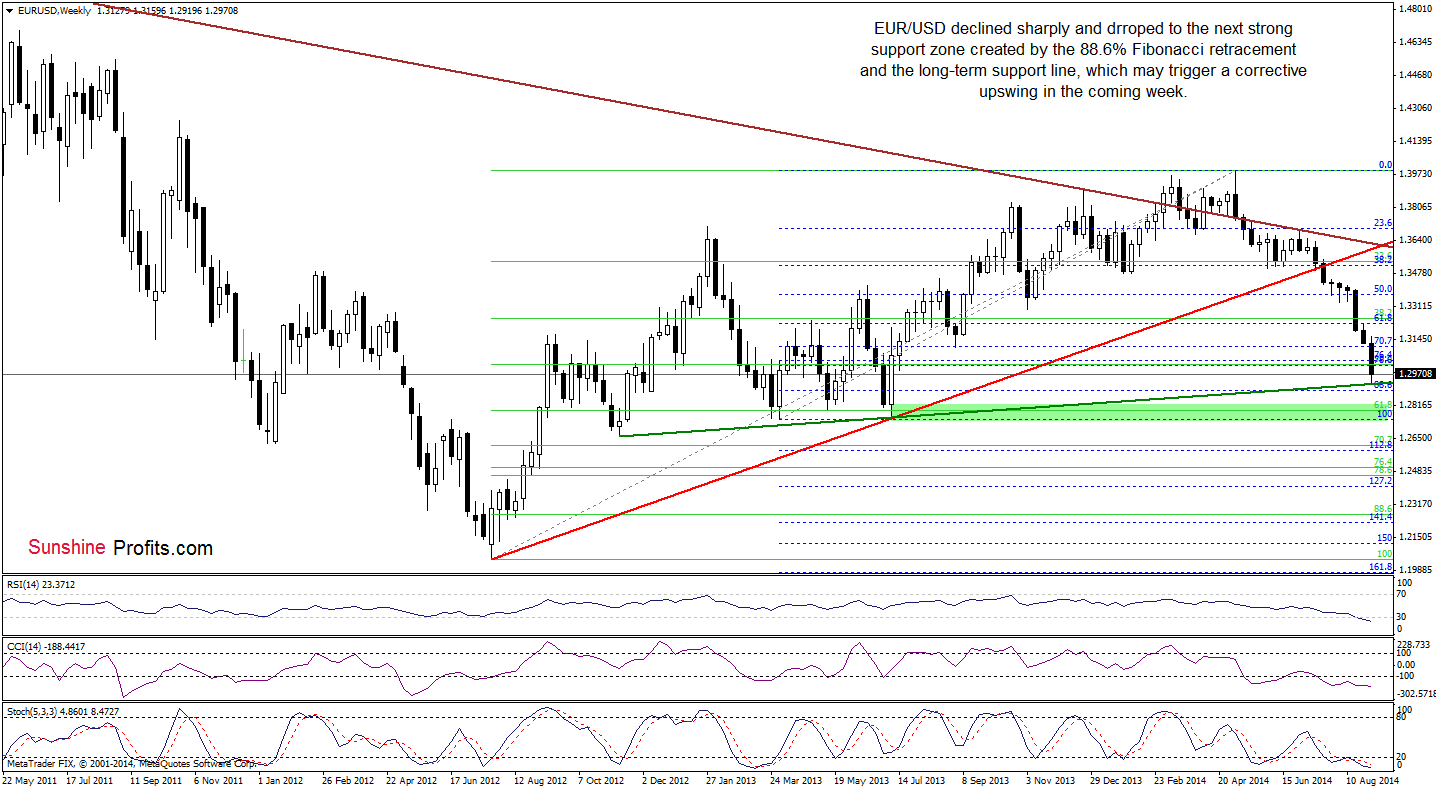
The medium-term picture hasn’t changed much since yesterday and EUR/USD still remains slightly above the support one created by the 88.6% Fibonacci retracement and the long-term green support line based on the Nov 2012 and Jul 2013 lows. Therefore, we still believe that this strong support area should (at least) pause further deterioration in the nearest future and trigger a corrective upswing.
Can we find more clues about future moves on the daily chart? Let’s find out.
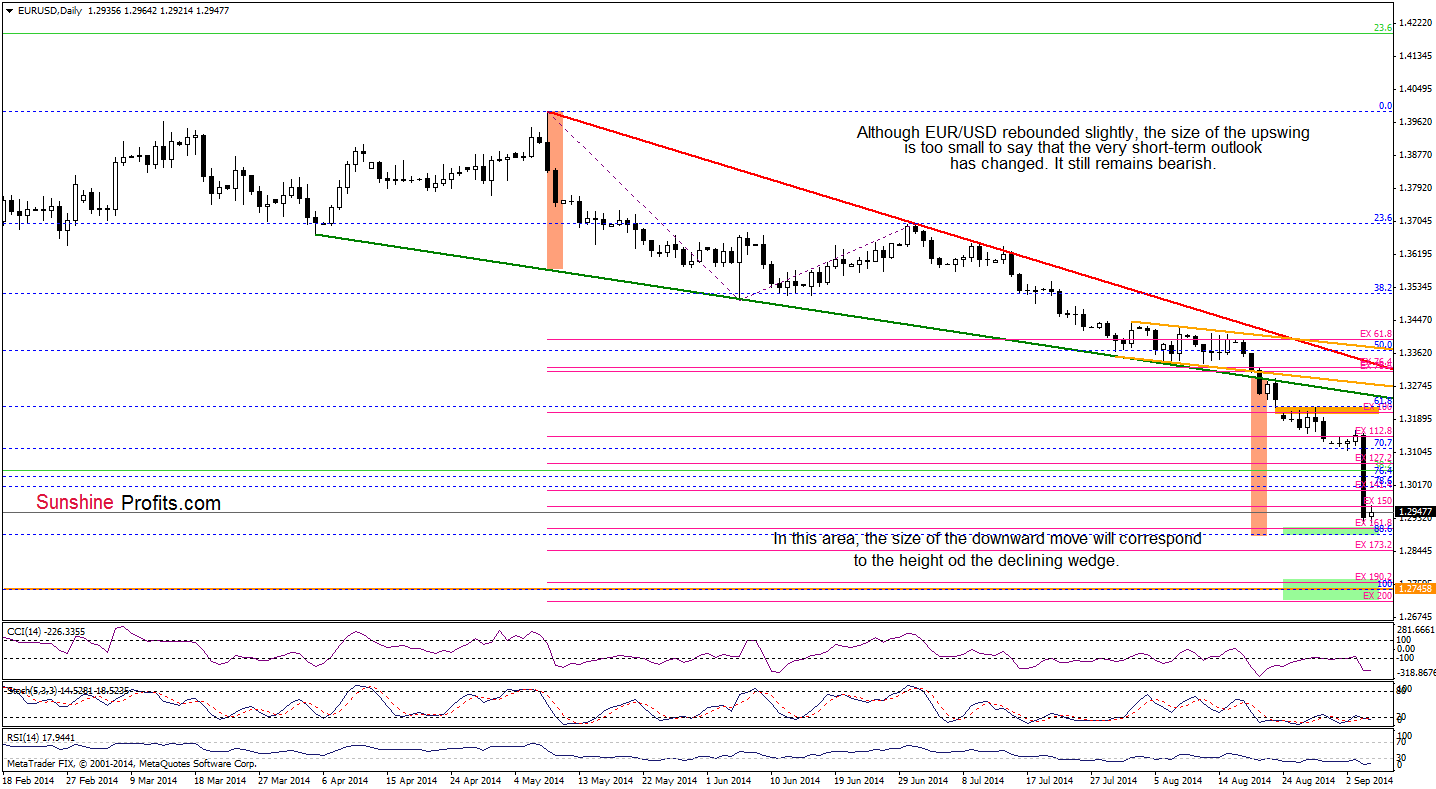
Earlier today, EUR/USD rebounded slightly, but (so far) the size of the upswing is too small to say that the very short-term outlook has changed. Nevertheless, we believe that our last commentary is up-to-date:
(…) EUR/USD declined not only to the support levels that we discussed earlier, but also approached the 161.8% Fibonacci price projection. On top of that, in this area, the size of the downswing corresponds to the height of the declining wedge, which may reduce the selling pressure in the near future. Therefore, if this support zone holds, we may see a corrective upswing to at least the recent highs around 1.3145-1.3160.
Very short-term outlook: mixed
Short-term outlook: mixed
MT outlook: mixed
LT outlook: bearish
Trading position (short-term): In our opinion no positions are justified from the risk/reward perspective. We will keep you informed should anything change, or should we see a confirmation/invalidation of the above.
GBP/USD
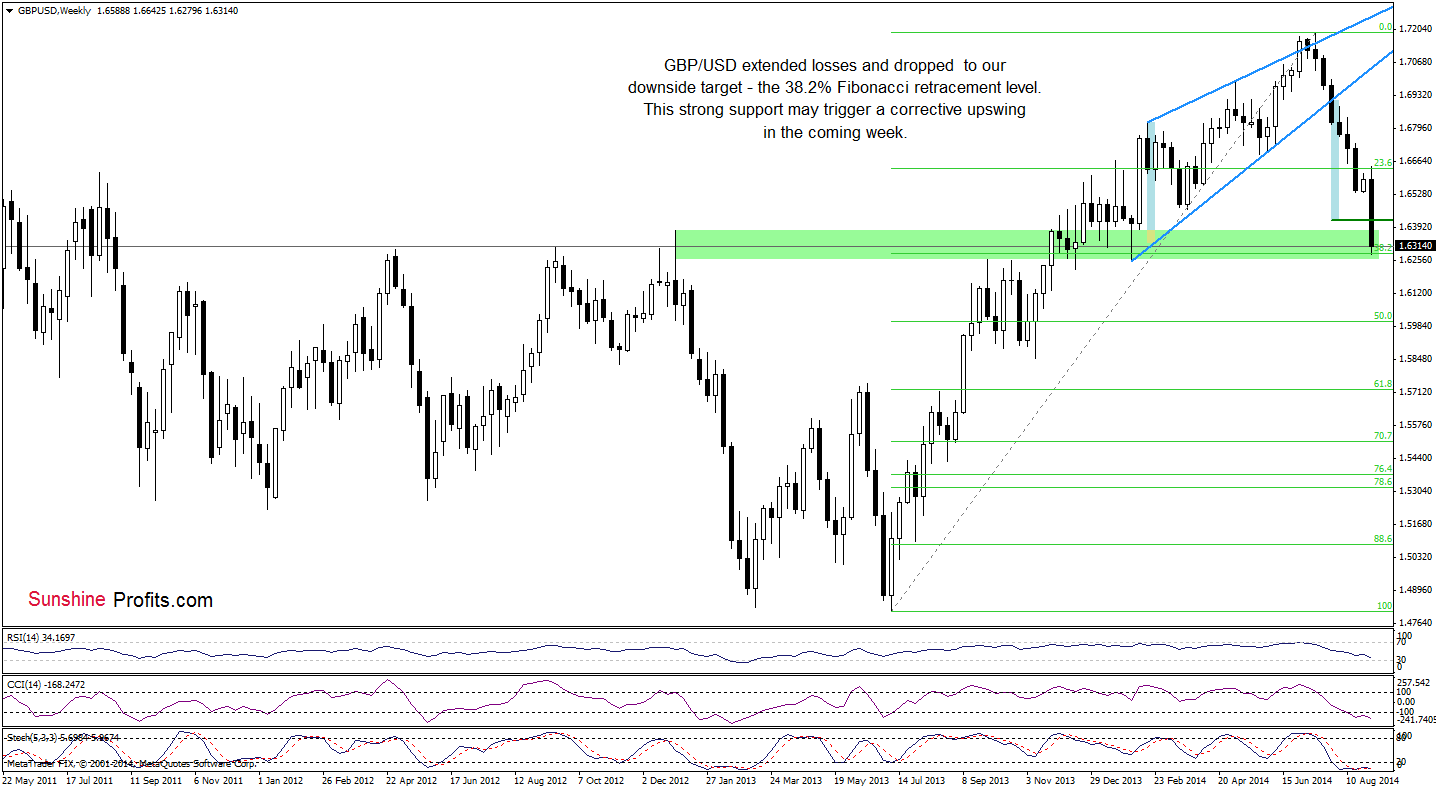
Yesterday, we wrote the following:
(…) Such drop suggests that GBP/USD will likely move lower and reach the 38.2% Fibonacci retracement in the coming week.
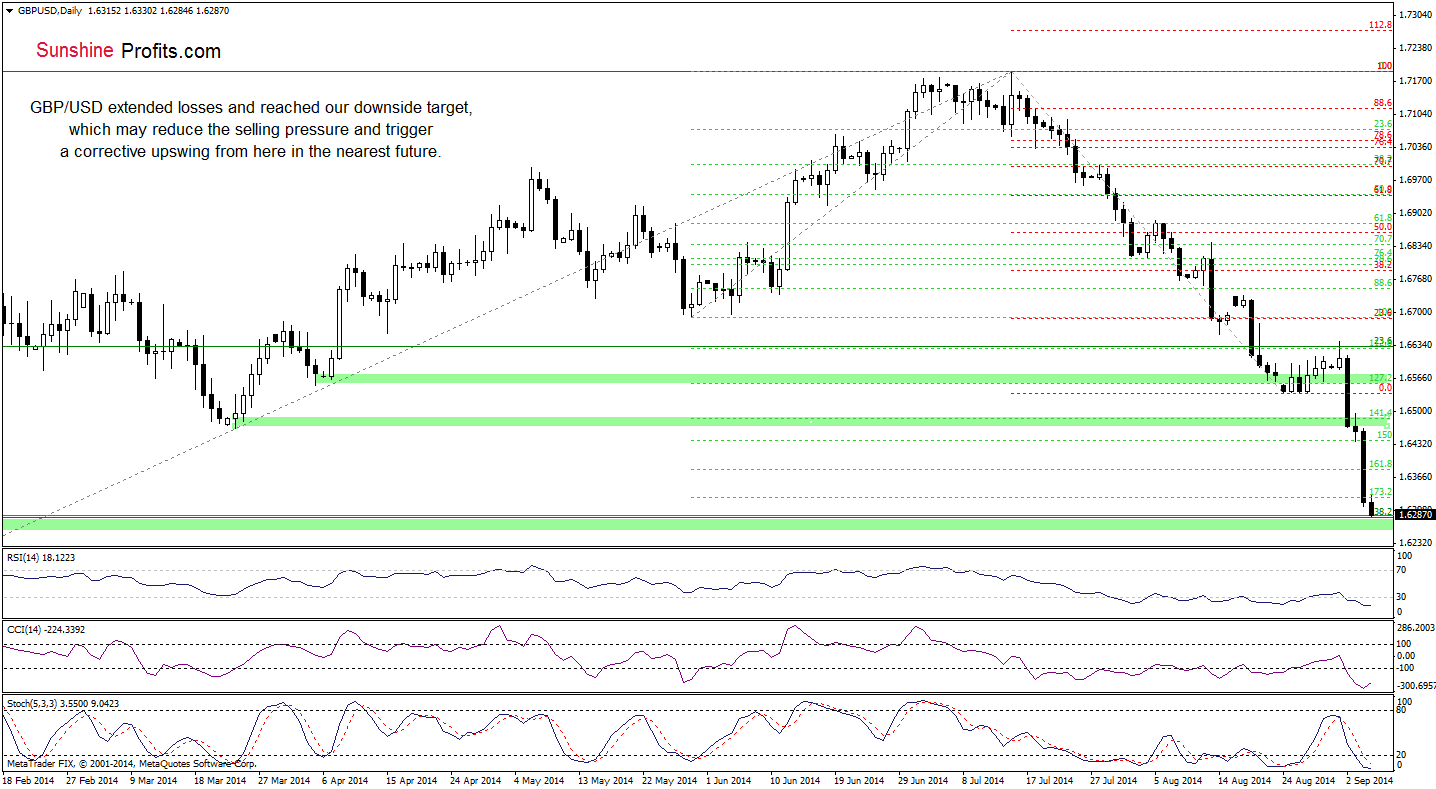
The above charts clearly show that we saw a realization of the above-mentioned scenario faster than expected. What’s next? Taking into account the strength of the green support zone, it seems to us that we’ll see a corrective upswing in the coming week – especially if the short-term indicators generate buy signals. If this is the case, the initial upside target will be around 1.6642, where this week’s high is.
Very short-term outlook: mixed with bullish bias
Short-term outlook: mixed with bearish bias
MT outlook: bearish
LT outlook: mixed
Trading position (short-term): In our opinion, no positions are justified from the risk/reward perspective. We will keep you informed should anything change, or should we see a confirmation/invalidation of the above.
USD/JPY
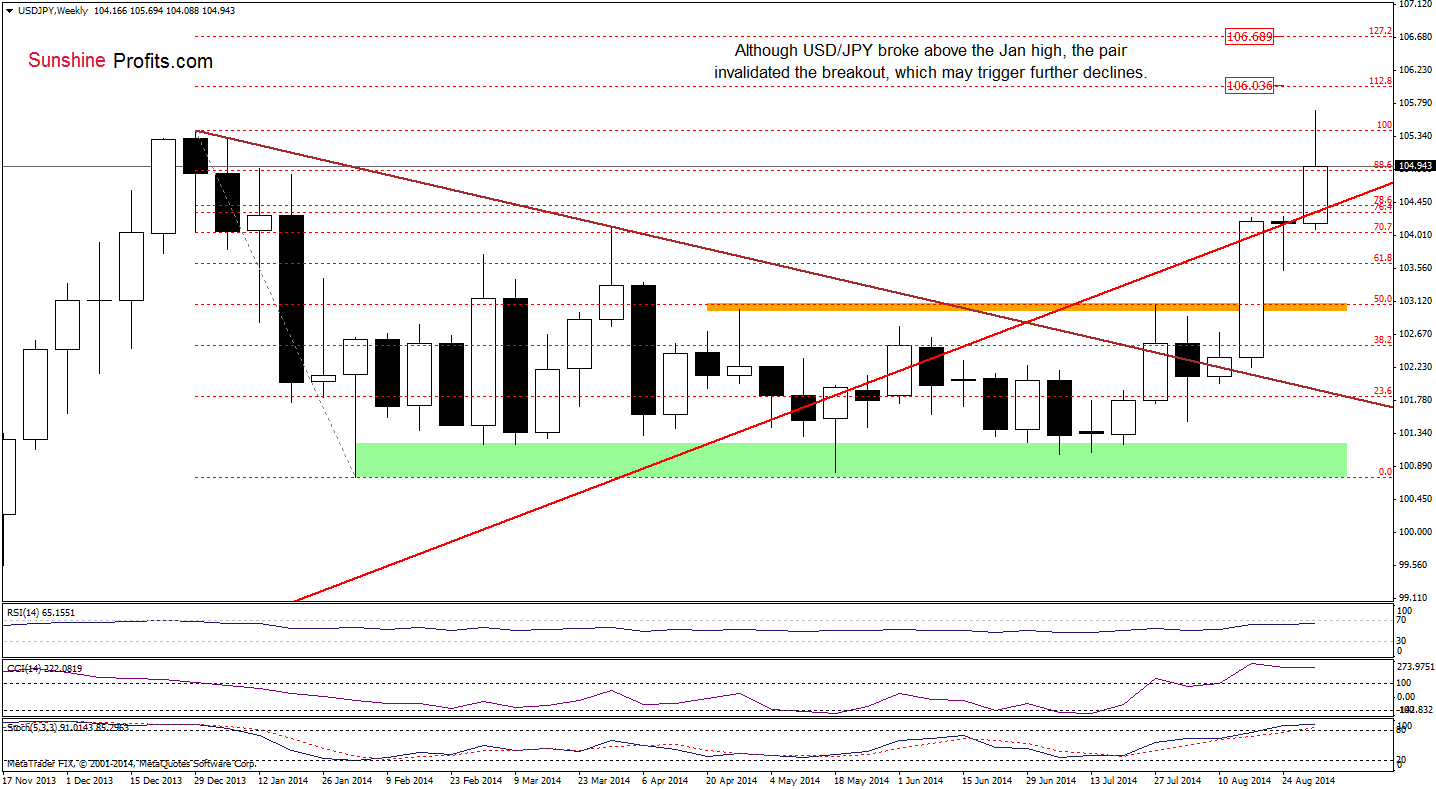
On the above chart, we see USD/JPY moved higher and broke above the Dec high. Despite this rally, the pair reversed and invalidated earlier breakout, which is a bearish signal. Additionally, the CCI and Stochastic Oscillator are overbought, while the RSI reached its highest levels since the beginning of the year. Taking all the above into account, it seems that the exchange rate may extend losses and test the strength of the previously-broken red support/resistance line (currently at 104.30) in the coming week.
What can we infer from the daily chart? Let’s check.
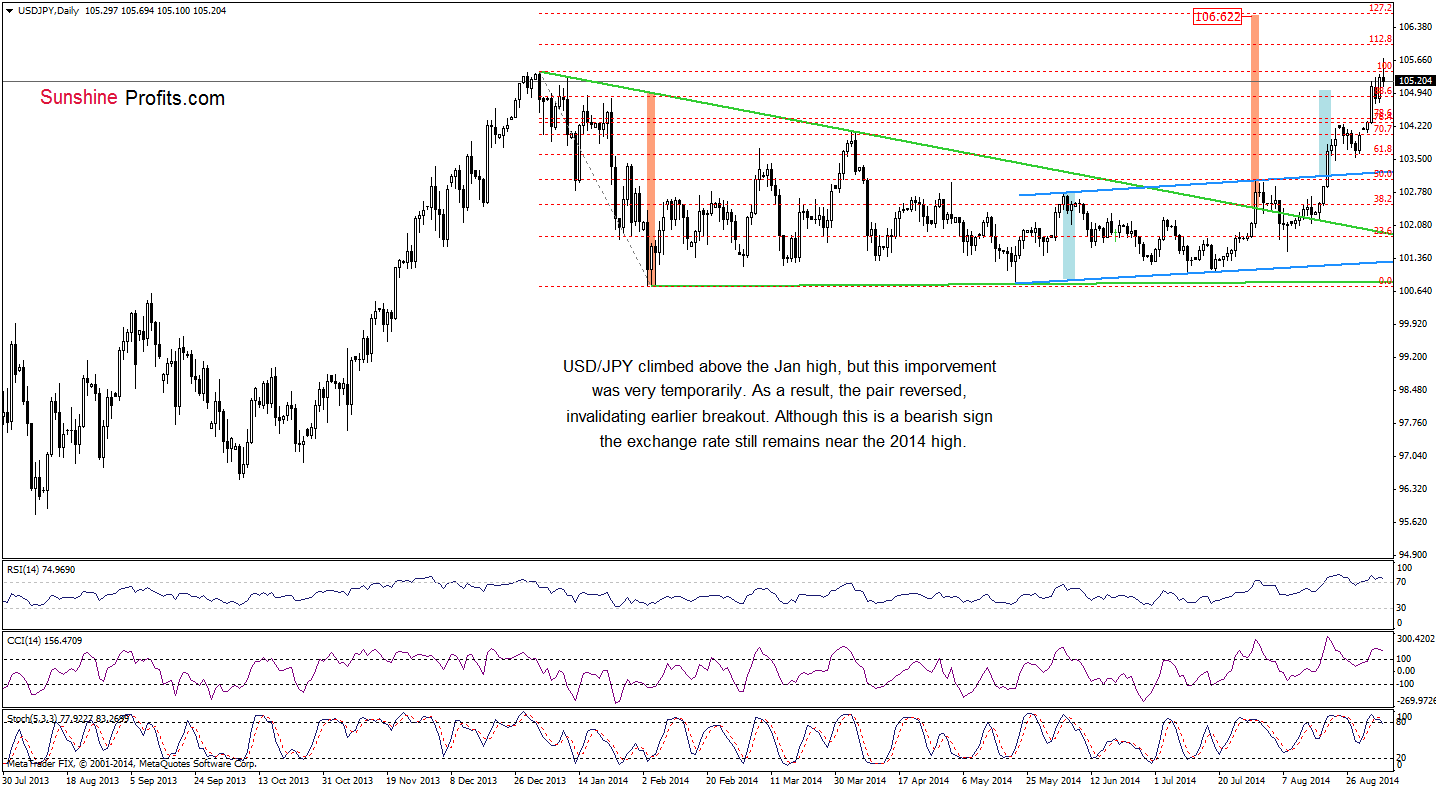
From this perspective, we can see that although USD/JPY invalidated the breakout, the pair is still trading quite close the fresh 2014 high. Nevertheless, if the indicators generate sell signals, we may see further deterioration and a drop to around 104.08, where the 38.2% Fibonacci retracement based on the Aug rally is.
Very short-term outlook: mixed with bearish bias
Short-term outlook: mixed
MT outlook: mixed
LT outlook: bearish
Trading position (short-term): In our opinion no positions are justified from the risk/reward perspective at the moment. We will keep you informed should anything change, or should we see a confirmation/invalidation of the above.
USD/CAD
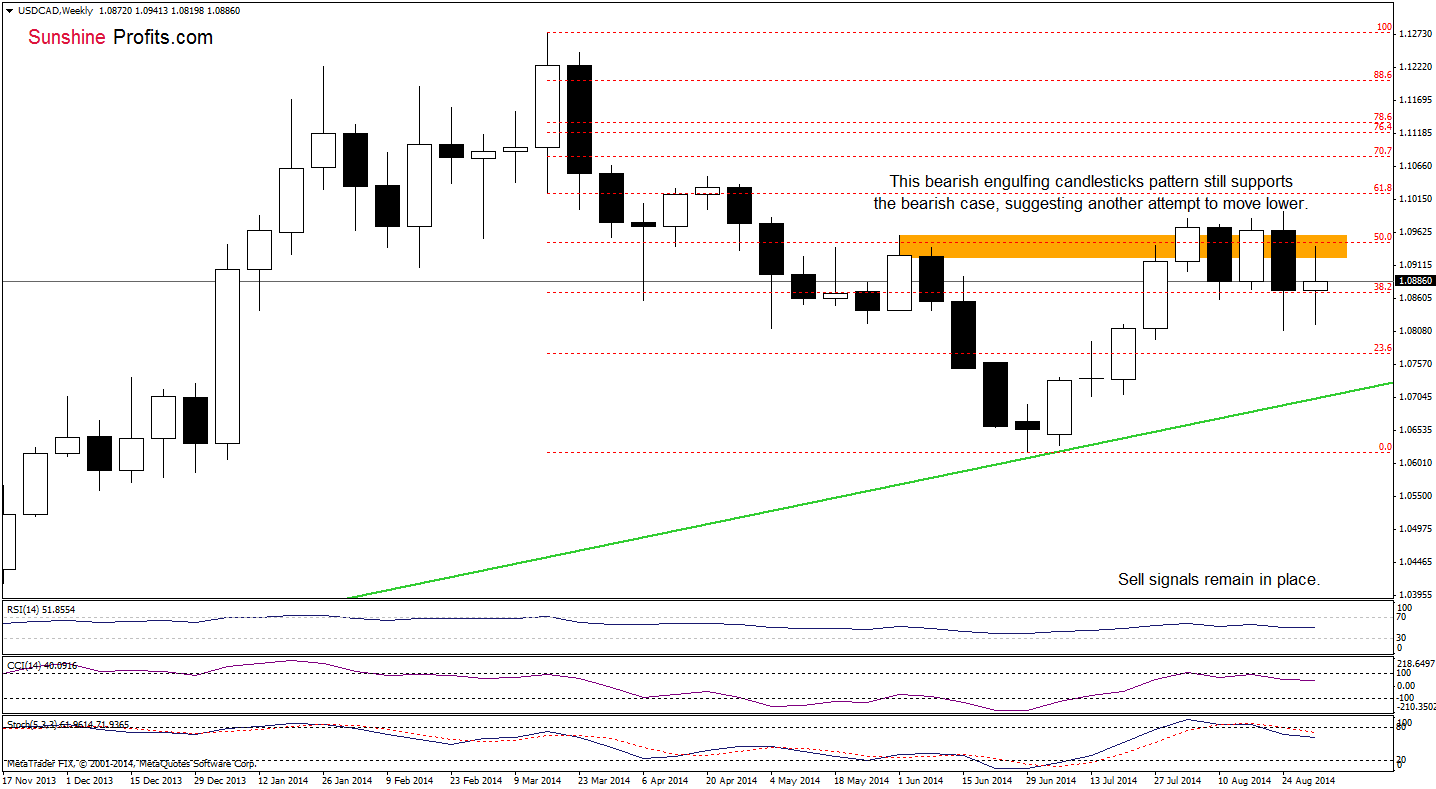
Although the medium-term outlook has improved slightly as USD/CAD rebounded, the pair still remains below the recent highs. Additionally, the bearish engulfing candlesticks pattern in combination with sell signals generated by the indicators still supports currency bears, suggesting another attempt to move lower.
Having say that, let’s examine the daily chart.
Quoting our last commentary on this currency pair:
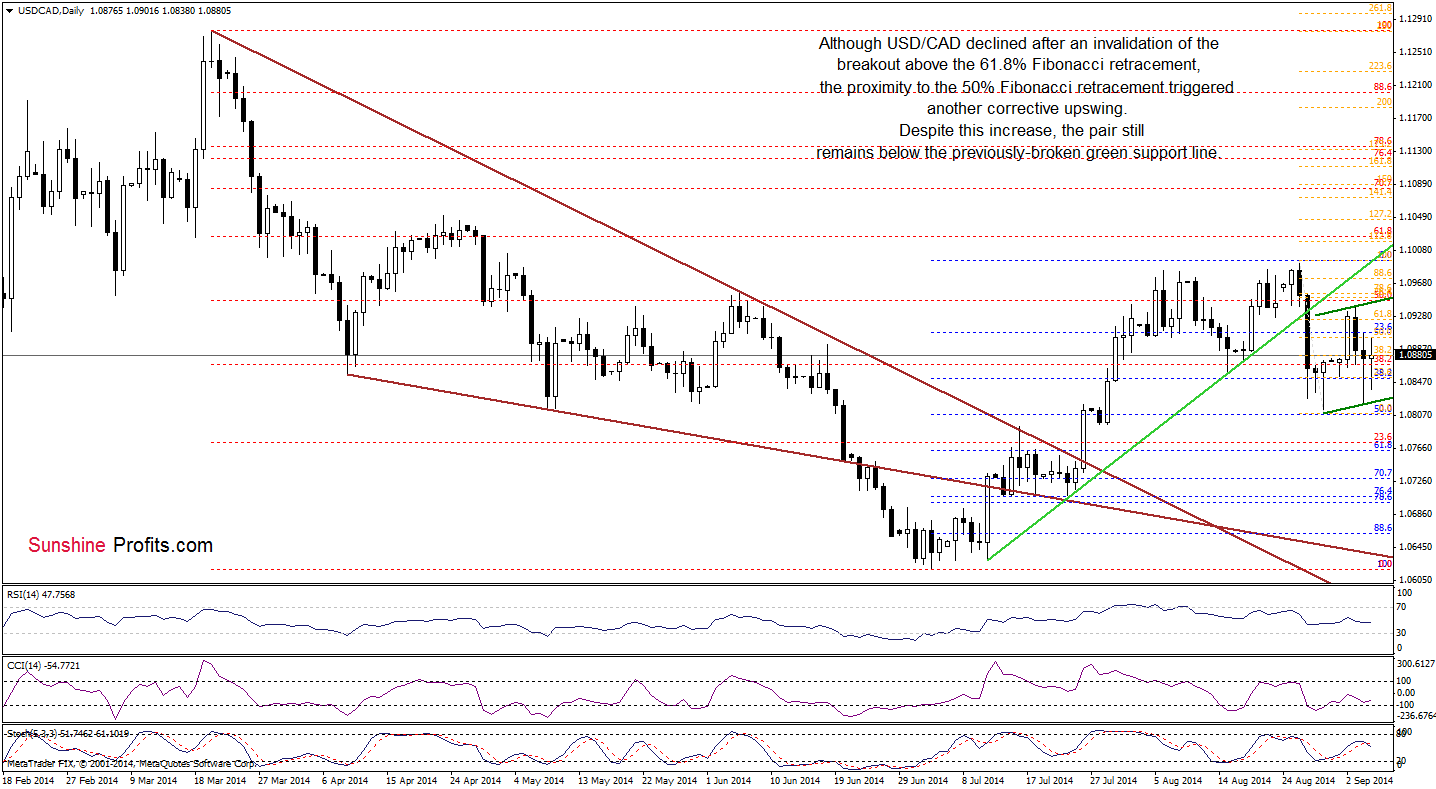
(…) USD/CAD invalidated a breakout above this resistance level, which is a bearish sign that suggests further deterioration (especially when we factor in the fact that the exchange rate still remains below the previously-broken the green resistance line based on the Jul 7, Jul 23 and Aug 15 lows). If this is the case, we’ll see a drop to the nearest support around 1.0855, where the bottom of the recent pullback is. If this level is broken, the pair will test the strength of the 50% Fibonacci retracement once again.
Looking at the above chart, we see that the situation developed in line it the above-mentioned bearish scenario and the exchange rate declined to slightly above our downside target. As you see, the 50% Fibonacci retracement triggered a corrective upswing – similarly to what we saw at the end of August. Despite this move, the pair is still trading below the green resistance line, which means that as long as there is no invalidation of the breakdown, another attempt to move lower can’t be ruled out.
Very short-term outlook: mixed
Short-term outlook: mixed
MT outlook: mixed
LT outlook: bearish
Trading position (short-term): In our opinion no positions are justified from the risk/reward perspective. We will keep you informed should anything change, or should we see a confirmation/invalidation of the above.
USD/CHF
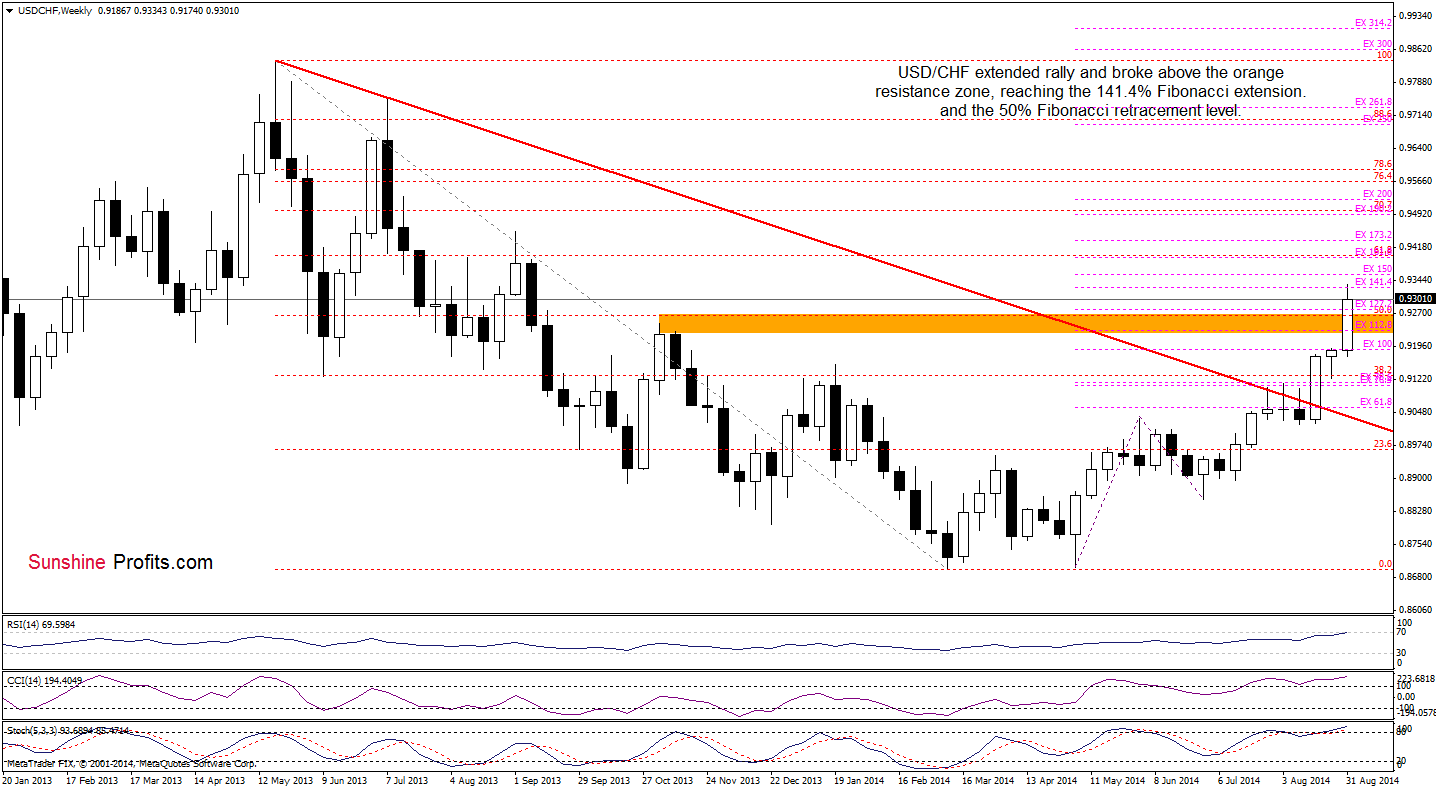
The medium-term outlook has improved significantly as USD/CHF succesfully broke not only above the 100% Fibonacci price projection, but also the orange resistance zone. This strong bullish signal triggered further improvement and the exchange rate climbed to the 141.4%Fibonacci price projection, which serves as the nearest resistance. Will we see an increase to the 50% Fibonacci retracement in in the coming week? Let’s take a closer look at the daily chart and find out.
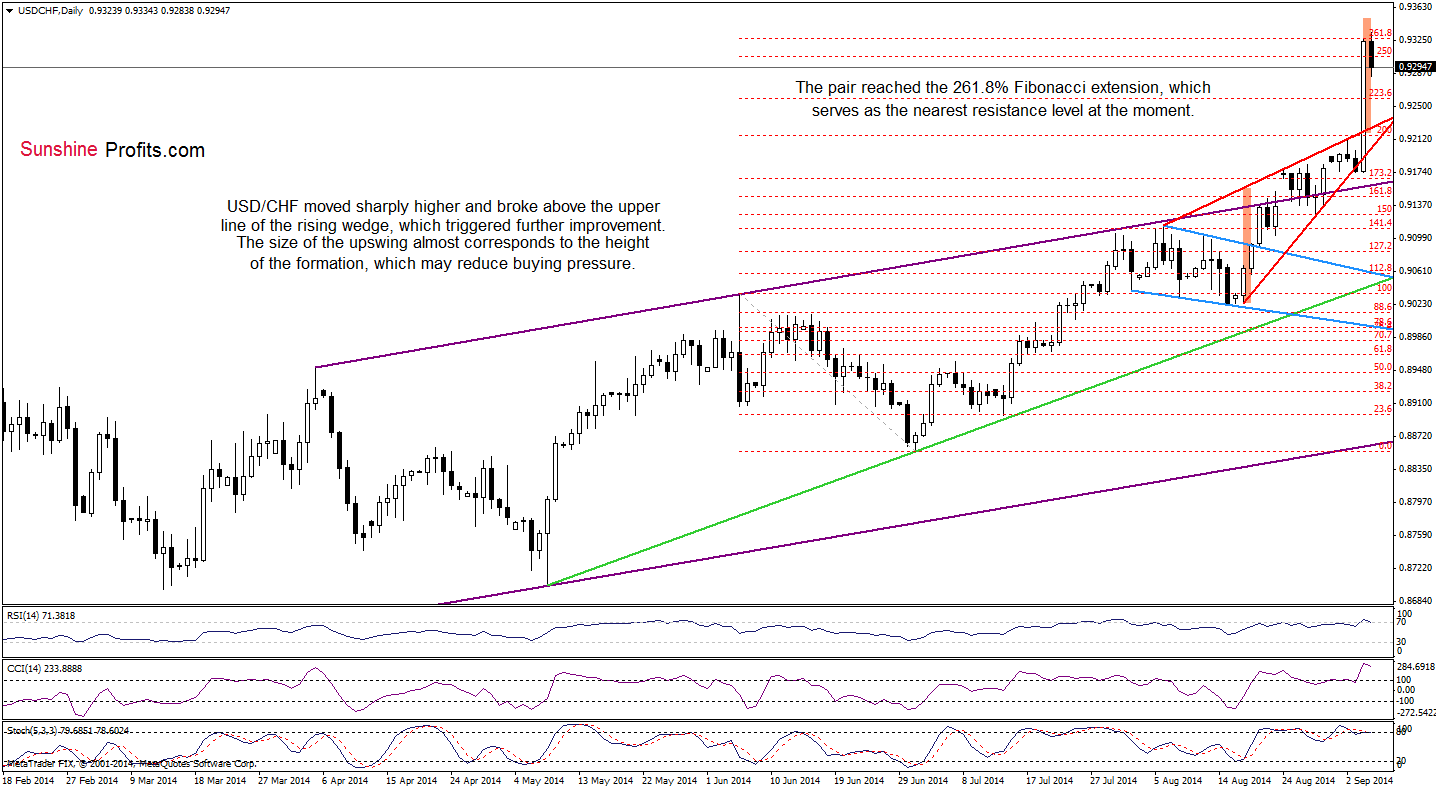
The first thing that catches the eye on the above chart is a breakout above the upper line of the rising wedge (marked with red). Although this is a bearish formation, which usually precedes corrections, this time currency bulls didn’t give up and managed to push the pair higher, using favorable fundamental factors (yesterday’s unexpected the ECB decision and solid U.S. data). As you see, the size of the rally almost corresponds to the height of the formation, which may reduce buying prssure in the coming days – especialy when we factor in the fact that USD/CHF reached the 216.8% Fibonacci extension and all indicators are overbought (additionally there is a negative divergence between the Sochastic Oscillator and the exchange rate). Taking all the above into account, it seems to us that we may see further deterioration and a comback to the previously-broken upper line of the rising wedge in the coming days.
Very short-term outlook: mixed with bearish bias
Short-term outlook: mixed with bearish bias
MT outlook: mixed with bullish bias
LT outlook: bearish
Trading position (short-term): In our opinion no positions are justified from the risk/reward perspective. We will keep you informed should anything change, or should we see a confirmation/invalidation of the above.
AUD/USD
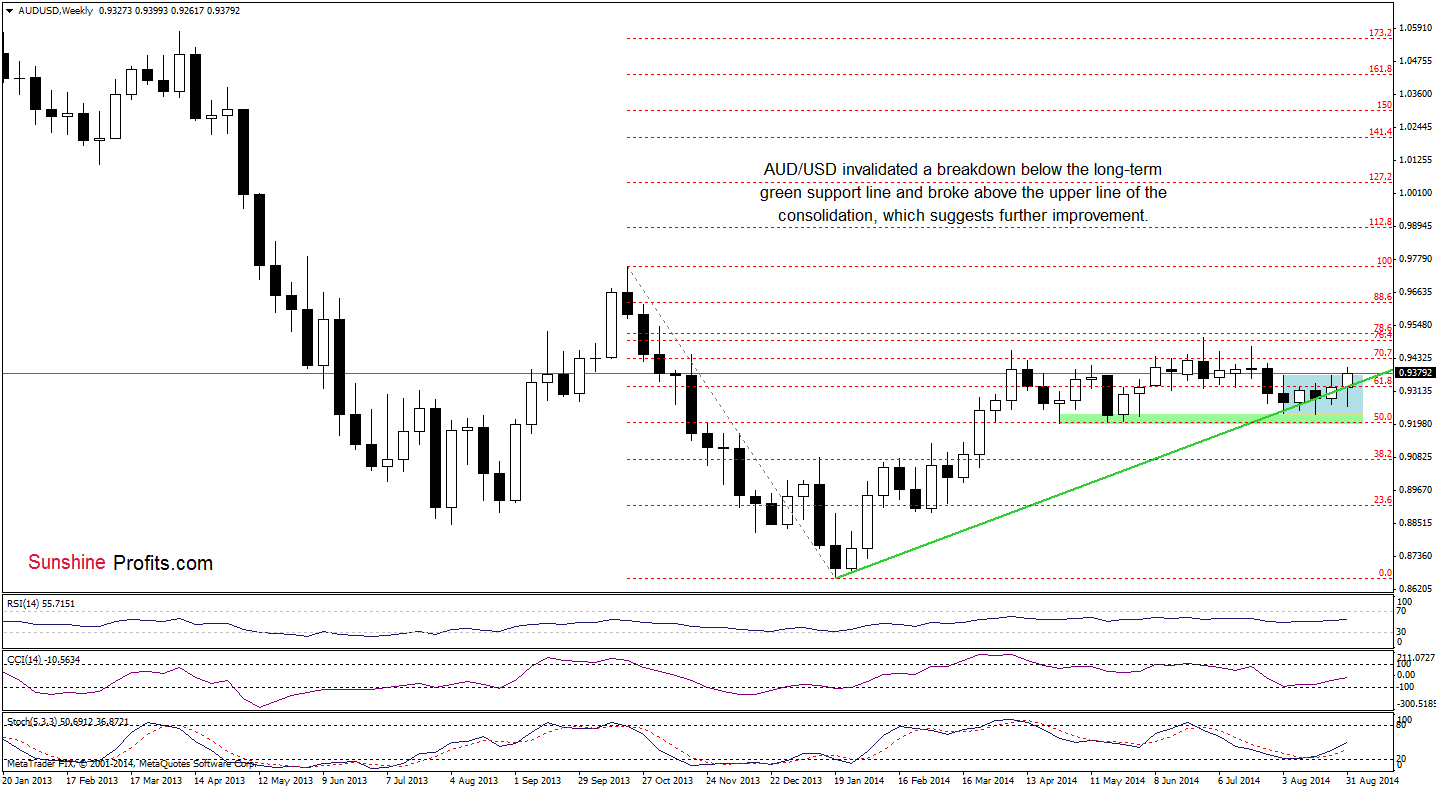
The medium-term picture has improved as AUD/USD invalidated earlier breakdown below the long-term green support line and climbed above the upper line of the consolidation (marked with blue). Taking these bullish signals into account and combining them with buy signals generated by the indicators, we think that the pair will extend rally and the next upside target will be around 0.9472, where the Jul high is.
Are there any short-term resistant levels that could hinder the realization of the above-mentioned scenario? Let’s check.
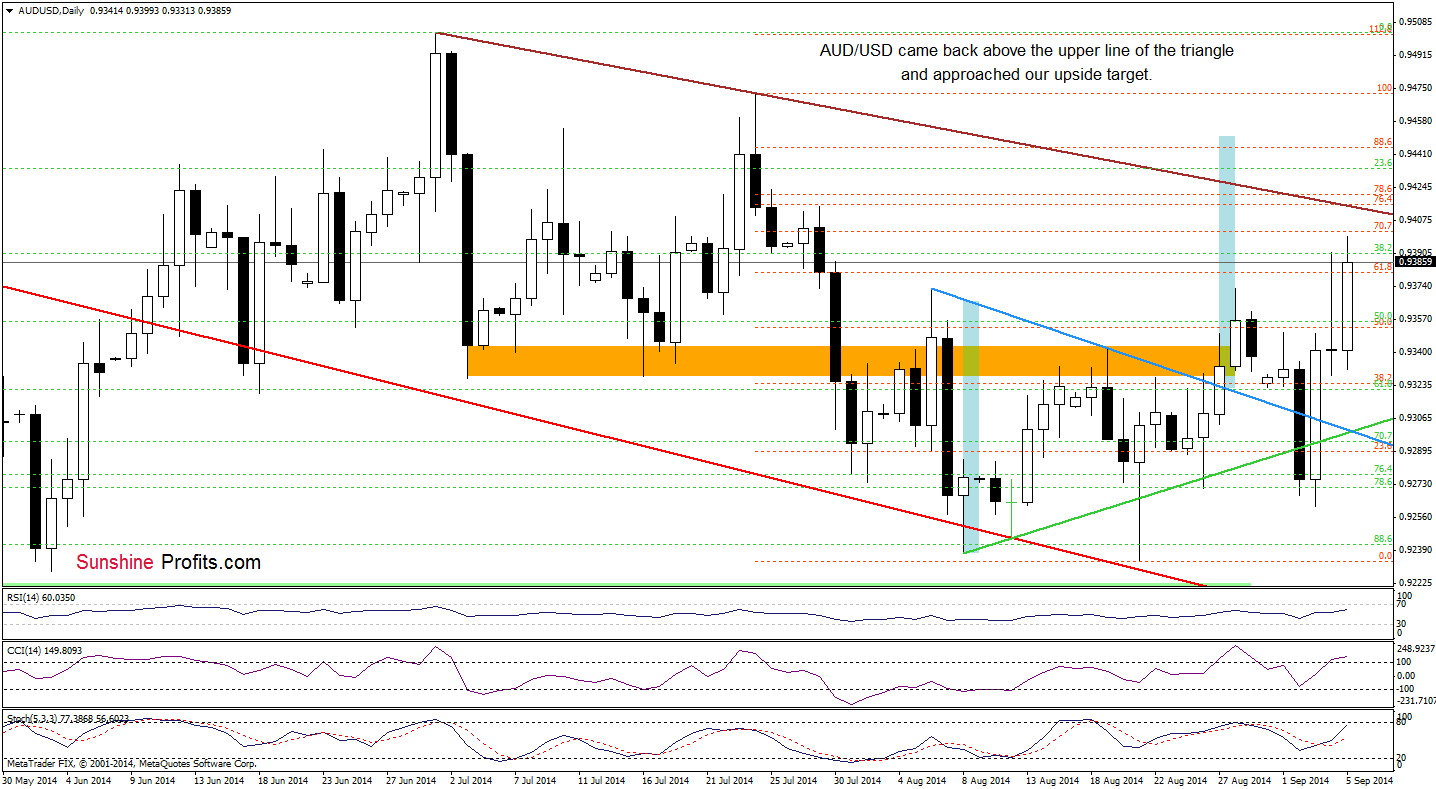
From this perspective, we see that although AUD/USD moved lower and invalidated a breakout above the upper line of the triangle (which was a bearish signal that triggered further deterioration and a drop to the previous low), the pair rebounded sharply and climbed not only above the previous high, but also the 61.8% Fibonacci retracement. This is a bullish signal, which suggests that the pair will test the strength of the brown declining resistance line, which currently intersects the strong resistance one created by the 76.4% and 78.6% Fibonacci retracements. Please note that although the CCI is overbought, the Stochastic Oscillator and RSI still have some much for growth, which supports the bullish case at the moment.
Very short-term outlook: bullish
Short-term outlook: mixed
MT outlook: mixed
LT outlook: bearish
Trading position (short-term): In our opinion, no positions are justified from the risk/reward perspective. We will keep you informed should anything change, or should we see a confirmation/invalidation of the above.
Thank you.
Nadia Simmons
Forex & Oil Trading Strategist
Przemyslaw Radomski, CFA
Founder, Editor-in-chief
Gold & Silver Trading Alerts
Forex Trading Alerts
Oil Investment Updates
Oil Trading Alerts

