
Earlier today, the U.S. currency moved higher against most of major currencies as the Commerce Department showed that the U.S. economy expanded 3.2% in the fourth quarter, which fueled demand for the greenback. This positive news for the U.S. dollar came one day after the Federal Reserve reduced bond purchases to $65 billion a month showing that neither a disappointing December jobs report nor recent turmoil in emerging markets was enough to diminish their positive outlook for the U.S. economy. What impact did these events have on major currency pairs? If you want to know our take on this question, we invite you to read our today's Forex Trading Alert.
Forex Trading Positions - Summary:
EUR/USD
Quoting our last Forex Trading Alert:
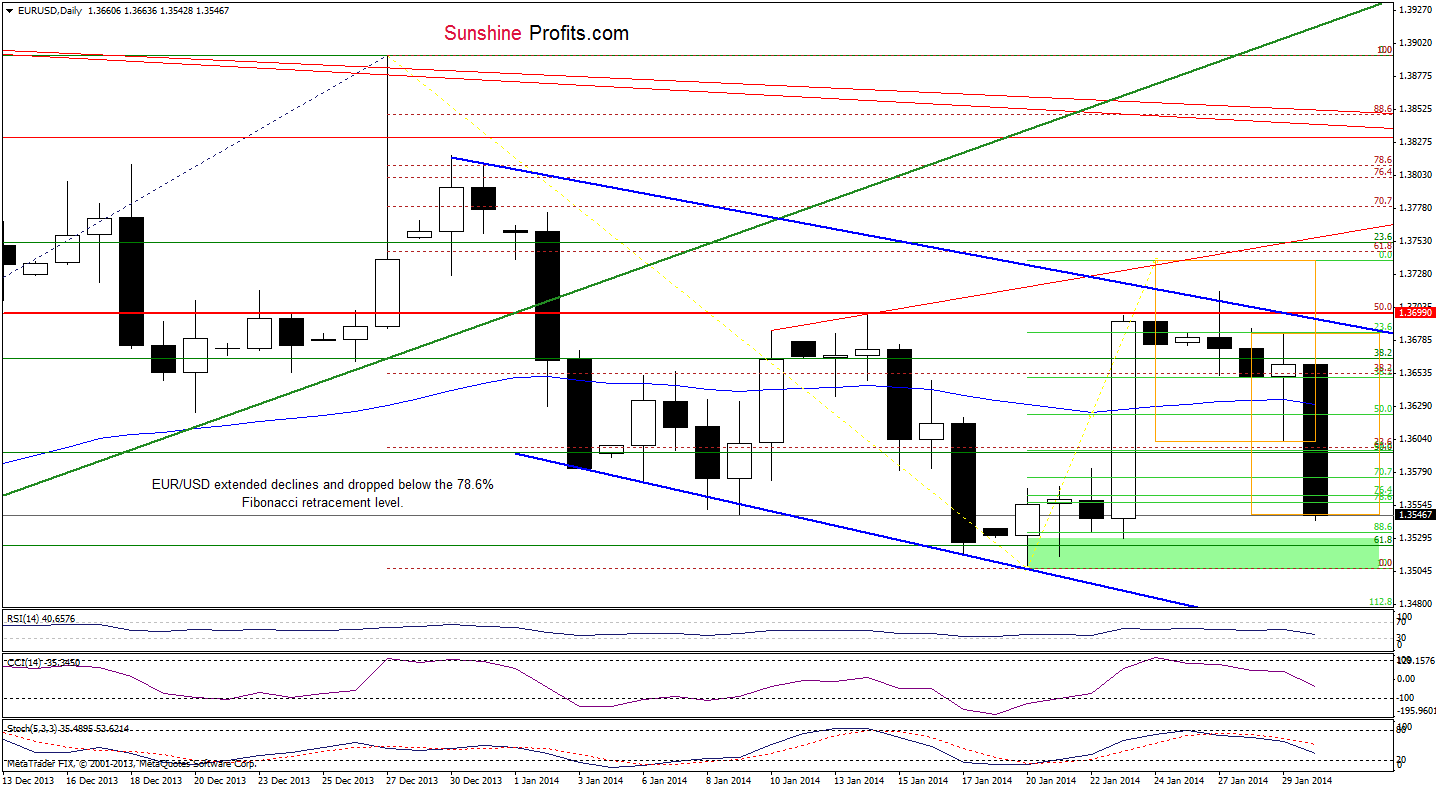
(…) although the pair reversed and came back above the 50-day moving average, it still remains below the upper line of the declining trend channel (marked with blue). As you see on the daily chart, this resistance line successfully stopped recent attempts to reach the 61.8% Fibonacci retracement level based on the entire Dec.-Jan. decline. Additionally, sell signals generated by the CCI and Stochastic Oscillator remain in place supporting the bearish case.
Looking at the above chart, we see that the situation has deteriorated significantly as EUR/USD extended its decline and dropped below the 78.6% Fibonacci retracement level based on the entire Dec.-Jan. decline. With this downward move, the pair almost reached a support zone created by recent lows (marked with green). Additionally, when we compare this downward move to the previous one, we see that they are similar (both orange rectangle on the daily chart). On top of that, EUR/USD approached the Jan.23 low, which is a lower border of a consolidation range. When we take a closer look at the chart, we clearly see that the pair has been trading in recent days between this level and the Jan. 23 high.
From this perspective, the situation is mixed. On one hand, if the support zone encourages buyers to act we will likely see an upward corrective move. On the other hand, if they fail and the pair extend its decline we will likely see a re-test of the strength of the January low.
Very short-term outlook: mixed
Short-term outlook: mixed
MT outlook: mixed
LT outlook: bearish
Trading position (short-term): we do not suggest opening any trading positions at the moment. We will keep you informed should anything change, or should we see a confirmation/invalidation of the above.
GBP/USD
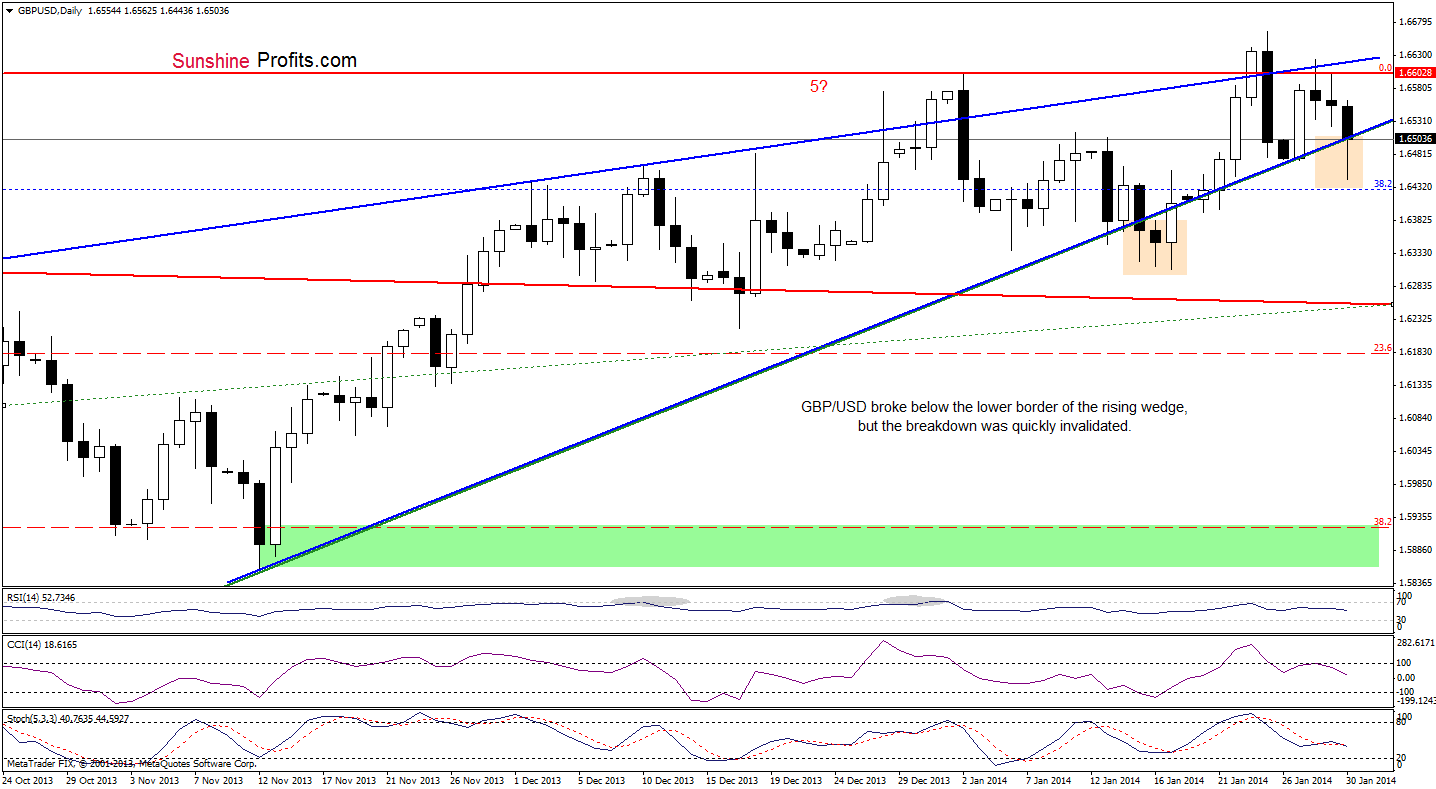
Looking at the above chart, we clearly see that the situation hasn’t changed much. Although GBP/USD broke below the lower line of the rising wedge earlier today, the pair quickly reversed and invalidated the breakdown. This is a positive signal, but when we factor in the position of the indicators we notice that it’s not as bullish as it seems at the first sight. Nevertheless, from this perspective, it seems that as long as GBP/USD remains in a rising wedge (marked with blue), we won’t see bigger upside (or downside) move. However, taking into account the fact that the upper and lower border of the rising wedge approaching each other, it seems that a breakthrough is just around the corner.
Very short-term outlook: mixed with bearish bias
Short-term outlook: mixed
MT outlook: mixed
LT outlook: mixed
Trading position (short-term): we do not suggest opening any trading positions at the moment. We will keep you informed should anything change, or should we see a confirmation/invalidation of the above.
USD/JPY
On the above chart, we see that the situation hasn’t changed much and what we wrote in last Forex Trading Alert remains up-to-date:
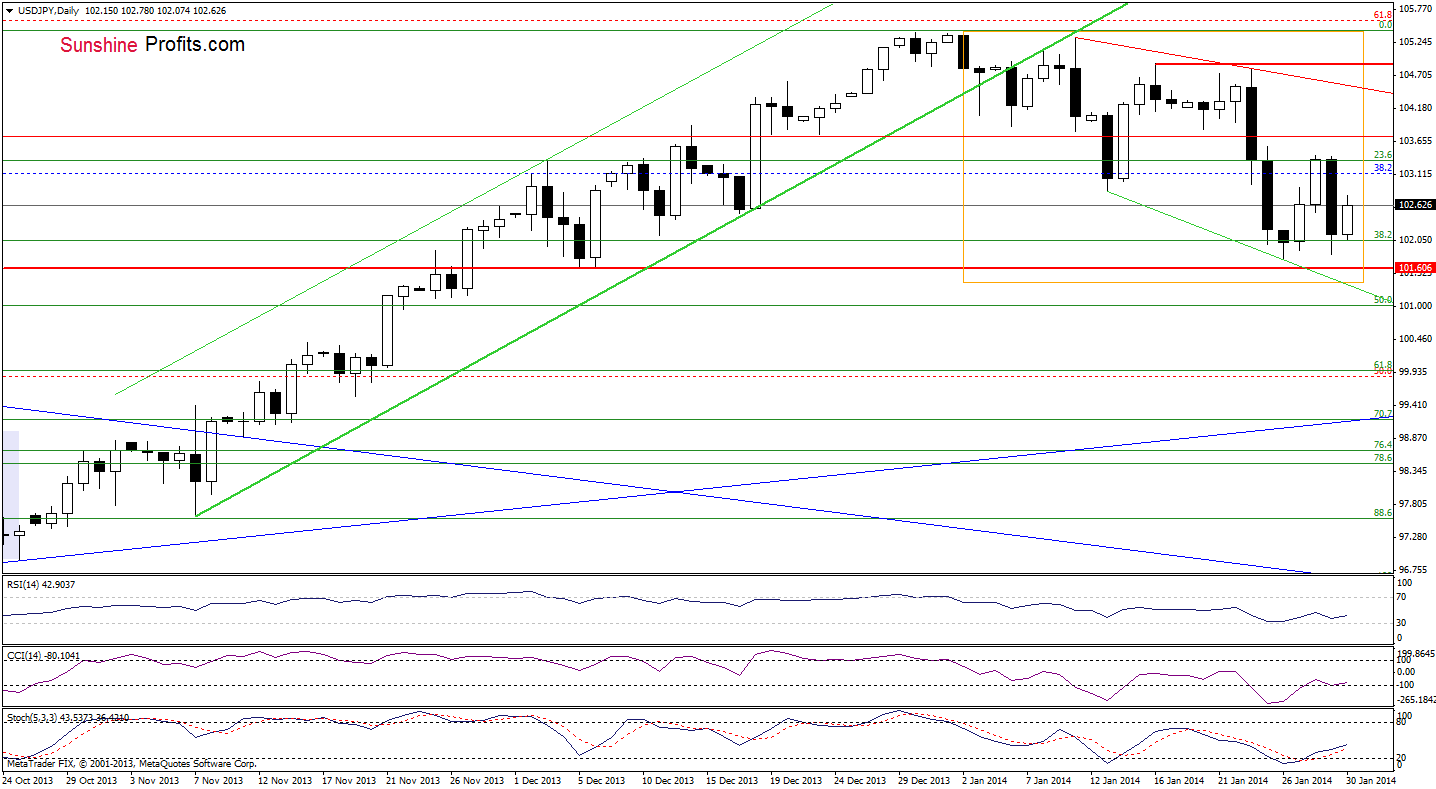
(…) USD/JPY erased most of recent increases and reached the 38.2% Fibonacci retracement level once again. If this support level (in combination with Monday’s low) encourages the buyers to act we will likely see a corrective upswing in the following hours. In this case, the upside target will be yesterday’s high. However, if the buyers fail, we will likely see further deterioration and the downside target for the sellers will be the next Fibonacci retracement level.
Very short-term outlook: mixed
Short-term outlook: mixed
MT outlook: bullish
LT outlook: bearish
Trading position (short-term): we do not suggest opening any trading positions at the moment. We will keep you informed should anything change, or should we see a confirmation/invalidation of the above.
USD/CAD
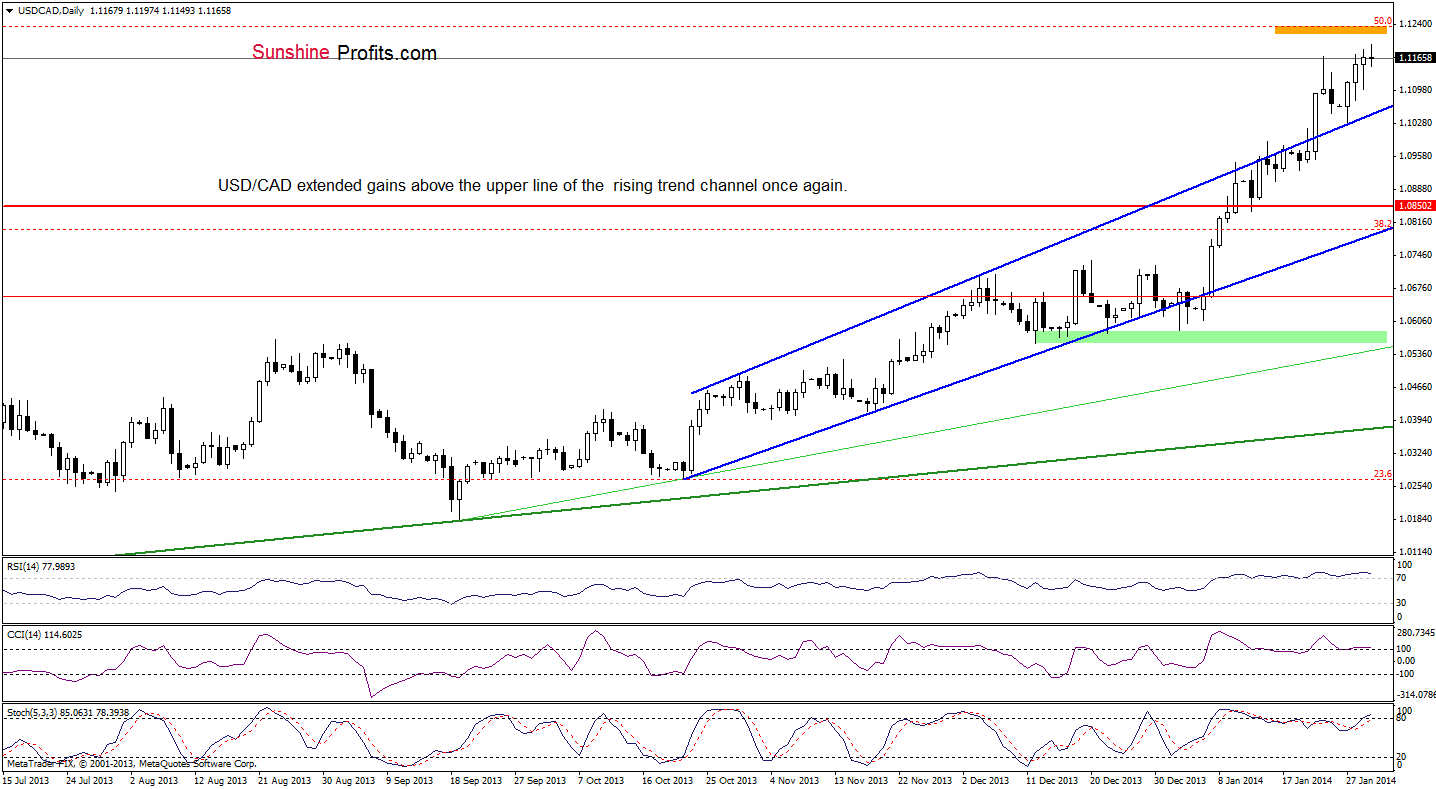
On the above chart, we see that USD/CAD extended gains and hit a fresh four and a half year high earlier today. With this upswing, the pair approached even closer the 50% Fibonacci retracement level (based on entire 2009-2011 decline). From this perspective, the situation remains unclear. On one hand, if this resistance level encourages the sellers to act, we will likely see a pullback. Please note that this assumption is reinforced by the position of the indicators (the RSI and CCI remain overbought and still support the bearish case). On the other hand, looking at the recent price moves, the pair may hit this resistance level and turn back after reaching it.
Very short-term outlook: mixed
Short-term outlook: bullish
MT outlook: bullish
LT outlook: bearish
Trading position (short-term): we do not suggest opening any positions at the moment. We will keep you informed should anything change, or should we see a confirmation/invalidation of the above.
USD/CHF
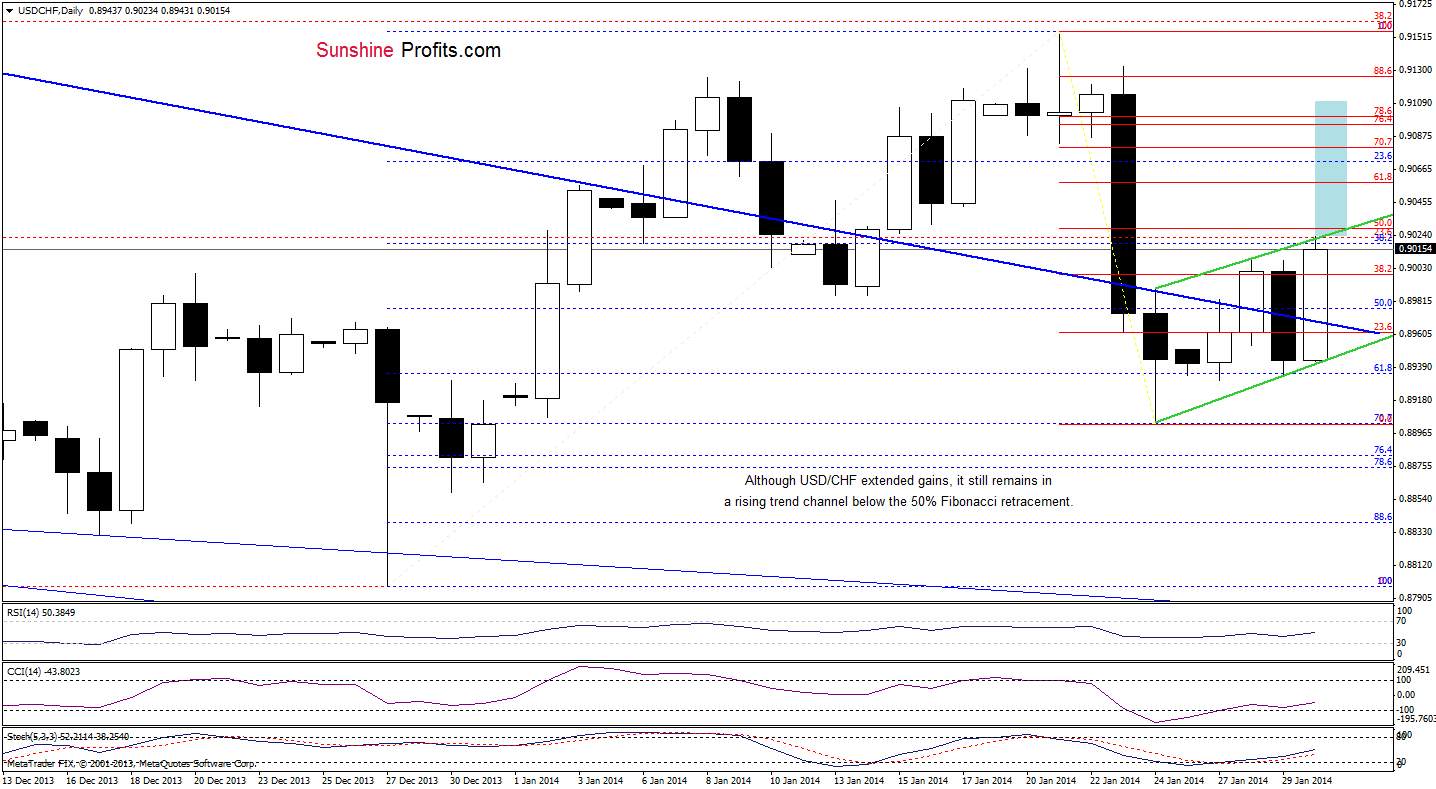
On the above chart, we see that the situation has improved as USD/CHF reversed and broke above the short-term declining support/resistance line (marked with blue) once again. With this upswing, the pair also broke above the 38.2% Fibonacci retracement level and Wednesday’s high, which is a bullish signal. Nevertheless, USD/CHF still remains in a rising trend channel slightly below the next Fibonacci retracement level.
From this perspective, if the pair successfully breaks above the upper line of the trend channel and the 50% retracement, we will likely see further improvement. In this case, the initial upside target will be the 61.8% Fibonacci retracement level (but the final target for this formation is well above this level). This assumption is reinforced by the indicators, which generated buy signals. On the other hand, if the buyers fail, we will likely see a pullback to the short-term declining support/resistance line (or even to the lower border of the trend channel).
Very short-term outlook: mixed
Short-term outlook: bearish
MT outlook: bearish
LT outlook: bearish
Trading position (short-term): we do not suggest opening any trading positions at the moment. We will keep you informed should anything changes, or should we see a confirmation/invalidation of the above.
AUD/USD
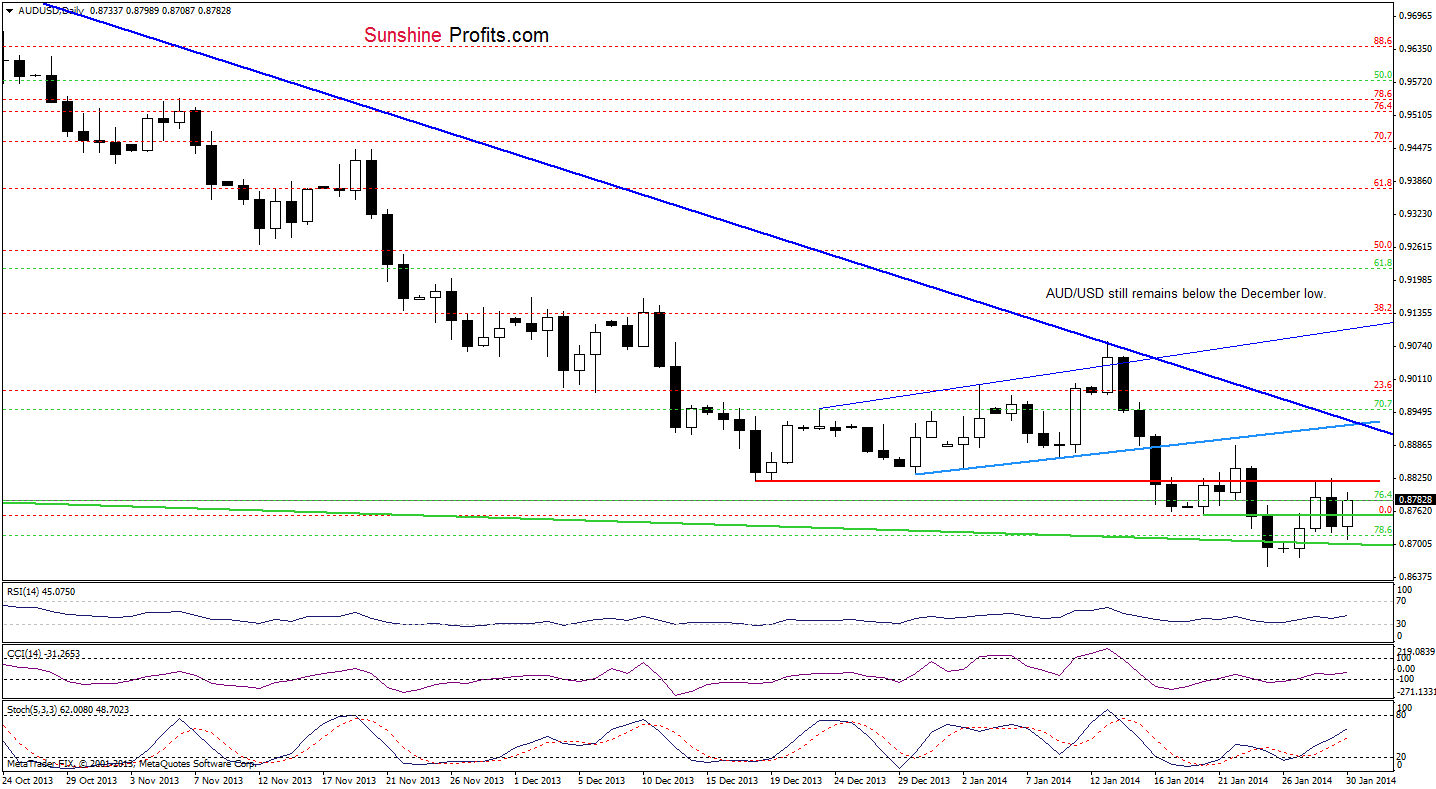
Looking at the above chart, we see that the situation hasn’t changed much as AUD/USD still remains below the resistance zone created by December lows and Wednesday high (as a reminder, as long as the pair remains below this resistance zone, another downswing can’t be rule out). Nevertheless, recent days have formed a consolidation. According to theory, a breakout above yesterday’s high may trigger an upward move and the upside target would be the short-term declining resistance line based on the Oct.23 and Jan.13 highs (marked with dark blue). Please note that even if we see such price action, the first signal of an improvement will be an increase above this resistance line.
Very short-term outlook: mixed with bearish bias
Short-term outlook: bearish
MT outlook: bearish
LT outlook: bearish
Trading position (short-term): we do not suggest opening any positions at the moment. We will keep you informed should anything change, or should we see a confirmation/invalidation of the above.
Thank you.
Nadia Simmons
Forex & Oil Trading Strategist
Forex Trading Alerts
Oil Investment Updates
Oil Trading Alerts

