
Earlier today, the U.S. currency moved sharply lower against European currencies. The euro rebounded sharply after stronger-than-expected data on eurozone private sector activity. The British pound extended gains and climbed to its highest level since Aug. 2011 after a sharper than expected fall in the U.K. unemployment rate. Meanwhile, the Swiss franc improved significantly after the government moved to curb mortgage lending. What impact did these moves have on major currency pairs? What happened with USD/JPY, USD/CAD and AUD/USD at the same time? We invite you to read our today's Forex Trading Alert.
Forex Trading Positions - Summary:
- EUR/USD: short position (stop-loss level: 1.3699)
- GBP/USD: none
- USD/JPY: none
- USD/CAD: none
- USD/CHF: long position (stop-loss level: 0.8985)
- AUD/USD: none
EUR/USD
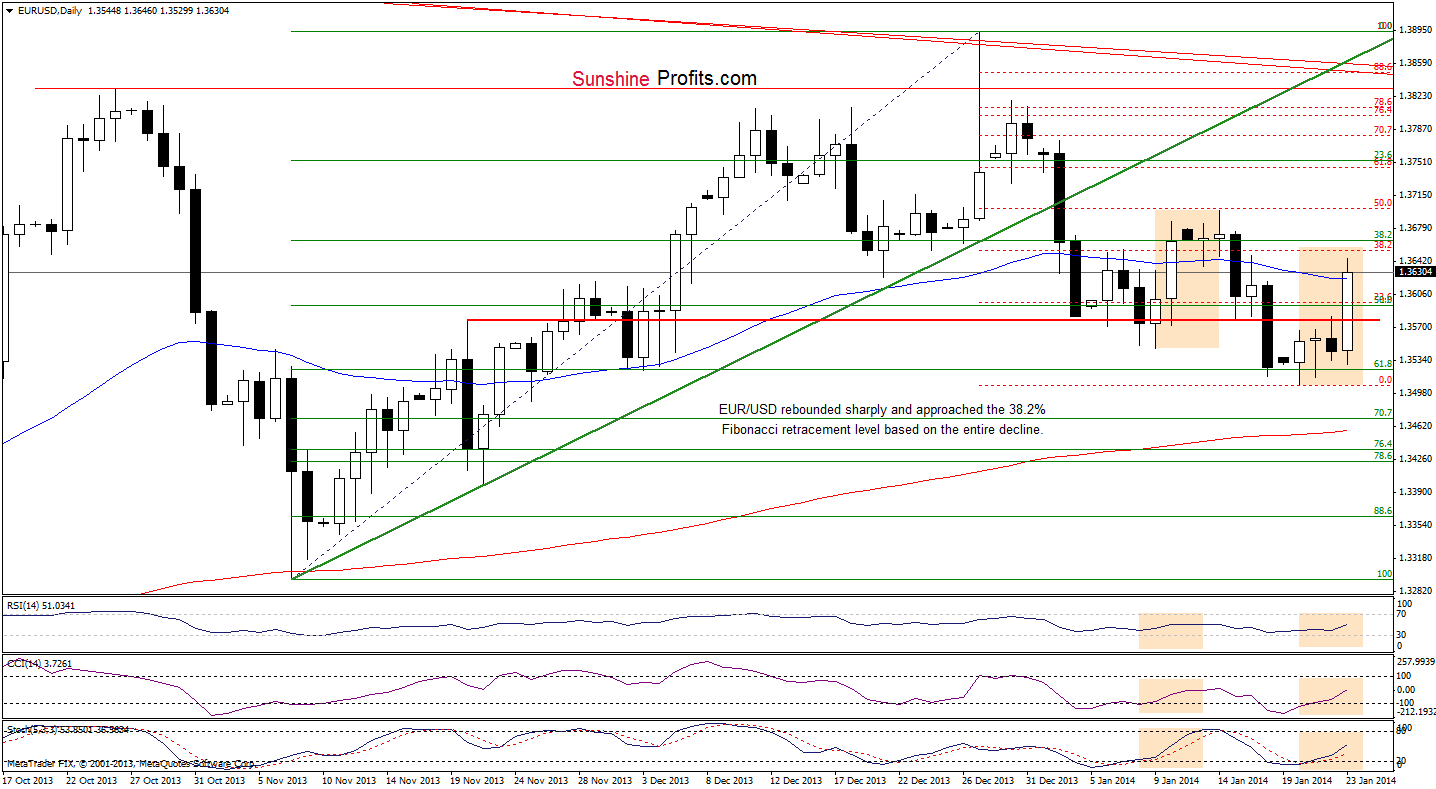
On the above chart, we see that the situation has improved as EUR/USD rebounded sharply and came back above the previously-broken lower border of the consolidation range and the red horizontal support/resistance line. With this upward move, the pair also reached the 38.2% Fibonacci retracement level based on the entire decline. If this resistance level encourage sellers to act, we will likely see a pullback in the following day (or days).
At this point, it’s worth noting that today’s upswing is similar to the previous one (at least at the moment when these words are written). Additionally, the position of the indicators is quite similar to what we saw on Jan. 10. Back then, the pair invalidated the breakout above the 38.2% Fibonacci retracement level, which triggered a downward move. If history repeats itself once again, we will likely see similar price action in the following days.
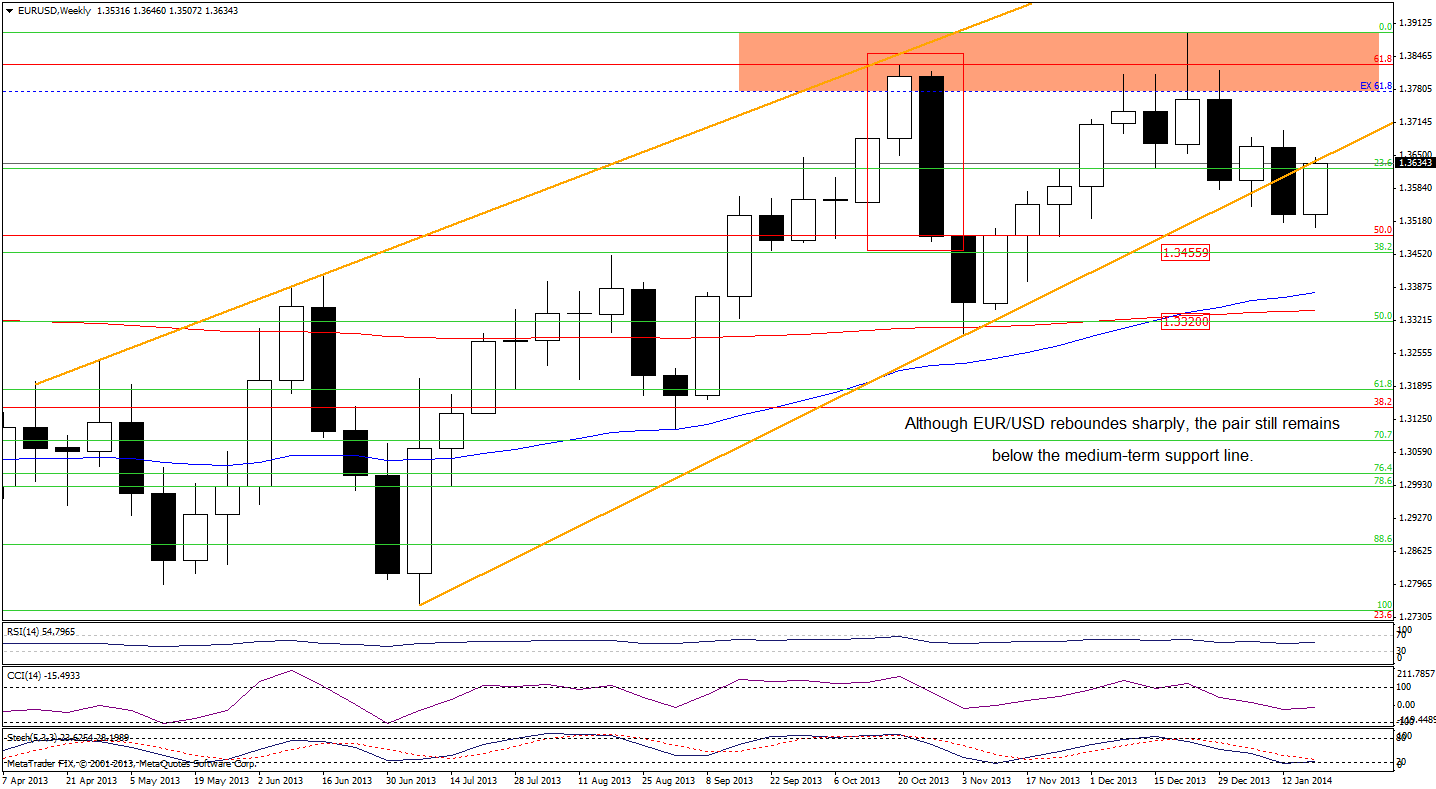
Nevertheless, if the pair closes the day above this resistance level, we will see further improvement and the first upside target will be the 50% Fibonacci retracement level (which corresponds to the Jan. 14 high). In this case, we will also have an invalidation of the breakdown below the medium-term support/resistance line which would be a strong bullish signal.
Very short-term outlook: bullish
Short-term outlook: mixed
MT outlook: mixed with bearish bias
LT outlook: bearish
Trading position (short-term): short. The stop-loss level for this position is at 1.3699. The first downside price target is around 1.3457. We will keep you informed should anything change, or should we see a confirmation/invalidation of the above.
GBP/USD
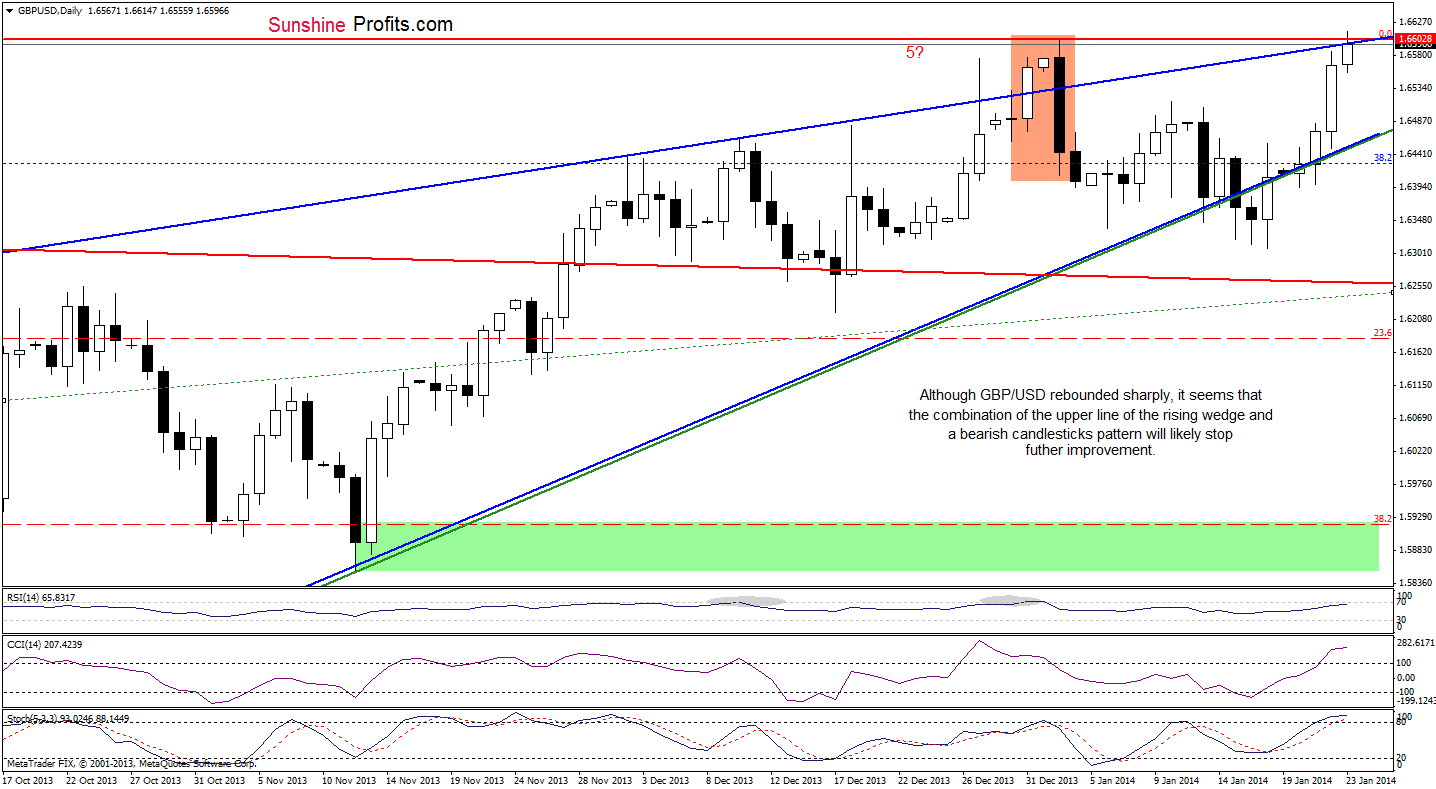
Looking at the above chart, we see that GBP/USD extended gains and hit a fresh January high. With this upward move, the pair reached the upper border of the rising wedge (marked in blue). Although we saw a small breakout above this line (and also above the previous high), it is not confirmed at the moment and it seems that this strong resistance level will encourage sellers to act – especially when we take into account the fact that the bearish candlesticks pattern (marked with the orange rectangle) hasn’t been invalidated so far. From this perspective, it seems that the space for further growth is limited.
Very short-term outlook: bullish
Short-term outlook: mixed
MT outlook: mixed
LT outlook: mixed
Trading position (short-term): we do not suggest opening any trading positions at the moment. We will keep you informed should anything change, or should we see a confirmation/invalidation of the above.
USD/JPY
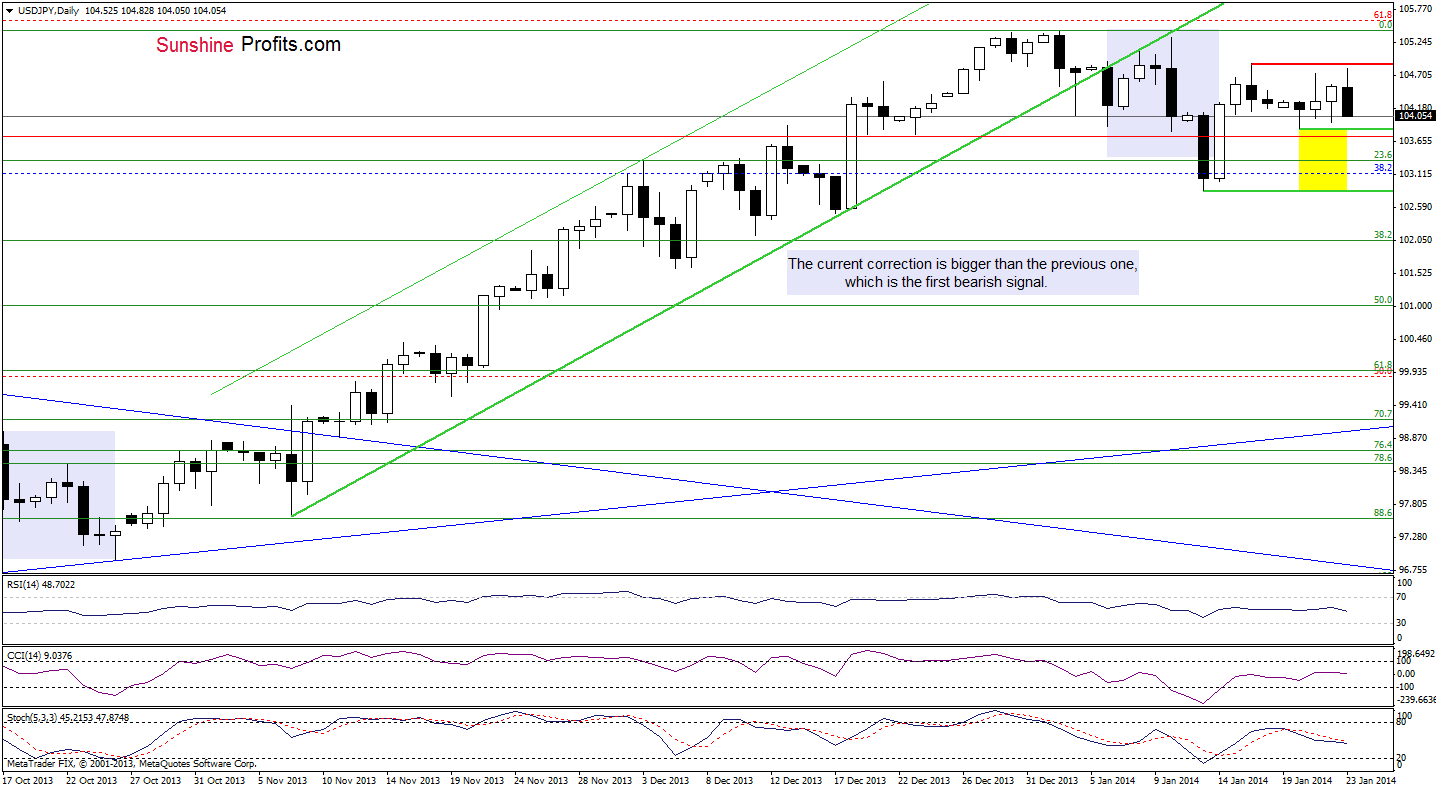
On the above chart, we see that the situation hasn’t changed much and what we wrote in our last Forex Trading Alert remains up-to-date.
(…) recent days had formed a consolidation on the chart (…) USD/JPY (…) climbed to slightly below Thursday’s high at 104.91. If this resistance level is broken, we will likely see another upswing to around the Jan. 10 high (or even to the annual peak). At this point, it’s worth noting that these levels are slightly below the 61.8% Fibonacci retracement level, which supports the sellers and successfully stopped further gains at the beginning of the year.
On the other hand, if the pair drops below yesterday’s low, we will likely see further declines and the first downside target will be the January low at 102.84. Please note that the sell signal generated by the Stochastic Oscillator remains in place supporting sellers.
Very short-term outlook: mixed with bearish bias
Short-term outlook: mixed
MT outlook: bullish
LT outlook: bearish
Trading position (short-term): we do not suggest opening any trading positions at the moment. We will keep you informed should anything change, or should we see a confirmation/invalidation of the above.
USD/CAD
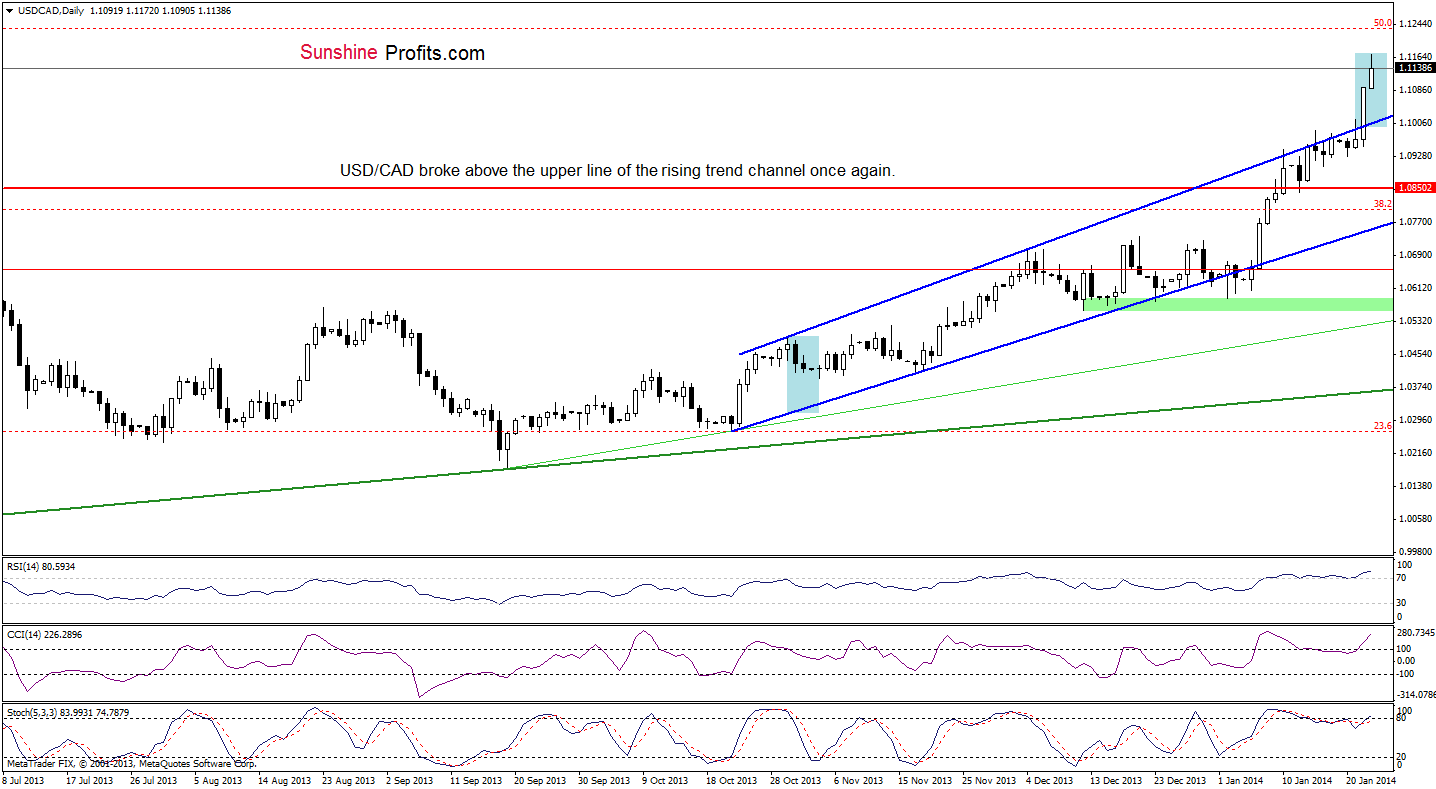
As you see on the above chart, USD/CAD closed the day above the upper line of the rising trend channel and extended gains earlier today. With this upswing, the pair reached its upside target (marked with the blue rectangle) and approached the 50% Fibonacci retracement level. From this perspective, the space for further increases seems limited. Additionally, there are strong negative divergences between the CCI, Stochastic Oscillator and the exchange rate, which is a bearish signal. On top of that, the RSI is still overbought (well above the level of 70), which suggests that a pause or a correction is just around the corner.
Very short-term outlook: mixed
Short-term outlook: bullish
MT outlook: bullish
LT outlook: bearish
Trading position (short-term): we do not suggest opening any positions at the moment. We will keep you informed should anything change, or should we see a confirmation/invalidation of the above.
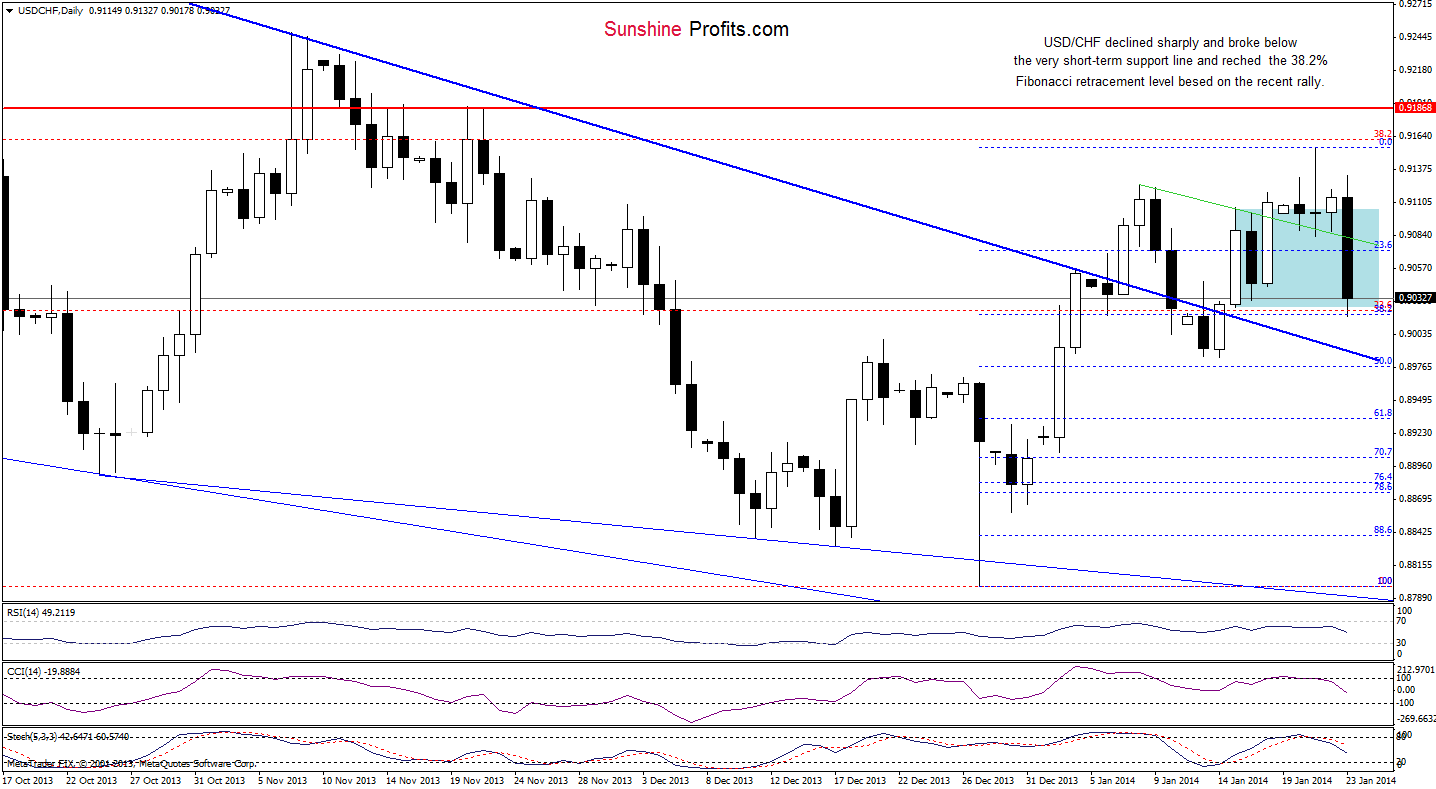
USD/CHF
In our last Forex Trading Alert we wrote:
(…) the pair came back to the consolidation range, which is not a positive signal – especially when we factor in the position of the indicators. Please keep in mind that the CCI and Stochastic Oscillator are overbought (the letter generated a sell signal), while the RSI remains slightly below the level of 70, which suggests that a pause or even a correction is just around the corner.
As you see on the above chart, the situation has deteriorated as USD/CHF broke below the very short-term support line. With this corrective move, the pair reached a support zone created by the lower border of the consolidation range and the 38.2% Fibonacci retracement level based on the entire recent rally. If this support zone encourages buyers to act, we will likely see an upward corrective move to the previously-broken very short-term support line which serves as resistance at the moment. However, if it is broken, we will see further deterioration and the next downside target will be the short-term declining support line (marked in blue) which successfully stopped sellers earlier this month (currently around 0.8989).
Very short-term outlook: mixed with bullish bias
Short-term outlook: mixed
MT outlook: bearish
LT outlook: bearish
Trading position (short-term): long. The stop-loss level for this position is at 0.8985. The upside price target is around 0.9160. This position is already quite profitable. We will keep you informed should anything change, or should we see a confirmation/invalidation of the above.
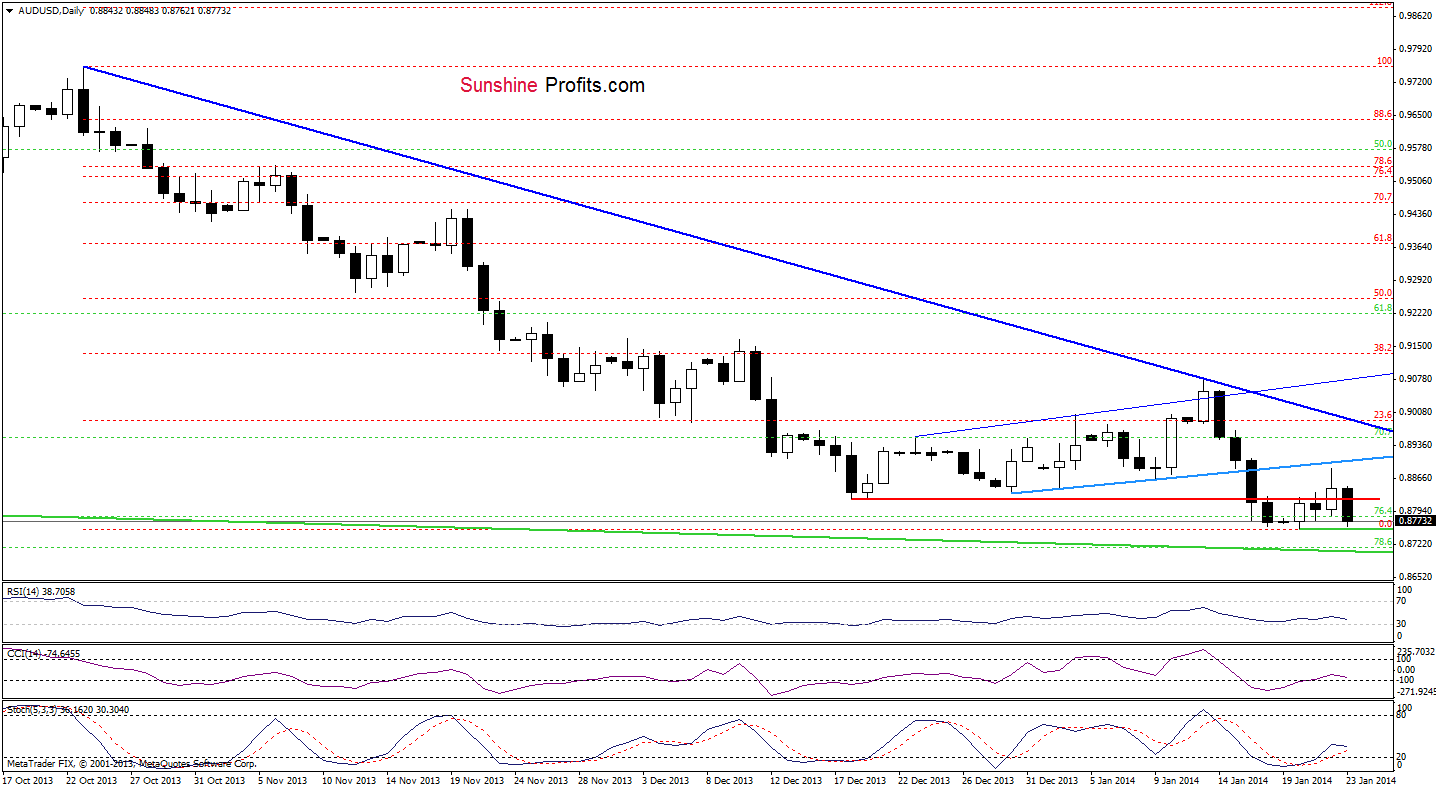
AUD/USD
Quoting our last Forex Trading Alert:
(…) the pair still remains below the previously-broken very short-term support line. If this resistance line encourages the sellers, we will likely see a pullback in the following days. In this case, the first downside target will be the January low at 0.8755.
On the above chart, we see that although AUD/USD rebounded yesterday, this improvement was only temporary. Earlier today, the situation has deteriorated as the pair declined below the December low once again. From this perspective, it seems that yesterday’s increase was a verification of the breakdown below the very short-term support line. If this is the case, we will likely see further deterioration and a drop below the January low. If the sellers actually break below this support level, the next downside price target will be the 78.6% Fibonacci retracement, which corresponds to the lower border of the declining trend channel.
Very short-term outlook: mixed with bearish bias
Short-term outlook: bearish
MT outlook: bearish
LT outlook: bearish
Trading position (short-term): we do not suggest opening any positions at the moment. The space for further declines is limited by the strong support zone created by the 78.6% Fibonacci retracement and the lower border of the declining trend channel, while the space for further increases is limited by the previously broken short-term declining resistance line. We will keep you informed should anything change, or should we see a confirmation/invalidation of the above.
Letters to the Editor
Dear Sunshine profits.
I'm reading the Forex alerts with some interest but I have to admit to being confused in knowing what actions to take. I do not know what currency to buy either Euro or USD from the advice below here is an extract:
"Looking at the current situation on the above charts, it seems that a bigger downward move is just around the corner. If the pair drops lower and breaks below the above-mentioned medium-term rising support line (an additional confirmation of the bearish scenario would be a breakdown below the previous week’s low), we will likely see further deterioration and suggest opening short positions"
The questions are:
A bigger downward move - in what specifically?
In most cases, such as bigger downward/upward move is closely connected with technical analysis and formations seen on the charts. For example, in the case of a head and shoulders pattern, we can predict the range of a decline after a breakdown below the neck level of the formation (you can read more here). In the case of EUR/USD, the pair broke below the medium-term rising support line, which is also the lower border of the rising trend channel. According to theory, such drop could trigger a bigger downward move compared with previous corrective moves.
If the "pair" drops lower Q: what is the definition of "pair"? When you say currency pair of Euro /USD but what does that word "pair" actually mean precisely does it mean ration of value between the Euro against the USD ?
A currency pair is a set of two currencies that are quoted against each other. In a currency pair, the first currency is called the "base currency", and the second one is called the "quote currency". The currency pair shows how much of the quote currency is needed to purchase one unit of the base currency. In other words, the first currency is the commodity and the second currency is the money. In EUR/USD, the euro is the commodity and the dollar is the money. When you buy EUR/USD, you pay dollars to buy euros. For example, if the quote is EUR/USD 1.3558, this means that one euro is worth 1.3558 US dollars.
An additional confirmation of "bearish scenario" Q: Bearish as to what?
The situation on the market can be described as bullish or bearish (these terms are also used to describe the approach of an investor). When the trend is up and the assets appreciate, such a market is described as bullish or a bull market. When the trend is in the opposite direction and prices drop, it is a bear market. Investors who bet on growth are called "bulls", while those who bet on declines are called "bears". Taking the above into account, we can say that the scenario which assumes an increase in stocks/commodities (or the exchange rate in the Forex market) is bullish, while the scenario which assumes a decrease is bearish.
What we need to know is what to buy USD or Euros. From the advice I do not know what currency you are referring to when you say "bearish"
Here's a rule of thumb that should make our analyses easier to read before it all becomes natural for you. Here it is: think about the first of the currencies that are mentioned. Is EUR/USD going higher? Then the euro is going higher (against what? of course against the USD as it's the only other thing that's mentioned). The USD/JPY is going lower then what does it mean? That the USD is going lower… against the yen, which means that the yen is going higher against the USD. Thinking about this will become natural very soon, but until it does, the above rule should make understanding what we write a lot easier.
Here's a more detailed explanation:
In the Forex market, you trade currency pairs rather than individual currencies. Nevertheless, when you read something like that: "if EUR/USD drops lower, we will likely see further deterioration" it means that that the U.S. dollar will strengthen against the euro and it can be cost-effective to sell the euro and buy the dollar, because its value will grow.
Further deterioration in which currency compared to another.?
Writing about further deterioration in a given currency pair, we mean a decline in the value of the base currency against the value of the quote currency. For example, further deterioration in EUR/USD means that the euro will drop against the U.S. dollar. In other words, you will need less U.S. dollars to buy one euro.
Another thing I find confusing is that the Currency Pairs are not consistent between different currencies e.g.
Euro/USD but USD / JPY ? why is it the ratio different for JPY which is it not JPY/USD so that it is consistent?
In short, it's a matter of what became the standard way of referring to these pairs. It's just what most people are already used to, so that's why we're using it in this way as well.
Here's a more detailed reply:
There are two types of currency pairs: direct and indirect. In the first case, the base currency is the domestic currency, while the quote currency is the foreign currency. In an indirect quote we have the opposite, which means that the foreign currency is the base currency and the domestic currency is the quote currency. It means that the way in which currency pairs are quoted depends on the country in which traders live and most countries use direct quotes. At this point it's worth noting that EUR/USD is always quoted indirectly. In an answer to your question, a USD/JPY quote could be shown as JPY/USD by making a simple calculation, but for an American trader the first quote is more natural/more obvious because the U.S. dollar is the base currency. Please keep in mind that there are no strict rules that determine whether a currency pair is shown directly or indirectly, but in the case of major currency pairs (EUR/USD, GBP/USD, USD/JPY, USD/CAD, USD/CHF, AUD/USD) such quotes are more common.
If you could explain your terminology it would go a long way to better understand your analysis. I also would highly recommend that you add a few more qualifying words in your descriptions so it is absolutely clear what you mean e.g. there will be a deterioration in the value of the USD against the Euro in the next x weeks or months by this amount. Rather than saying there is a deterioration in the pair. That is not at all clear.
I hope you find this feedback of some value.
Thank you.
Nadia Simmons
Forex & Oil Trading Strategist
Forex Trading Alerts
Oil Investment Updates
Oil Trading Alerts

