

All eyes are on the euro. Will it march higher or will the dollar king reign supreme? We have done our homework and have the odds on our side. It’s time to share and put it to good use for you. Let’s jump right in.
- EUR/USD: short (a stop-loss order at 1.1410; the initial downside target at 1.1258)
- GBP/USD: none
- USD/JPY: none
- USD/CAD: none
- USD/CHF: none
- AUD/USD: half of short positions (a stop-loss at 0.7228; the exit target at 0.7042)
EUR/USD
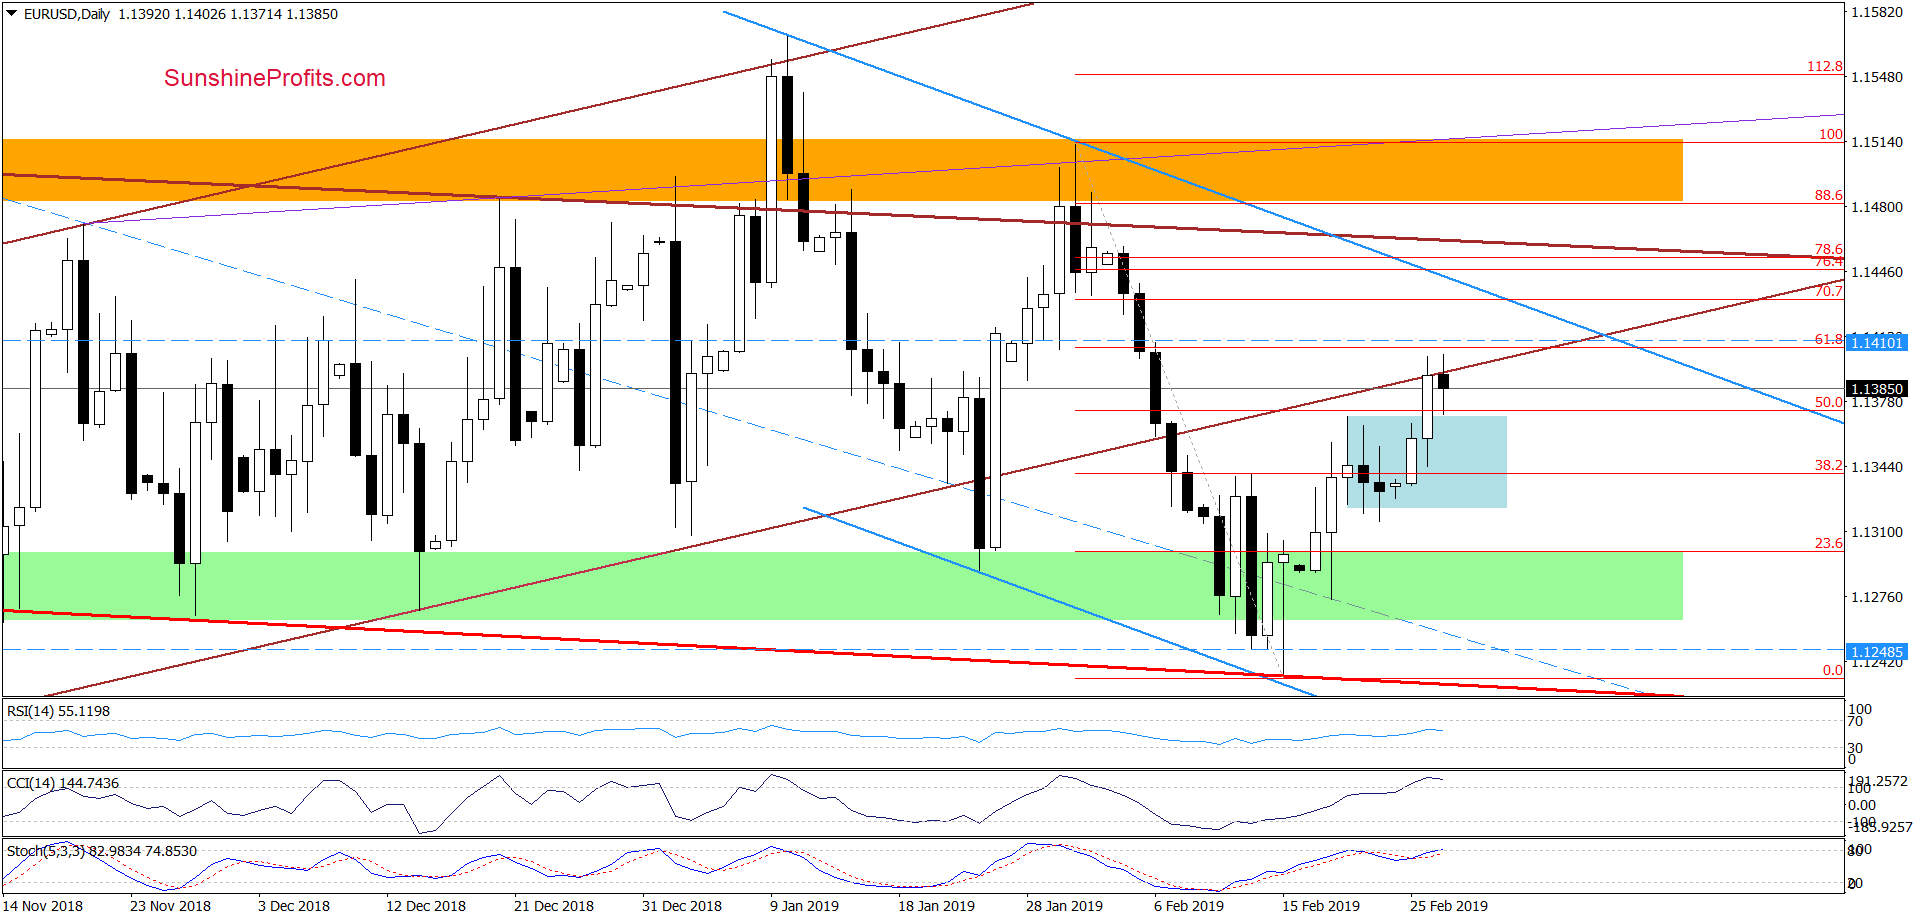
Yesterday, currency bulls pushed EUR/USD above the upper border of the blue consolidation. The price went on to test the previously broken lower border of the brown rising trend channel.
Despite the tiny breakout above this resistance, the buyers didn’t manage to hold on to their gains. The price pulled back and closed the day below this resistance. Earlier today, we saw a similar attempt to move higher that fizzled out yet again. The market looks to be getting ready for another downswing.
Our last commentary remains up-to-date:
(…) we’ll likely see another move to the downside and a retest of the major supports (the lower border of the red declining trend channel and the long-term red support line based on the October 2017 and August 2018 lows) and recent lows around 1.1250 in the following days.
Trading position (short-term; our opinion): Short positions with a stop-loss order at 1.1410 and the initial downside target at 1.1258 are justified from the risk/reward perspective.
USD/CHF
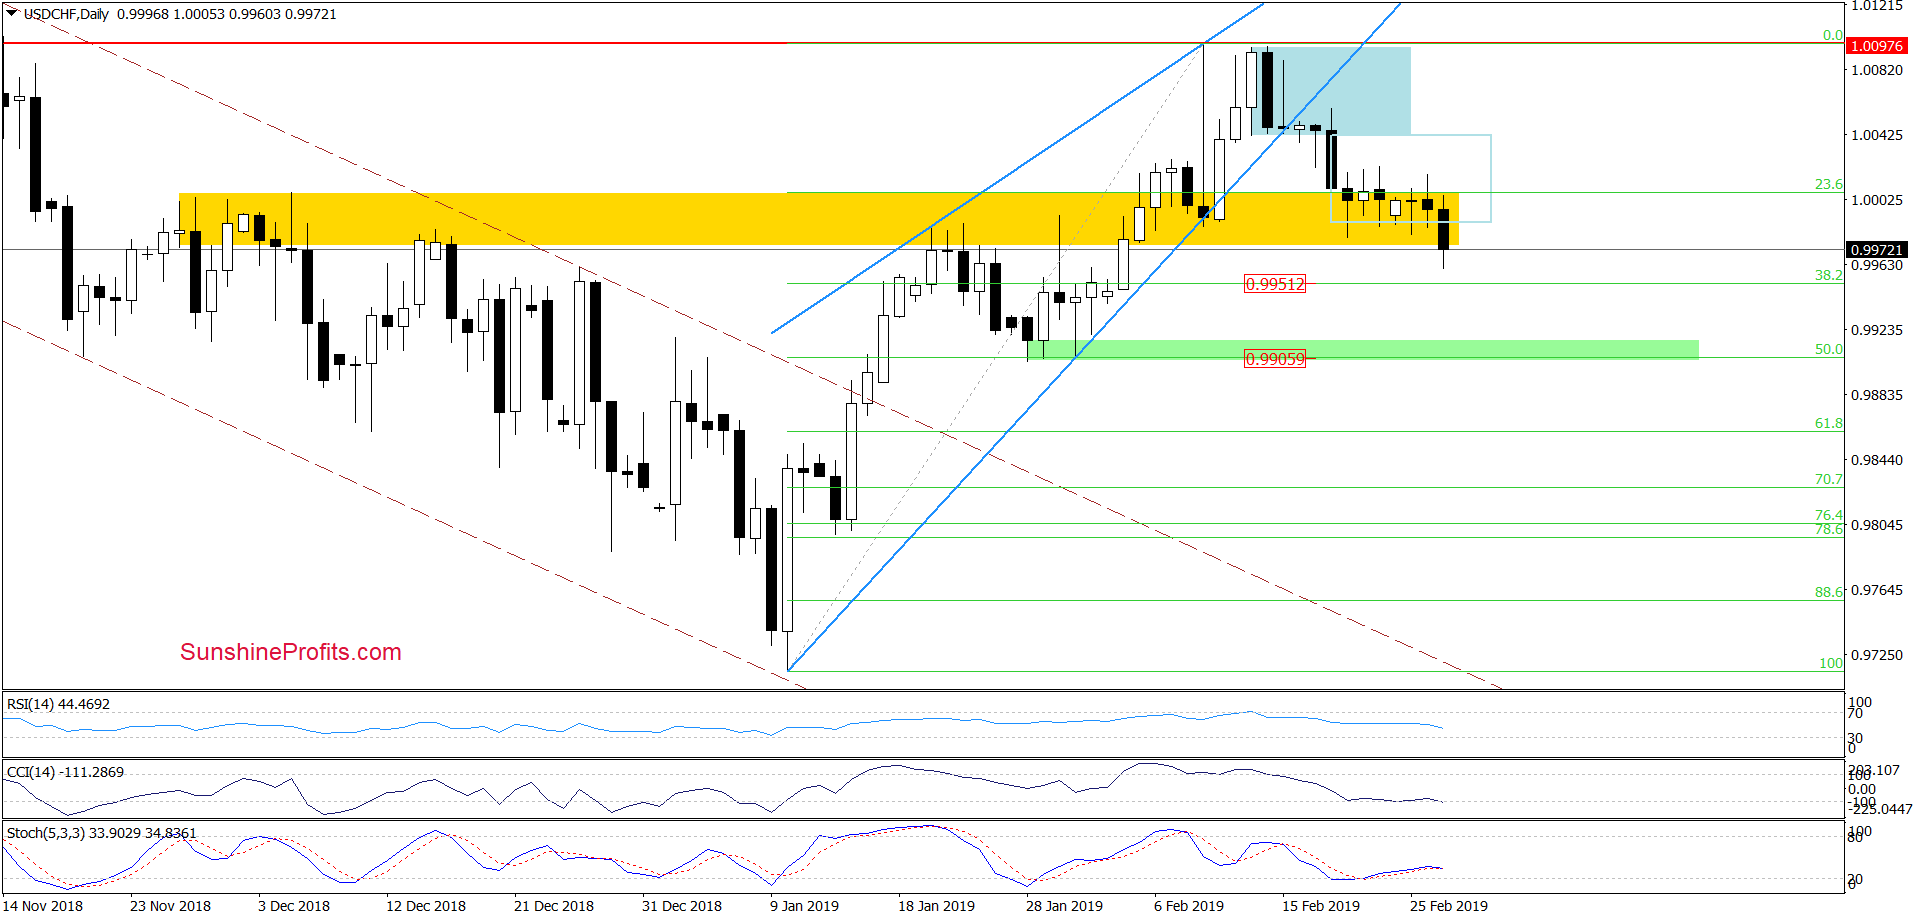
Earlier today, USD/CHF moved lower and broke down below last week’s lows. Such price action supports our Monday’s observations:
(…) considering the current position of the daily indicators (there are no buy signals) it seems that sellers can still try to push the exchange rate lower.
If they succeed, USD/CHF will likely test the 38.2% Fibonacci retracement based on the entire January-February upward move in the coming week.
Trading position (short-term; our opinion): No positions are justified from the risk/reward perspective. We will keep you informed should anything change, or should we see a confirmation/invalidation of the above.
AUD/USD
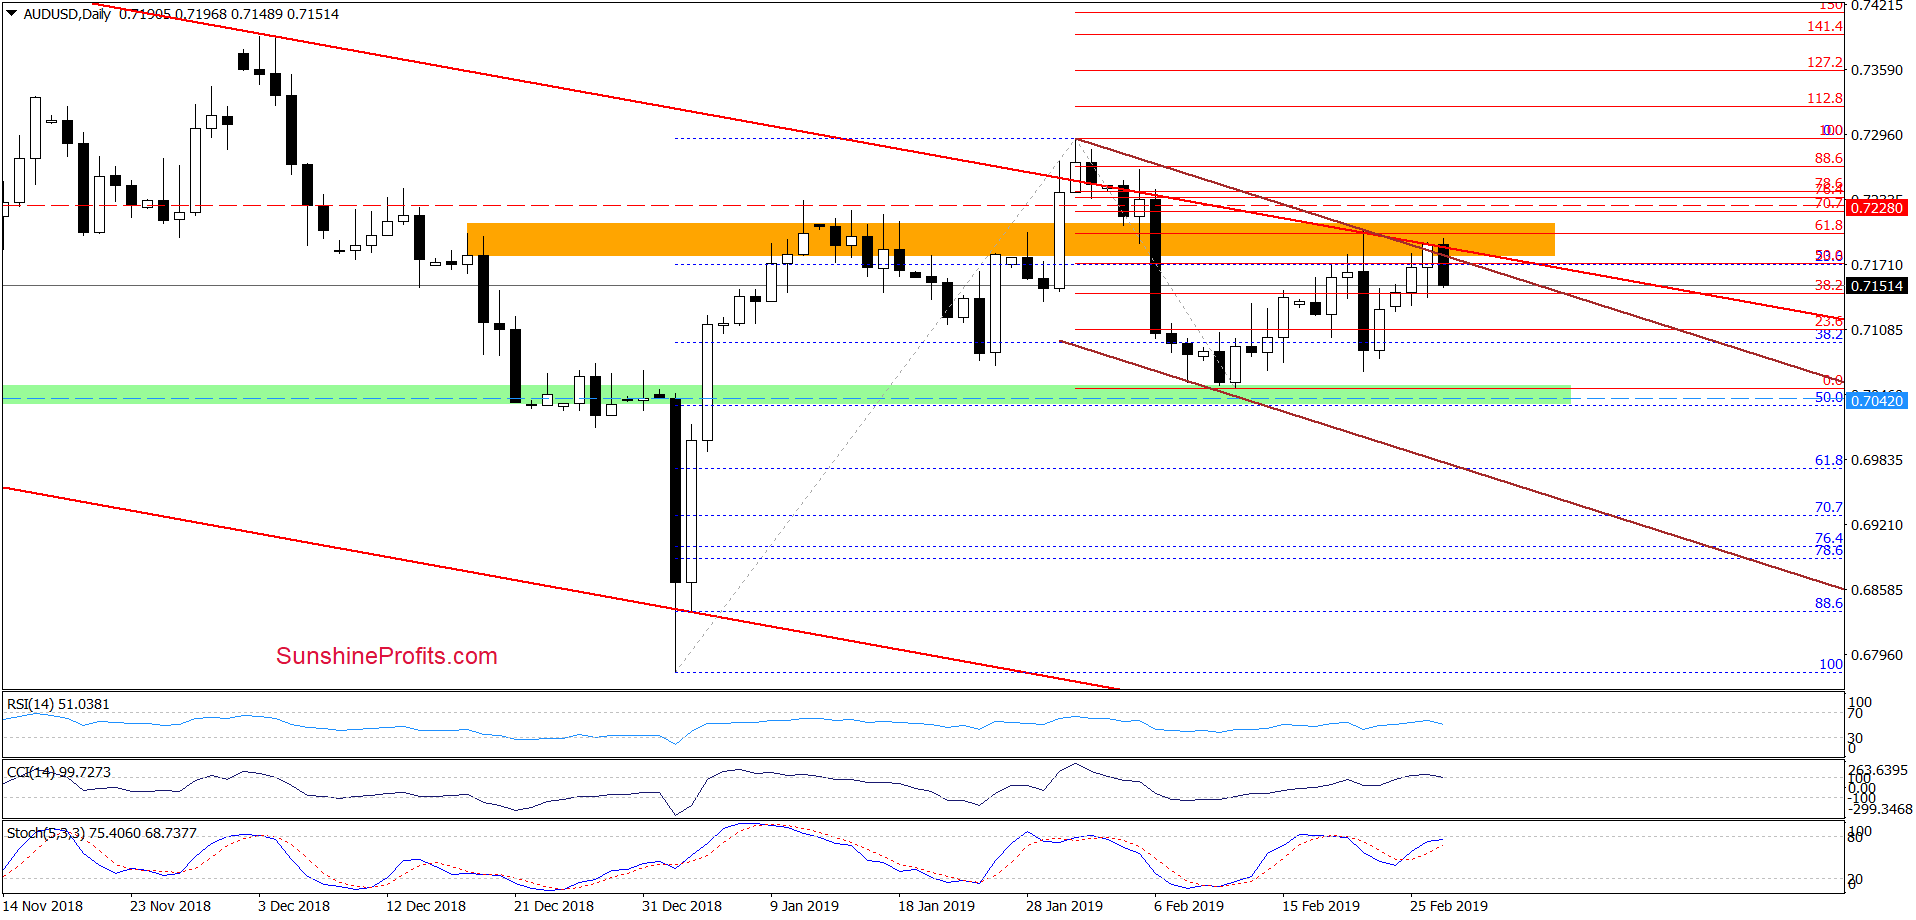
On the daily chart, we see that the orange resistance zone stopped the buyers once again, triggering a pullback. Again, what we wrote on Monday remains up-to-date:
(…) AUD/USD extended gains and came back to the major orange resistance area that is further supported by the 61.8% Fibonacci retracement based on the entire February decline, the upper border of the long-term red declining trend channel and the upper line of the short-term brown declining trend channel.
The combination of these resistances was strong enough to stop the buyers and trigger a sharp downswing in the previous week. It suggests that history can repeat itself once again in the very near future.
The history indeed rhymed and AUD/USD turned south. It remains likely to retest the green support zone or even slip to/below our exit downside target in the following day(s).
Trading position (short-term; our opinion): Half of profitable short positions (with a stop-loss order at our entry level at 0.7228 and the exit target at 0.7042) are justified from the risk/reward perspective.
Thank you.
Nadia Simmons
Forex & Oil Trading Strategist

