
tools spotlight
Details and Performance
SP Indicators' Performance
As a precious metals investor, you’re most interested in how the market works. Knowing what drives the prices of metals is one of the most important parts of it. If you know the main drivers, then you know what you should constantly keep track of. But not only that. Knowing market specifics can help get ahead other market participants.
There is, probably, no simpler way to present market particularities than on charts. Sifting through thousands of bits and pieces of information can be disorientating. If the information is gathered in one chart, it might just start to make sense. This is what we do – we try to find patterns in what’s going on in the market. Then we put it on charts so that you can easily see what we've found out. This section is the place, where we put our observations of this particular market into a graphical form. We call that form “indicators,” since these charts indicate where the market's at.
Each market has its own unique properties, and since we are mainly precious-metals-oriented, we are able to spot divergences, clues and signs that many 'general analysts' simply overlook. Naturally, there is no crystal ball and none of the indicators presented below will be right each and every time, but they should prove a very useful tool, when making your transactions. Each of our indicators is based on a specific phenomenon that we were able to put into a form of an indicator.
We will tell you about one of the mechanisms that are used in one of the indicators, so that you know more or less how we construct them. Not every detail will be given, so that the formula itself remains unknown. If everyone knew how it works, it would be used widely and in the end it would stop working at all. Our subscribers and we would certainly not want that to happen.
Find out how we created one of our Indicators. Click to expand/shrink
The mechanism that we profit on in this indicator is how the institutional investors often act. First of all, institutional investors own a large share of a particular company's shares. It is obvious that they purchase shares that they like, and they don't purchase stocks that they don't like. Institutional investors, contrary to most individual investors, usually have research teams behind them and they must take their opinions into account. These 'teams' or individuals making quantitative valuation of companies would surely (very high probability) take into account several of statistics that we also use while evaluating companies. This implies that companies that top our rankings in terms of particular statistics (R-square for instance) are most likely also the companies most often chosen by institutional investors. So - we can calculate the average performance of several 'institutional' precious metals stocks.
All of the above would be useless if we did not know (expected) something else about how institutional investors react to various market situations. These investors are generally professionals and on average act less emotionally. The key word here is average. On the other hand, institutions usually have loss limits that they need to obey, and also their performance is being compared to other institutions. This means that if they suffer losses, it is not that bad for them, as long as their competitors (benchmark) also suffer these losses. This puts a great pressure on people in charge of the investment institutions to act like their colleagues. If they did the opposite and were correct, they would outperform for a while and perhaps get a bonus at the end of the year. On the other hand, if they are not correct, they may even lose their jobs or worse. Even if the chances are 50/50, the result of being wrong is much more painful, than what they could win, if they were correct. In other words - the expected value of the decision of acting against their colleagues is negative. This makes big money act together, when they finally do begin to sell or buy. These investors are professionals, so they control their emotions most of the time. Most of the time, but not always. If not always, then when? Under the most difficult conditions, which are exactly at the top or at the bottom of the market!
It is no secret that big money sells and buys ahead of the masses, but not everyone realizes how dynamic the process becomes when emotions are mixed with the institutional domino effect. Summing up, institutional investors are rather unemotional most of the time, but at critical times, they act very specifically. They act as if they were very emotional for a very limited period of time.
If the above-mentioned assumptions are mostly true, then the ratio between 'top' PM stocks and the rest should behave specifically around bottoms and tops. Having investigated this matter, we found that it does indeed take place, but it is more likely to signal a short term weakness, than strength. All that is left to do is to choose the stocks, build a ratio and check its specifics and dynamics. After that, we check at which levels it is most profitable to enter trades and what the average effect will be. Once the testing process is complete we have another indicator for our Subscribers.
Each of our Indicators is built in a different way and therefore each must have different performance. Since a picture is worth a thousand words, we have prepared charts for you, which, we hope, will help you understand how you can make more money using our Indicators.
SP Gold Bottom Indicator
Just before we introduce you to our charts, we have to describe one method we use in them. These are confidence intervals which, in simple words and for the precious metals market, are a way of defining the range in which returns usually fluctuate. This will be best described with an example on a chart. For now, disregard any other information from the chart below and just think of the red line as average returns.
So, you see average returns as a red line. The green lines show you the range build using confidence intervals. If the red line shows you what happened on average, green lines show you a range in which the prices fluctuated most of the time. The returns didn't go beyond the upper green line, nor did they go below the lower green line most of the time.
Now, there's just one more thing you need to know about confidence intervals, but an important one. If the green lines on the chart above are relatively close to the red line, it means that on most occasions the returns were relatively close to the average. So, the average may be a considerably accurate measure of what the returns used to be in the past. Conversely, if the green lines are relatively far away from the red line, this means that the returns usually were not close to the average, and the average is not a very accurate measure of what happened in the past.
For those of you more interested in the math behind this method: We specify the confidence intervals so that the statistical probability that the returns are between the two green lines equals 90%. You need to remember that this probability is subject to strong assumptions which may not always be met. If you’re not comfortable with math, assumptions, and statistical distributions, don’t worry – the intuition behind confidence intervals is not affected – they show the range in which the returns usually fluctuated.
Having described the confidence intervals as such, we can now introduce our Indicators and explain how we measure their performance. Please, take a look at the above chart once more. The horizontal axis represents the days after a signal generated by the indicator and the vertical axis represents returns on a metal or index. Looking at this chart immediately tells you what were the average returns after a signal from the indicator between 1 and 100 days after such signal occurred. Additionally, confidence intervals show you if this averages were particularly reliable (narrow confidence intervals) or only partially reliable (broad confidence intervals).
As a side note, the returns are calculated based on the assumption that a transaction is entered during the next day after the signal is given, which assumption we find realistic.
In the specific case of the chart above, we are considering the SP Gold Bottom Indicator for gold. The aim of this indicator is to detect bottoms in gold and to flash buy signals. It is visible in the chart that, in fact, the returns after signals were positive, which is indicated by the red line above 0 and positively sloped.
After charts with average performance of a given part of the precious metals sector after a given signal was seen, we will also provide charts with the corresponding profit path. By profit path we mean showing what would happen to trader's profits if they followed signals of a particular indicator on a particular market since the beginning of 2008. In each case we assume that the trade was conducted exactly as suggested - meaning that if the suggestions was to enter a 3-week long trade, we entered a trade and closed in after 3 weeks regardless of whether the position was profitable or not. That is unless a stop-loss order was triggered.
Each indicator / market has its own optimal stop-loss level, which you will find on the performance chart. For instance, a 3% stop-loss order means that if you buy at 500 (on the day following the signal), then you set the stop-loss order at 485, which is 3% below the entry price.
Please note that 50% stop-loss order effectively means no stop-loss at all. This may seem odd, however please note that each indicator suggests precisely several-week long trades. If this trade does not bring you profits, you close it anyway. This means that in all cases indicators have built-in stop-loss orders that are based on time.
You will see the profit path for each of the indicators / assets (along with the suggested stop-loss level) below each chart. Please note that charts will be provided only in case when a trade is really suggested - for instance there will be no profit path chart for gold and silver in case of the SP Short Term Gold Stock Bottom Indicator, because we believe that this indicator flashes reliable buy signals only for mining stocks.
Here's the profit path chart for the SP Gold Bottom Indicator:
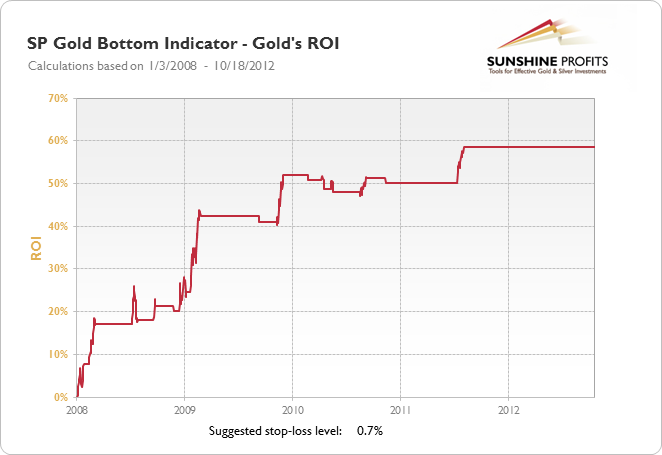
The same SP Gold Bottom Indicator has been applied to silver and the HUI Index. Performance results are displayed in the charts below.
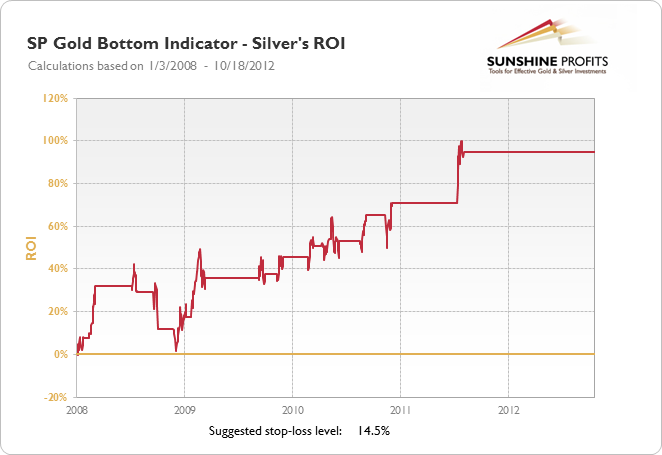
The results for silver confirm the favorable performance of the indicator in case of silver. In case of mining stocks, the average short-term performance doesn't provide any meaningful indications, and the long-term is not that clear either – although generally bullish.
Summing up, the SP Gold Bottom Indicator is useful in generating buy signals for gold and silver, but not for mining stocks.
Default trading suggestion after signal: go long gold and silver with a 3-week long trade in mind.
Long-Term SP Gold Bottom Indicator
Our second indicator, the Long-Term SP Gold Bottom Indicator works based on the same principle as described before, but focuses on major long-term bottoms. Its performance results for gold, silver and the HUI Index are shown on the charts below. You can see the signals on the .
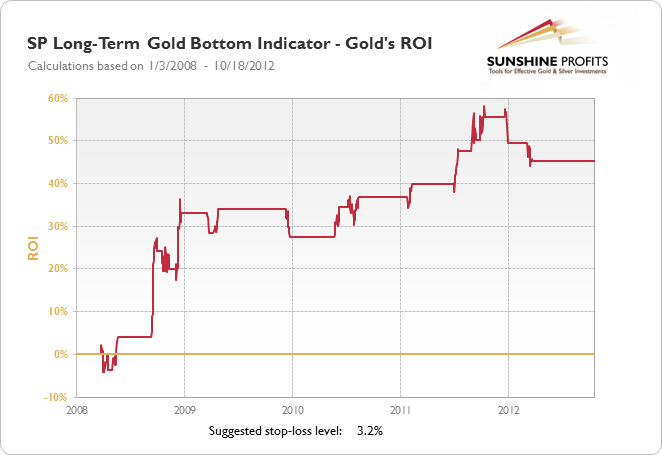
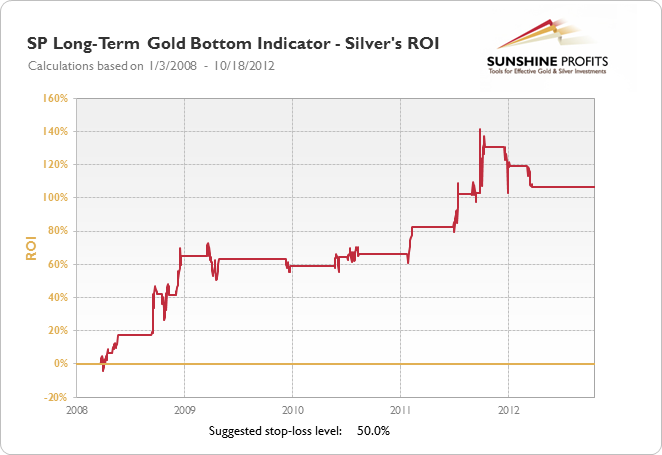
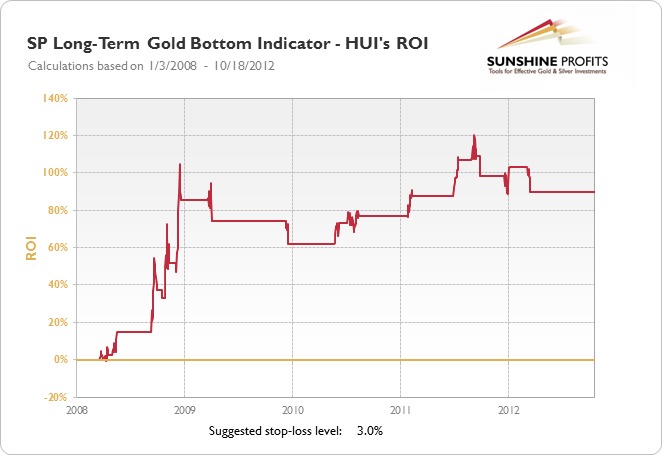
The indicator seems to have performed considerably well for longer time horizons for all of the assets. It’s interesting to note that signals were usually followed by an immediate rally in the whole precious metals sector that was in place for approximately 2 weeks (10 trading days) and was then followed by a 3-week long correction. Consequently, it seems to be a good idea to bet on a short-term rally after this signal is seen or use its buy signals as favorable moments to enter long-term positions.
Summing up, the Long-Term SP Gold Bottom Indicator may be useful in generating short-term buy signals for gold, silver and mining stocks and medium-term buy signals for gold and silver.
Default trading suggestion after signal: go long mining stocks, gold and silver with a 2-week long trade in mind.
SP Gold Stock Bottom Indicator
The next indicator, the SP Gold Stock Bottom Indicator generates buy signals. Its performance can be analyzed from the charts below.
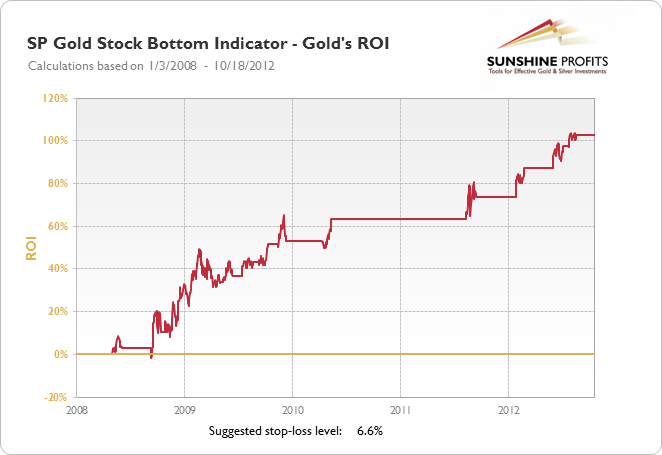
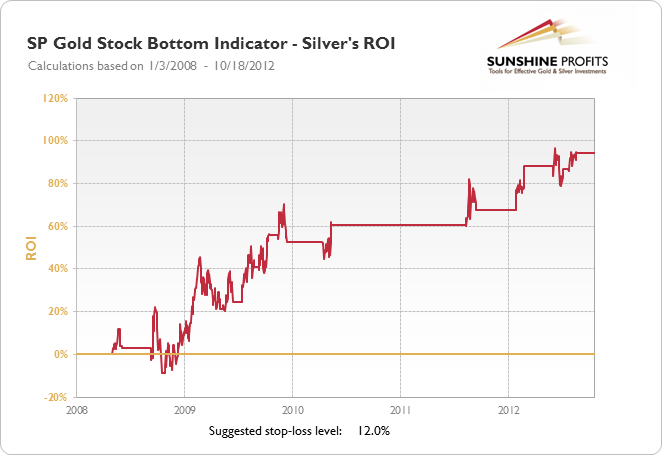
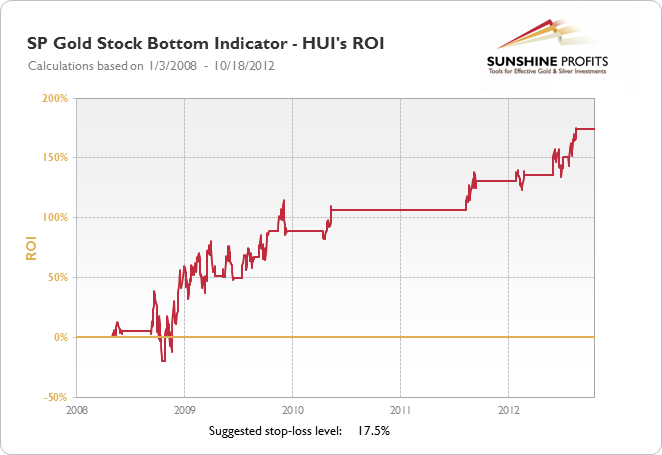
Once again, returns after buy signals were positive and confidence intervals also suggest positive returns as the most frequent ones. All the charts display a peculiarity – the buy signal is followed by a 4-week rally which is, in turn, followed by a 1-2 week long corrective phase. This suggests that signals from the SP Gold Stock Bottom Indicator work particularly well in the first 4-weeks after they occur.
Summing up, the SP Gold Stock Bottom Indicator generates short-term buy signals for gold, silver and mining stocks. The long-term performance after the signal is seen is also strong on average, but the significant correction after the first 4 weeks makes us reluctant to suggest using this indicator for medium-term rallies.
Default trading suggestion after signal: go long mining stocks, gold and silver with a 4-week long trade in mind.
Long-Term SP Gold Stock Bottom Indicator
The long-term version of the abovementioned indicator, the Long-Term SP Gold Stock Bottom Indicator focuses on less frequent, long-term bottoms. You can see the signals on the .
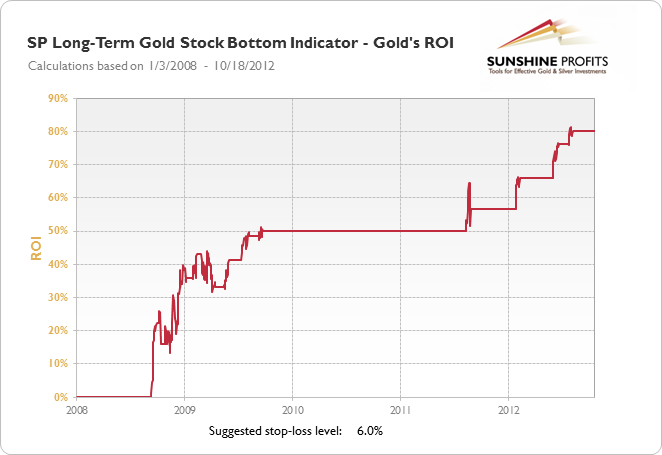
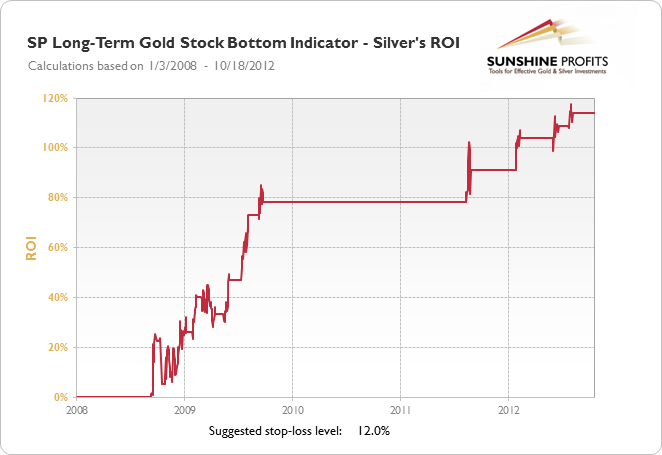
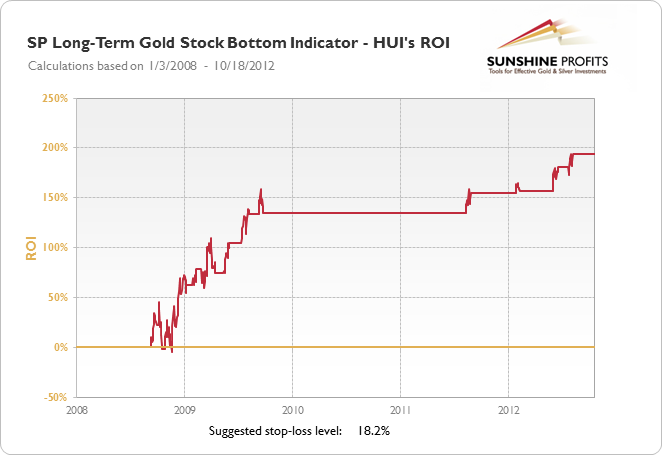
Past results confirm that returns after a buy signal were usually positive for gold, silver and the HUI Index. There is some correspondence to the results obtained from the regular version of this indicator – prices tended to rise after buy signals for 4-weeks with a correction afterwards. This once again suggests that the 4-week period may be the limit of betting on higher prices for this indicator.
Please note that the long-term version of the indicator is stronger when you compare their performance in 100 trading days but weaker when you compare the results after 20 trading days. This is consistent with the names of indicators – the long-term version produces better long-term signals, while the short-term one produces better short-term signals.
Summing up, the SP Long-Term Gold Stock Bottom Indicator provides buy signals for gold, silver and mining stocks (short- and long-term ones.)
Default trading suggestion after signal: go long mining stocks, gold and silver with short-term (2 weeks) trade in mind. Additionally, this indicator provides the major “get back to the long side of the precious metals market” signals if you were waiting on the sidelines with your long-term investment capital or were waiting for a great moment to enter the precious metals market in general.
SP Short-Term Gold Stock Bottom Indicator
The SP Short-Term Gold Stock Bottom Indicator is the short-term counterpart of the two last indicators. Its performance results for gold, silver and the HUI Index are presented in the charts below.
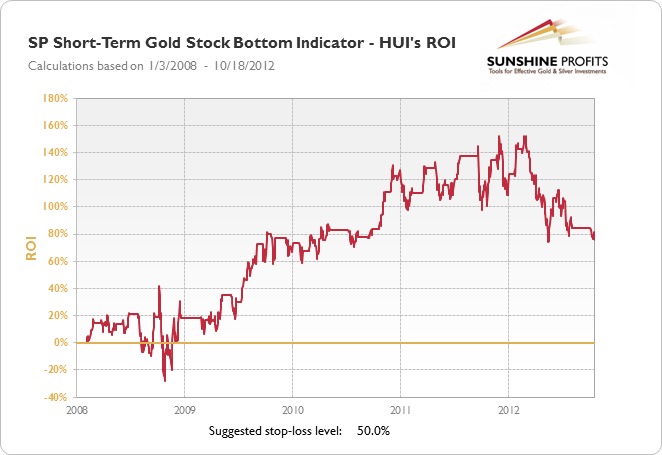
Similarly as has been the case before, returns after buy signals were positive for all analyzed assets.
This signal is a particularly interesting one as its implications for metals and stocks vary if we compare short- and long-term performance.
In the short run (the first 2-4 weeks after the signal is seen) gold stocks rally strongly on average even though the performance during the first several days can vary. However, gold and silver don’t rally significantly right after the signal is seen – silver even moves lower on average approximately one week after the signal is seen.
In the long run (after the first 4 weeks) the implications for the mining stocks become unclear and bullish for gold and silver.
Consequently, for short-term trades (which is generally where this signal will be used), this indicator provides buy signals for mining stocks and it is often a few days too early in predicting a bottom (it makes sense on average to go long right after it is seen, though).
Summing up, the SP Short-Term Gold Stock Bottom Indicator provides short-term buy signals for mining stocks.
Default trading suggestion after signal: go long mining stocks with a short-term (2 weeks) trade in mind.
SP Gold Stock Extreme Indicator
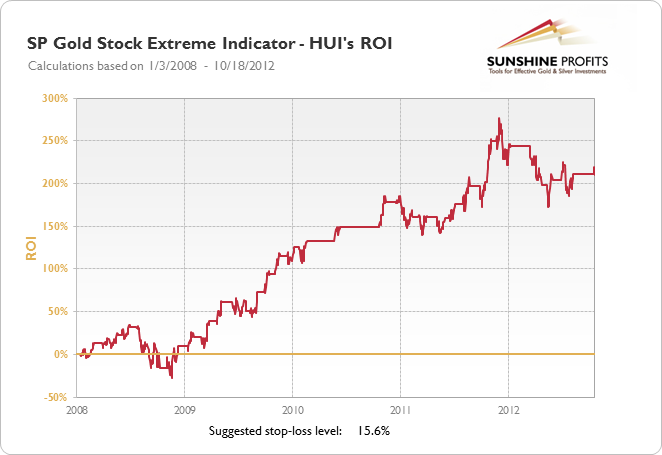
The SP Gold Stock Extreme Indicator is somewhat different than the already discussed indicators. It signals situations when extreme price moves are seen across the precious metals stocks (with some stocks moving sharply higher or lower). They are buy signals with short-term implications in case of mining stocks. Performance results of this indicator for gold, silver and the HUI Index are displayed in the charts below.
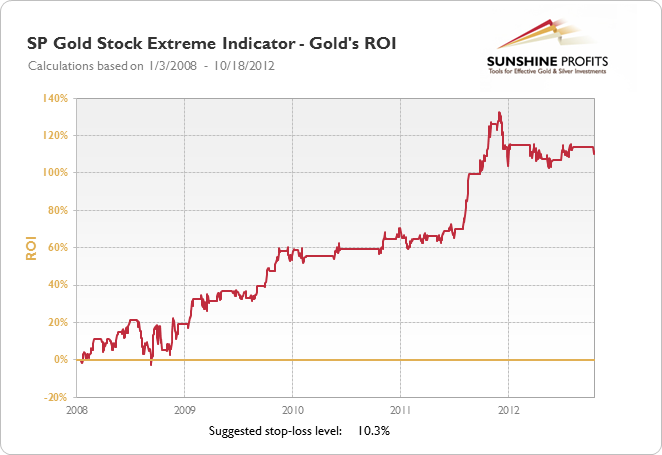
Performance after signals varies in time: within the first 5 trading days after the signal, on average, gold performs weakly, silver does nothing and mining stocks appreciate. This confirms that in the short-run signals from the SP Gold Stock Extreme Indicator were in fact mostly buy signals for gold and, even more, for mining stocks. Conversely, this indicator cannot be considered as generating short-term buy signals for silver.
The confidence intervals were narrowest for gold which suggests that the appreciation patterns after buy signals were relatively similar and the signals themselves were strong for that metal.
In longer time periods, gold’s performance is the only strong and reliable one. Silver and miners move higher as well, but the variability of outcomes was huge (this means the same for the uncertainty regarding medium-term predictions in case of silver and miners).
Summing up, the SP Gold Stock Extreme Indicator generates short-term buy signals for gold and mining stocks but not for silver.
Default trading suggestion after signal: go long mining stocks, and gold with short-term (2 weeks) trade in mind.
SP Gold Stock Extreme #2 Indicator
The SP Gold Stock Extreme #2 Indicator follows the same principles as the previous indicator with modifications. Again, the vast majority of signals from these indicators are buy signals. Performance results are summarized in the charts below.
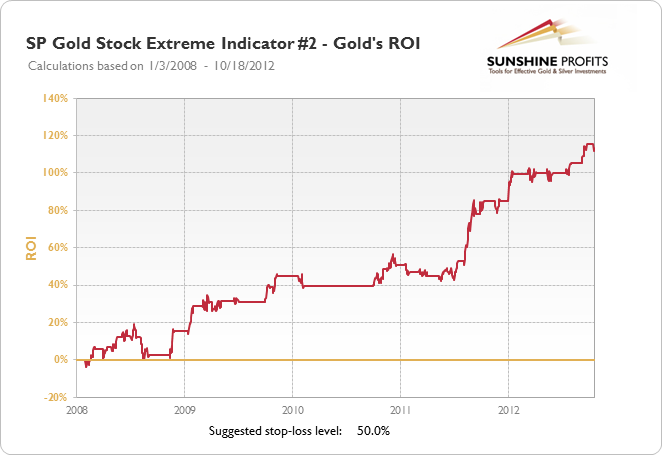
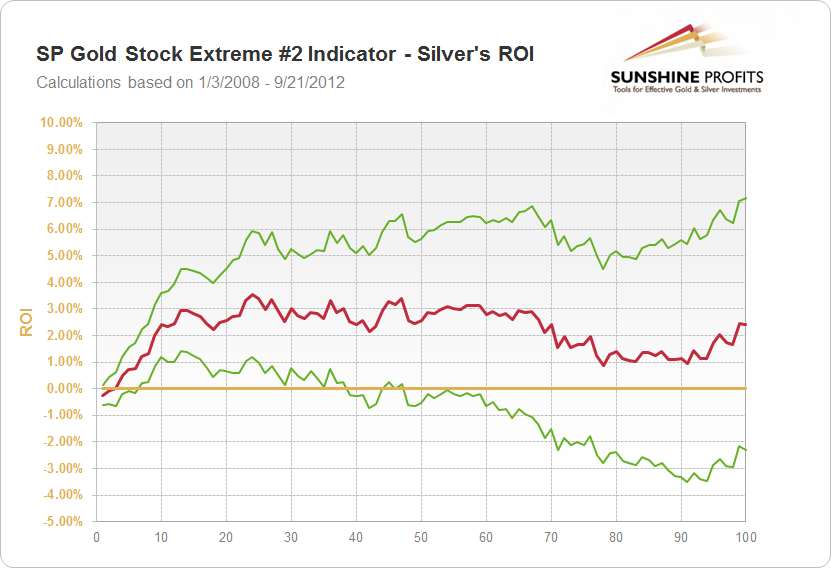
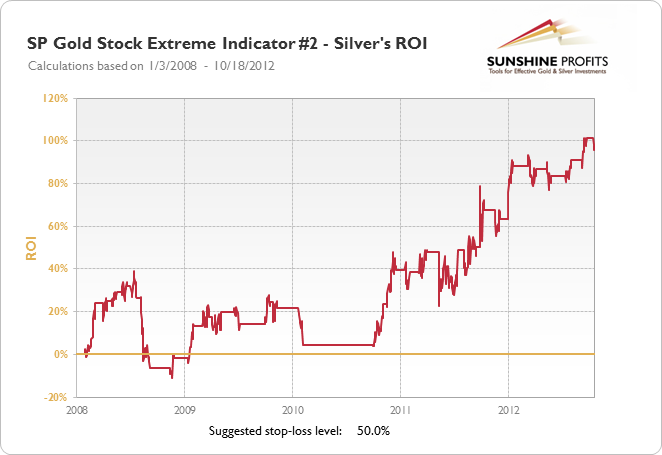
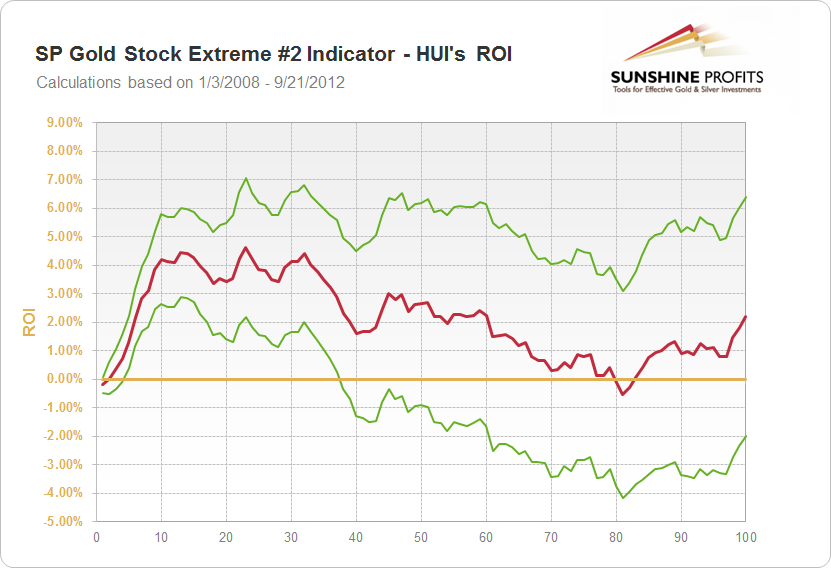
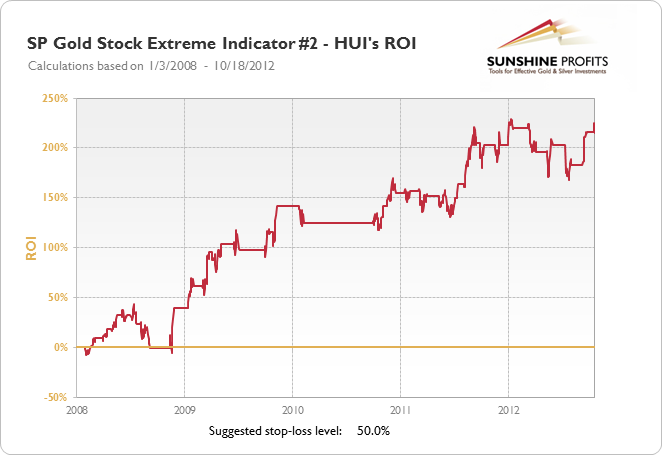
Returns for all the assets were, on average, strongly positive in the first 10 trading days after the signal with the strongest performance displayed by mining stocks. As the focus here is on short-term signals (the ones most frequently used in trading), the SP Gold Stock Extreme #2 Indicator displays consistent result for all the analyzed assets.
In longer periods, the initial rally was followed by a correction which either a breather (gold) or the actual end of the appreciation after the signal (silver, mining stocks).
Summing up, the SP Gold Stock Extreme #2 Indicator generates strong short-term buy signals for all the analyzed assets, but particularly for mining stocks.
Default trading suggestion after signal: go long mining stocks, gold and silver with short-term (2 weeks) trade in mind.
| Indicator | Used for | Suggested action | Stop-loss |
|---|---|---|---|
| SP Gold Bottom Indicator | Gold | Go long for 3 weeks | 0.7% |
| SP Gold Bottom Indicator | Silver | Go long for 3 weeks | 14.5% |
| SP Long-Term Gold Bottom Indicator | Gold | Go long for 2 weeks | 3.2% |
| SP Long-Term Gold Bottom Indicator | Silver | Go long for 2 weeks | none |
| SP Long-Term Gold Bottom Indicator | Mining stocks | Go long for 2 weeks | 3.0% |
| SP Gold Stock Bottom Indicator | Gold | Go long for 4 weeks | 6.6% |
| SP Gold Stock Bottom Indicator | Silver | Go long for 4 weeks | 12.0% |
| SP Gold Stock Bottom Indicator | Mining stocks | Go long for 4 weeks | 17.5% |
| SP Long-term Gold Stock Bottom Indicator | Gold | Go long for 2 weeks | 6.0% |
| SP Long-term Gold Stock Bottom Indicator | Silver | Go long for 2 weeks | 12.0% |
| SP Long-term Gold Stock Bottom Indicator | Mining stocks | Go long for 2 weeks | 18.2% |
| SP Short-term Gold Stock Bottom Indicator | Mining stocks | Go long for 2 weeks | none |
| SP Gold Stock Extreme Indicator | Gold | Go long for 2 weeks | 10.3% |
| SP Gold Stock Extreme Indicator | Mining stocks | Go long for 2 weeks | 15.6% |
| SP Gold Stock Extreme Indicator #2 | Gold | Go long for 2 weeks | none |
| SP Gold Stock Extreme Indicator #2 | Silver | Go long for 2 weeks | none |
| SP Gold Stock Extreme Indicator #2 | Mining stocks | Go long for 2 weeks | none |

Dear Sunshine Profits,


