
At the end of October, in our essay on dollar and the general stock market we discussed the USD and S&P 500’s implications for the precious metals market. After that, in our essay on gold price in November we examined the long- and the-short-term outlook for gold. And finally, in our Wednesday’s essay we discussed the situation in the Euro Index and mining stocks. Back then, we wrote that the bearish outlook for the Euro Index was also bearish for gold, silver and mining stocks.
After that essay was published, gold dropped below an important support level at $1,300. Please note that the yellow metal has been trading below $1,300 since Friday and has fallen about 3% in the last four sessions as data on strong U.S. economic and jobs growth boosted speculation that the Federal Reserve will move to reduce its bond purchases and remove a long-running source of support from the gold market. Taking the above into account, investors are probably wondering whether the final bottom of the recent corrective move is already in or not. Will gold test the strength of the October low in the coming days?
Before we try to answer this question, we’ll examine the US Dollar Index and the Euro Index (from many perspectives) once again to see if there’s anything on the horizon that could drive the price of gold higher or lower in the near future. After that, we’ll check what the current situation in the gold market is. We’ll start with the long-term USD Index chart (charts courtesy byhttp://stockcharts.com).
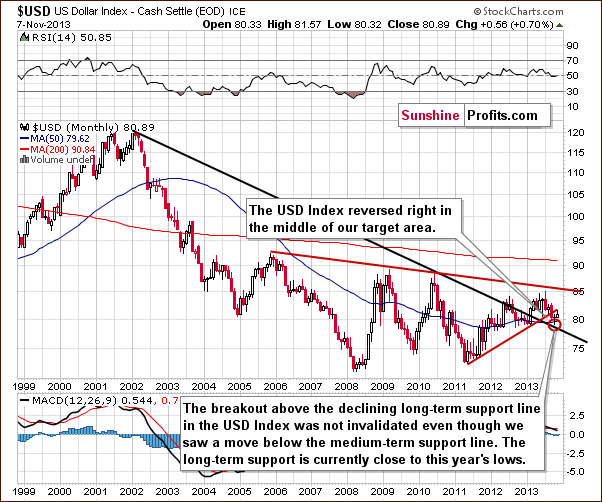
On the above chart, we see that the long-term breakout above the declining long-term support line was not invalidated. Additionally, the USD Index reversed right in the middle of our target area. Therefore, from this perspective, it seems that the downward move will be quite limited – if it’s not already over – because the long-term support line will likely stop any further declines.
Now, let’s examine the weekly chart.
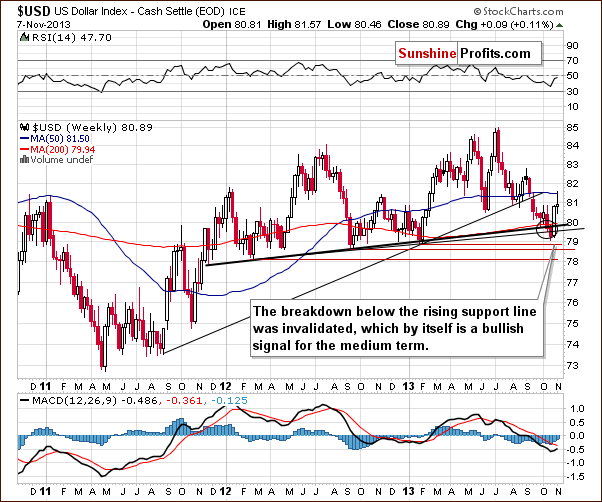
Looking at the above chart, we clearly see that the situation has improved. In our last Premium Update published in October we wrote that the USD Index had moved higher and the move below the lower support line had already been invalidated. The invalidation by itself is a bullish signal. Back then, we assumed that if we saw a bold move back above the 80 level, the breakdown would be fully invalidated and the implications would be clearly bullish for the weeks to come.
On the above chart, we see that the U.S. dollar extended gains in the previous week (and earlier this week), which was in perfect tune with our initial scenario. In this way, the breakdown below the medium-term support line based on the February 2012, September 2012 and January 2013 lows (bold black line) was also invalidated, which is a bullish signal for the medium term.
Let’s check the short-term outlook.
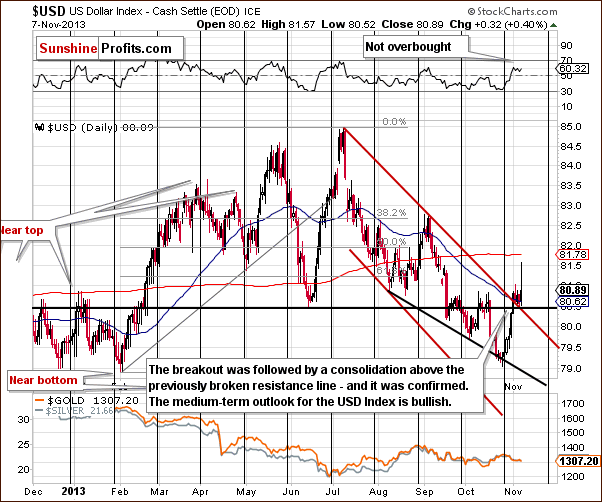
On the above chart, we see that the price bounced off the 2013 low which we saw in early February. Those who have been following our analyses for some time now are probably not surprised to see that the turnaround happened at the cyclical turning point.
Quoting our essay on the dollar and general stock market from Oct. 25, 2013:
(…) there is a cyclical turning point just around the corner. Therefore, we could see a reversal of the current bearish tendency in coming weeks. This can lead to a bigger pullback, especially when we take into account the fact that the USD Index remains in a short-term downtrend.
On the daily chart, we see that USD Index rallied last week and moved above the previously-broken resistance line based on the June low. Additionally, the U.S. dollar broke above the short-term resistance line based on the July and September highs. Looking at the above chart, we see that both breakouts were confirmed.
Although yesterday the U.S. currency declined slightly, from this point of view the outlook for the USD Index is still bullish.
Let’s now take a look at the Euro Index.
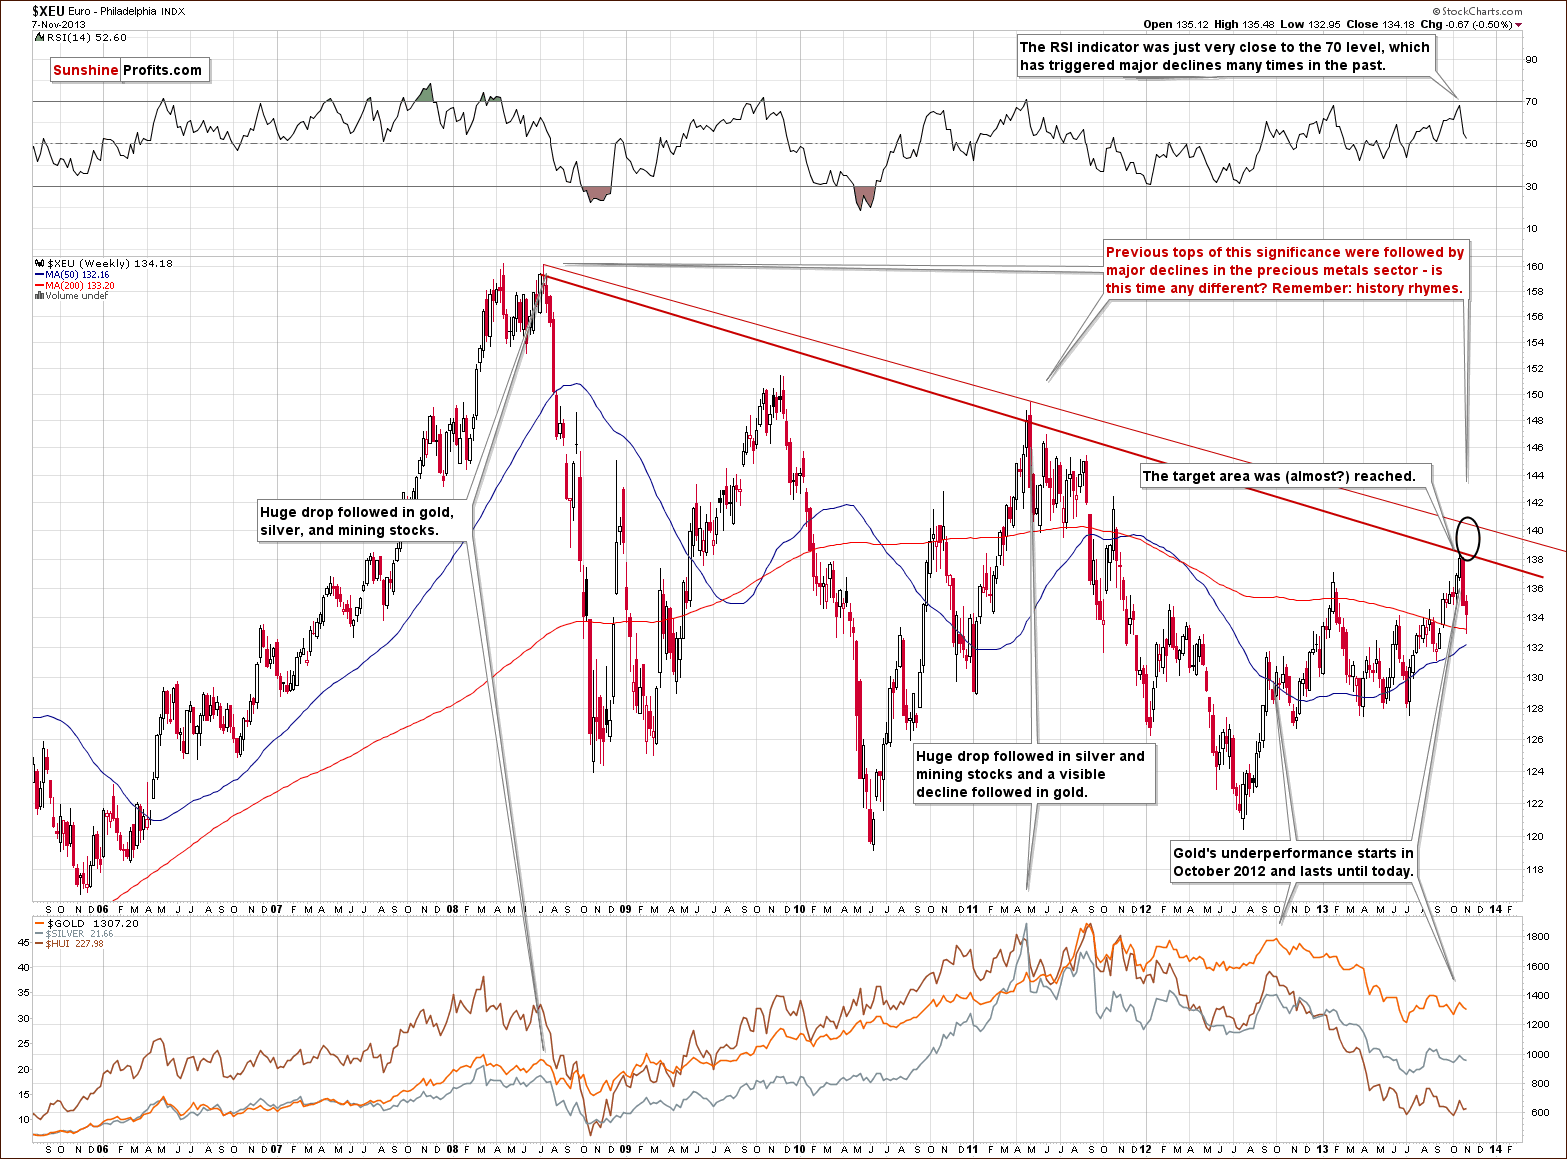
Quoting our Wednesday’s essay on the Euro Index and mining stocks:
Looking at the above chart we see that the long-term downtrend remains in place. Additionally, it seems that the short-term uptrend might already be over. In the previous week, the RSI bounced off the 70 level, which was a bearish sign. At the same time the Euro Index moved very close to the strong resistance created by the declining resistance line, but it didn’t break above it. This show of weakness in combination with the position of the RSI triggered a heavy decline and the European currency dropped below the 135 level. Earlier this week, the euro extended declines and it seems that the downward move is not limited at the moment.
At this point, we would like to emphasize one important fact: the previous tops (in 2008 and then in 2011) were followed by major declines in the precious metals sector. If history repeats itself we may see similar price action in this situation.
On Thursday, we saw further deterioration in the European currency and the euro dropped to its lowest level since mid-September. Although we saw some improvement in the recent days, the Euro Index still remains below the level of 135.
To see the current situation more clearly, let’s zoom in on our picture and move on to the medium-term chart.
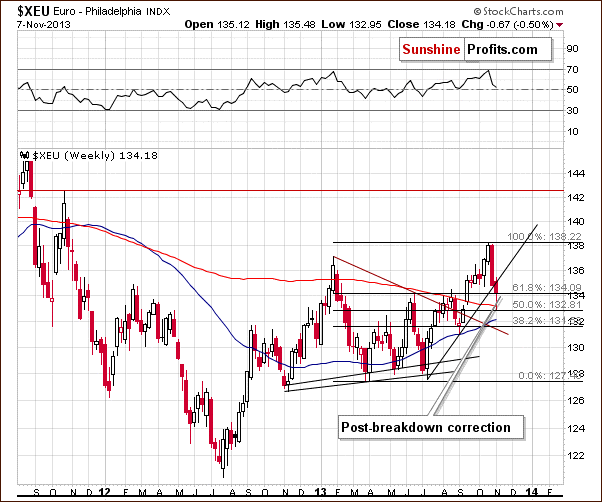
From the medium-term point of view, the situation is a mirror image of what we saw on the short-term USD Index chart. The euro moved below its rising support line and corrected afterwards without invalidating the breakdown. Please note that the Euro Index corrected 50% of its entire July – October rally, which means that it could pause before the rally continues. In fact, it already has by correcting to the upper Fibonacci retracement level. As mentioned earlier, although we’ve seen some improvement in the recent days, the Euro Index still remains below the level of 135. Additionally, the breakdown below the rising support line hasn’t been invalidated.
Please note that if we see a move below the lowest of the marked Fibonacci retracement levels, we’ll have a much more bearish situation. It is already bearish now, but the implications will be stronger if a move below 131.56 is seen.
Having discussed the current situation in the U.S. dollar and the European currency, let's see how it may translate into the precious metals market. Let's take a look at the Correlation Matrix.
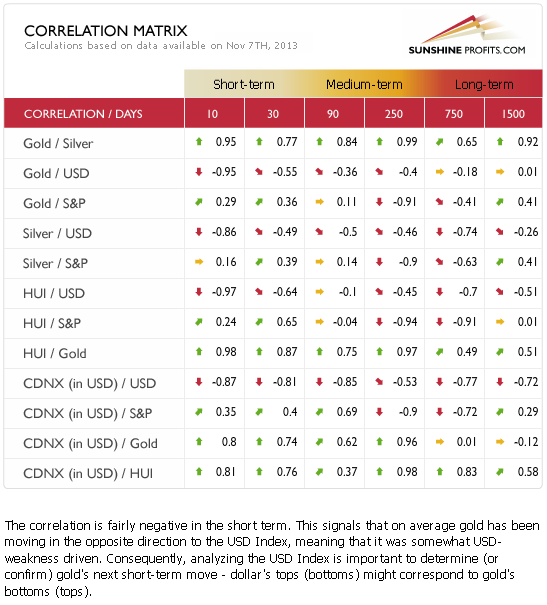
The Correlation Matrix is a tool which we have developed to analyze the impact of the currency markets and the general stock market upon the precious metals sector (namely: gold correlations and silver correlations).
At the end of October, we wrote that the values in the above table were getting back to their normal values, but that it was not fully clear if this was really the case, or it was just short-term price noise.
Based on the most recent data, it seems that the negative correlation is back in case of the USD Index and the precious metals market. Consequently, the implications of the situation in the USD Index are not only bearish in the medium term, but also in the short term.
Once we know what the current situation in the USD and Euro indices and its implications for precious metals, let's move on to gold’s very long-term chart.
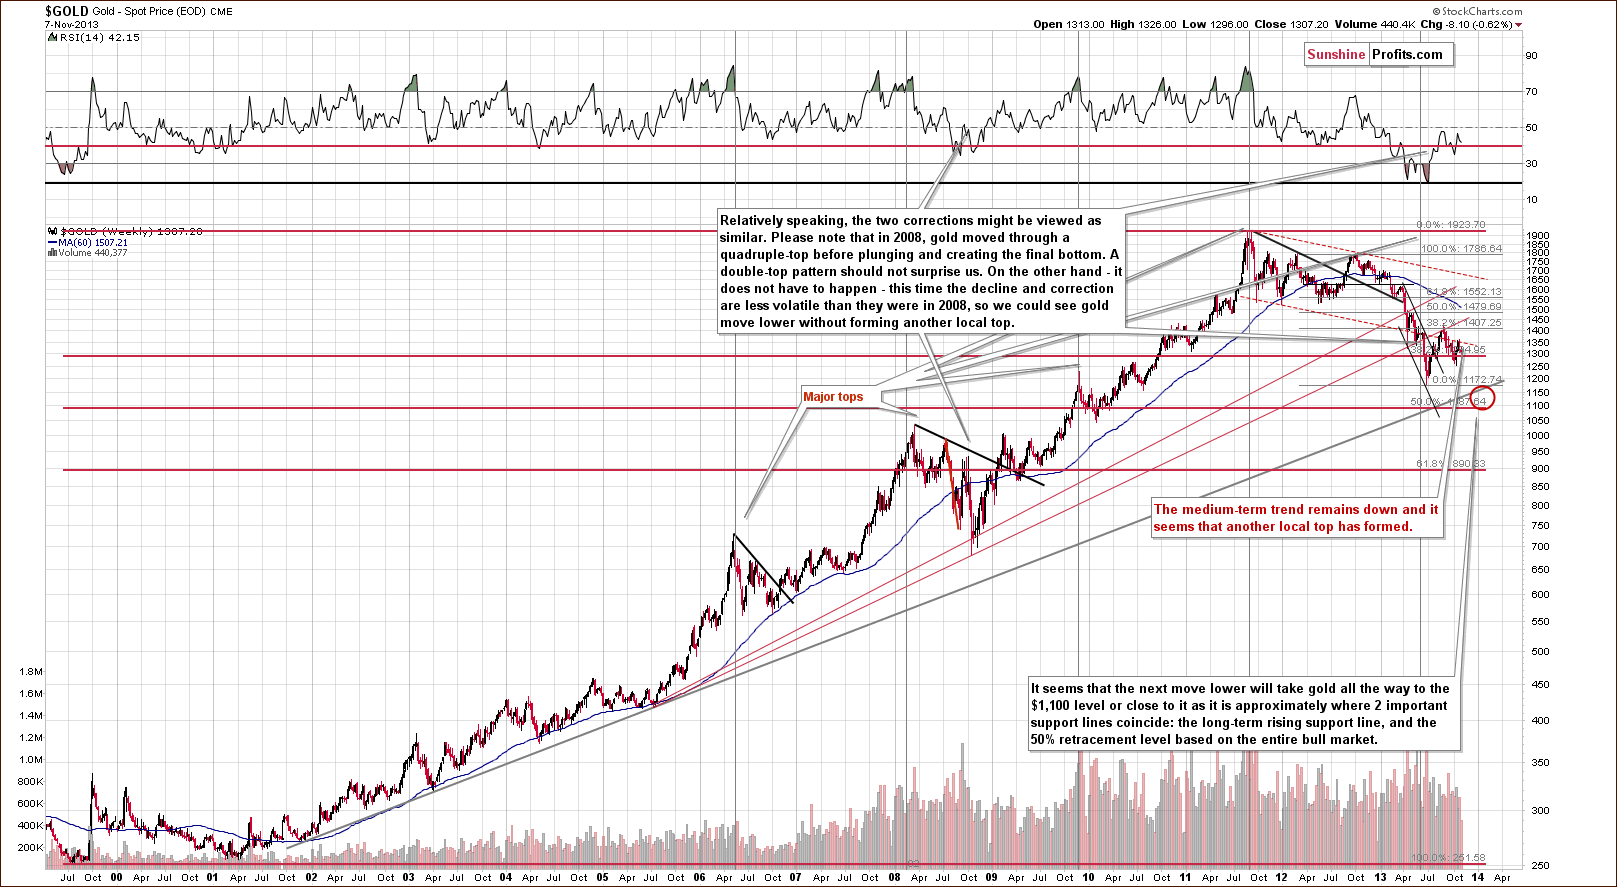
Looking at the above chart, we see that the situation hasn’t changed much from the long-term perspective. Before the beginning of the week, the medium-term outlook was bearish as gold had already broken below the long-term rising support line and last week’s decline naturally didn’t make the situation look bullish.
The medium-term trend remains down and, from this perspective, it seems that another local top has formed. Therefore, further deterioration is quite likely, if not immediately, then at least soon.
Before we summarize, let’s take a look at the chart featuring gold’s price from the non-USD perspective.
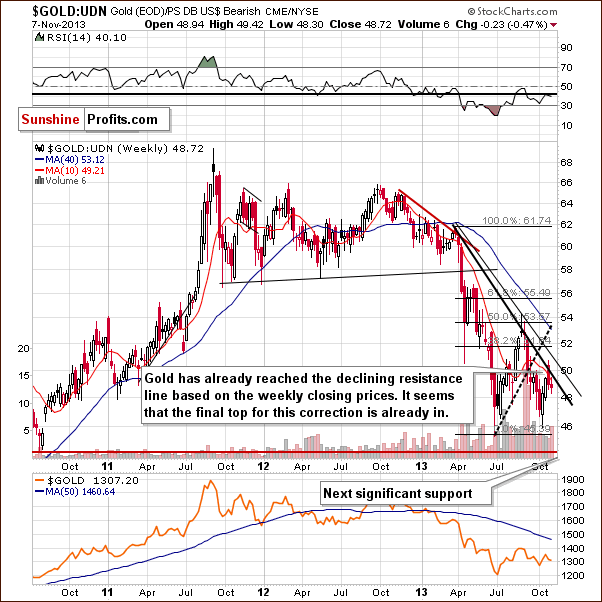
Looking at the above chart, we see that although the non-USD gold price moved above its declining resistance line (an intra-day move) at the end of October, this improvement was only temporary. In the previous week, we saw a drop below this line and the breakout was invalidated, which by itself is a bearish signal for the short and medium term. Earlier this week, we saw further deterioration and the non-USD gold price declined once again.
From this perspective, it seems that the recent correction was nothing more than a confirmation of a breakdown that we saw begin in mid-September. Therefore, the medium-term outlook remains bearish.
Summing up, looking at the current situation in the Euro index, we could see further deterioration in the European currency and strength in the USD Index not only on a short-term basis, but also in the medium term. Although the euro rebounded in the recent days, it didn’t trigger an upward move in gold, which confirms that the implications for the precious metal market are bearish. The medium-term outlook for gold remains bearish, and at this time the short-term outlook is bearish as well.
Thank you.
Przemyslaw Radomski, CFA
PS. Please keep in mind that the situation on the precious metals market may change quickly and what you read above may become outdated before you read our next free essay. That's why our premium subscribers receive Market Alerts as soon as anything important takes place - they remain covered at all times. Moreover, our subscribers read full versions of our articles that we call Premium Updates - they are much more in-depth and thorough than free commentaries posted in this section, so by reading them you are better and earlier prepared when major changes regarding gold and silver occur. Premium Updates include price targets and trading suggestions as well. Our subscribers also enjoy up-to-date and tailor-made (!) gold stocks ranking, silver stock ranking and more. We encourage you to join our subscribers and also enjoy all of the above-mentioned benefits.
Back