
Based on the October 31st, 2013 Premium Update. Visit our archives for more gold articles.
In our previous essay we took a closer look at the situation in silver and mining stocks (precisely: SLV and GDX ETFs) and discussed how it may translate into the precious metals market. As we wrote in the summary:
(…) when we factor in the impact of (…) silver's cyclical turning point, which is just around the corner, and the fact that the short-term resistance lines have already been reached in case of the GDX ETF, we can presume that the top of the recent upward move in the precious metals may be already in (or is very close to being in).
After that essay was published, silver moved slightly above the medium-term declining resistance line on an intra-day basis, but didn’t manage to hold these gains. Therefore, it's quite possible that we have already seen the impact of silver's cyclical turning point on the white metal. Additionally, the GDX ETF quickly invalidated the breakout above the 50-day moving average and the 38.2% Fibonacci retracement level. When we take into account the recent price moves in both, we can conclude that our projections from the previous essay’s summary remain in place.
These circumstances have encouraged us to focus on the most interesting asset – gold. Does it confirm the indications for silver and mining stocks? To see what we can expect in the gold market, let us move to the world of charts. Today, we will start with the yellow metal's very long-term chart (charts courtesy by http://stockcharts.com.)
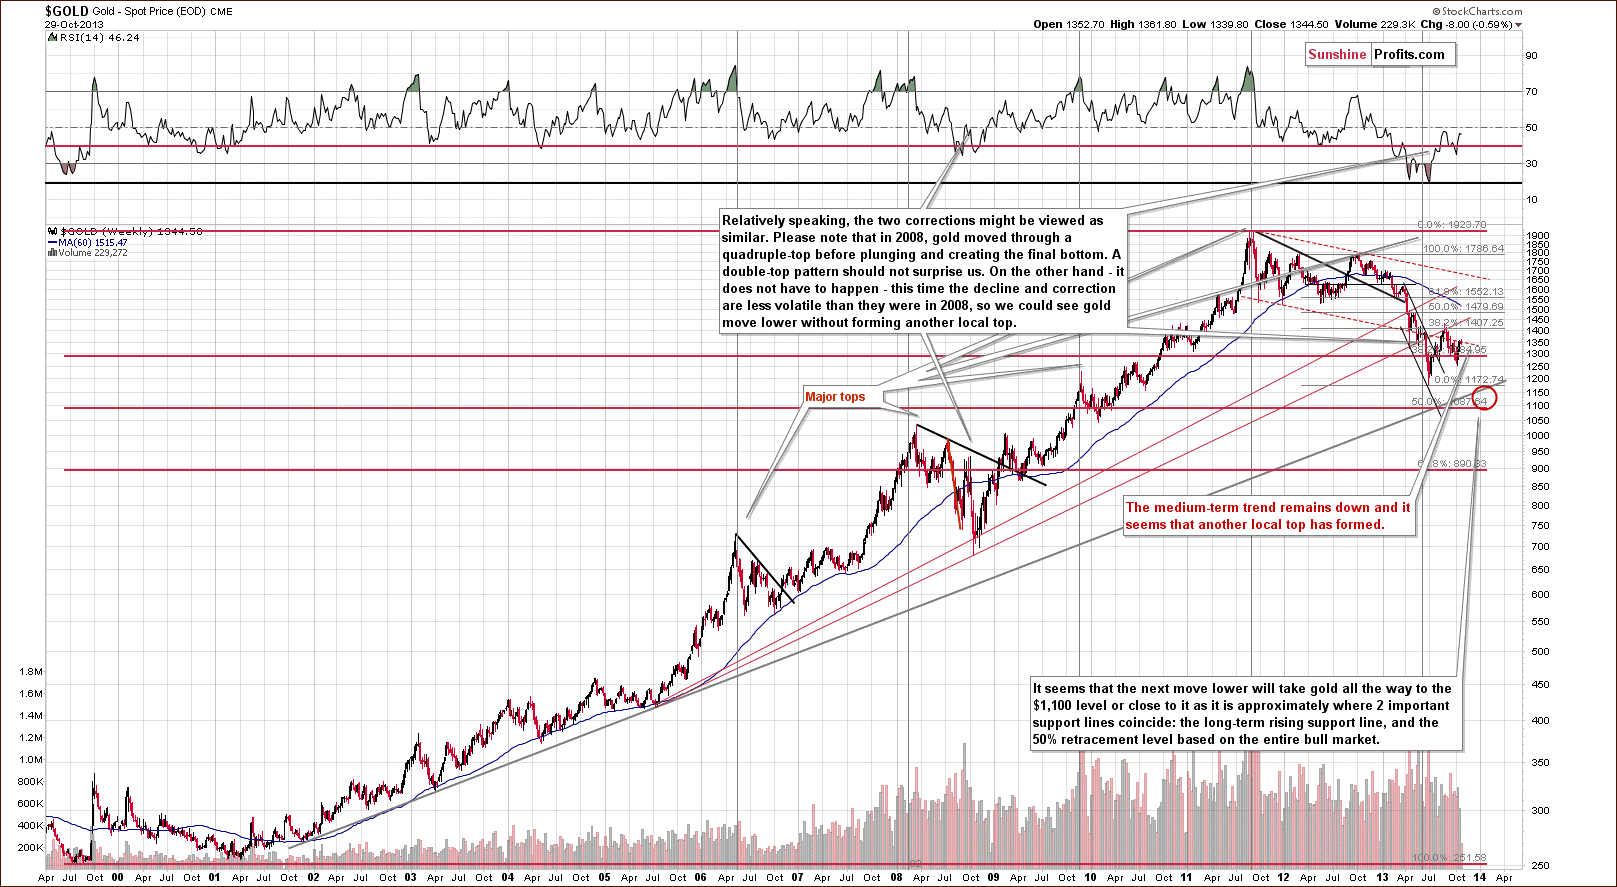
Once again, we see that the situation hasn’t changed much from this long-term perspective. It was bearish as gold had already broken below the long-term rising support line and this breakdown wasn’t even close to being invalidated this week.
Please note that in 2008, when gold moved higher before plunging for the final time, there were several intra-week attempts to move higher after which gold finally declined. Therefore, a double top pattern should not surprise us here.
Actually, we’ve recently seen a similar pattern on a smaller scale. It’s more visible on the short-term chart. Let’s take a look.
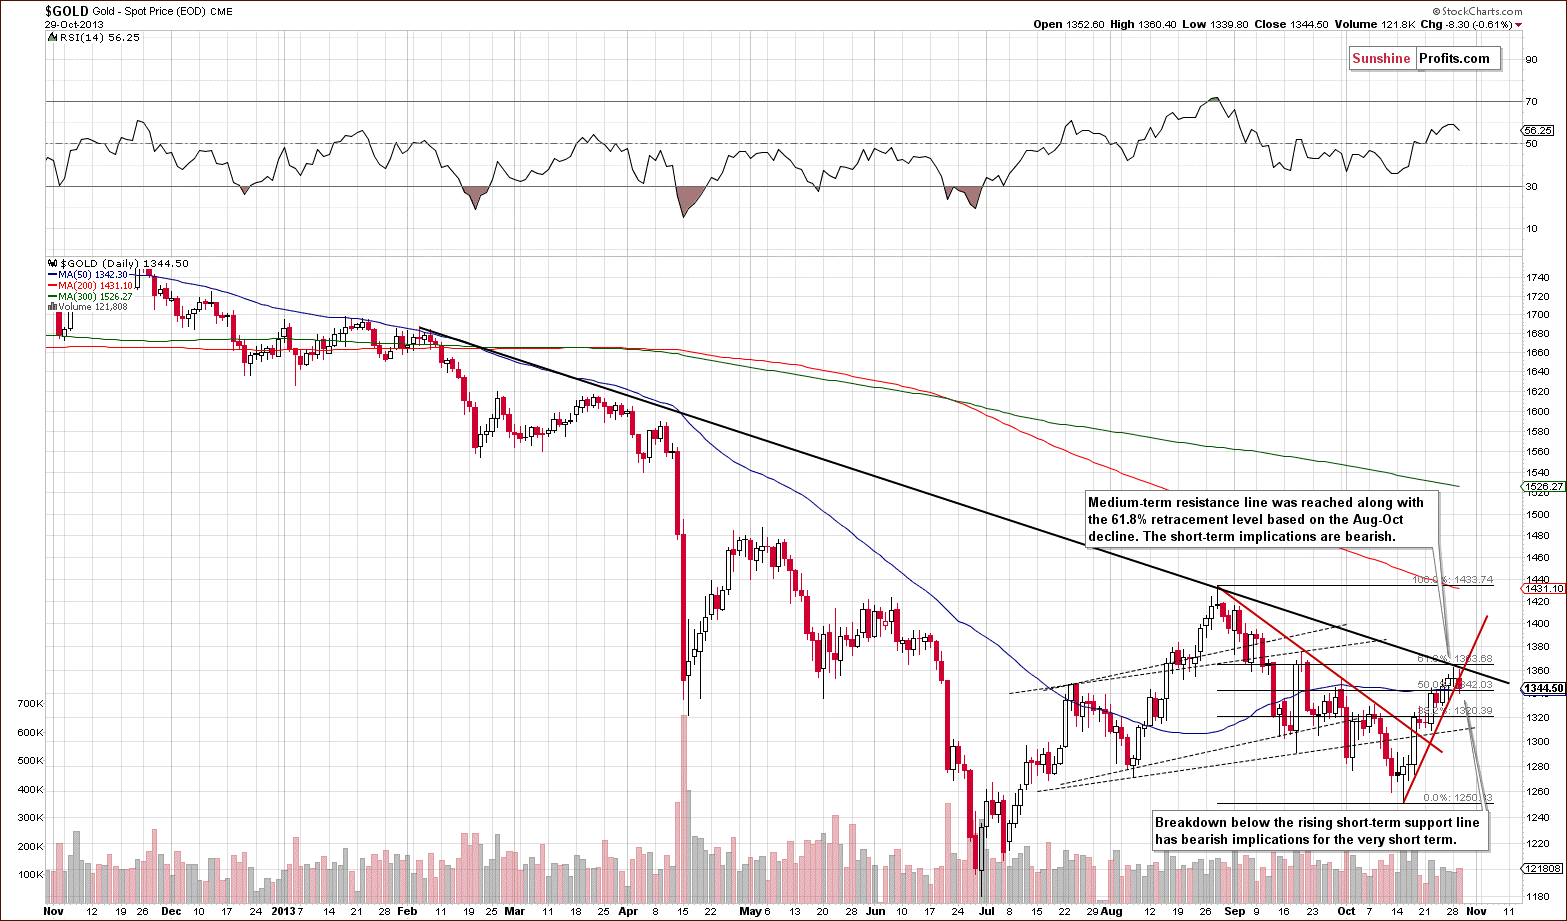
On the above chart we can see two things:
1. Gold reached the declining resistance line and the 61.8% Fibonacci retracement level 3 times (intraday highs) in the last 3 days but failed to break it.
2. The yellow metal has broken below the short-term rising support line (marked in red on the above chart).
The first point has bearish short- and medium-term implications and the second one has bearish short-term implications.
Either way, the outlook remains bearish.
Before we summarize, let’s take a look at the chart featuring gold’s price from the non-USD perspective.
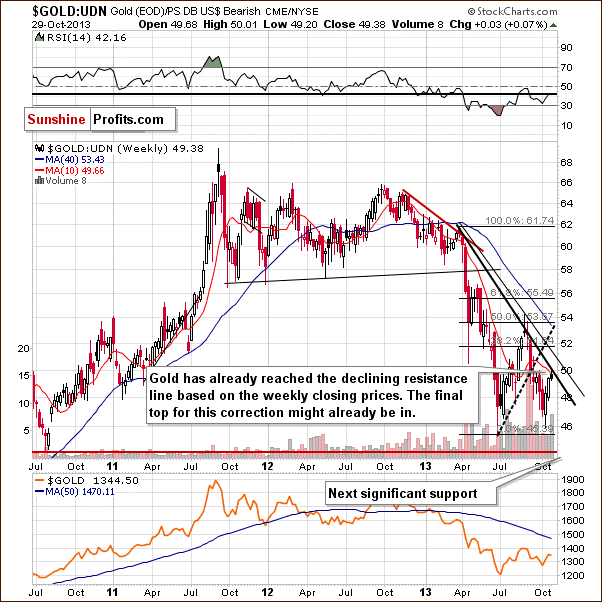
Looking at the above chart, we see that from this perspective, the situation is quite unclear. On the one hand, we might see a post-double-bottom rally. However, on the other hand, a pullback might be nothing more than a confirmation of a breakdown that we saw begin in mid-September.
The non-USD gold price moved to its declining resistance line (similar to the USD gold price) and declined. In this case we are taking the weekly closing prices into account. Naturally, we could see a move up to 51 on the above chart and the medium-term outlook would remain bearish, but it’s not that likely that we will see an additional rally.
Summing up, the medium-term outlook for gold remains bearish and, at this time, the short-term outlook is bearish as well. It seems that the precious metals sector reversed direction this week right after moving to the declining resistance lines. We can see this important event in gold, silver and mining stocks. From this point of view, it might be the case that the next major downleg has already begun and it seems likely that we will see at least a short-term downswing shortly.
We suggested our subscribers to switch from a long position in gold, silver and mining stocks to a short one on Monday. Longs were closed with gold above $1,360 and shorts were opened with gold above $1,350. How much would you have gained by knowing our signals in advance? You can get the next ones by signing up to our Premium Service.
Thank you.
Sincerely,
Przemyslaw Radomski, CFA
