

Gold & Silver Trading Alert originally sent to subscribers on January 19, 2015, 7:00 AM.
Briefly: In our opinion no speculative positions are currently justified from the risk/reward perspective. Being on the long side of the precious metals market with half of the long-term investment capital seems justified from the risk/reward perspective.
Gold soared on Friday once again and so did the USD Index. It was yet another day of the two rallying together, which is a very bullish development. What’s next?
We generally don’t post alerts when the markets are closed, but we decided to update you this time anyway, as quite a lot happened last week and we thought that posting a comment today would be useful to you.
The medium-term outlook has improved greatly, but not based on what most market participants (individual investors, mutual- and gold hedge funds, etc.) think. The most recent move higher is not what improved it – we have already seen significant – yet counter-trend – rallies in the past years, which didn’t change the medium-term trend, so why should this one be any different? The real difference comes from the situation in the gold-USD link and the gold link to the bond market. Let’s start today’s alert with the USD Index (charts courtesy of http://stockcharts.com).
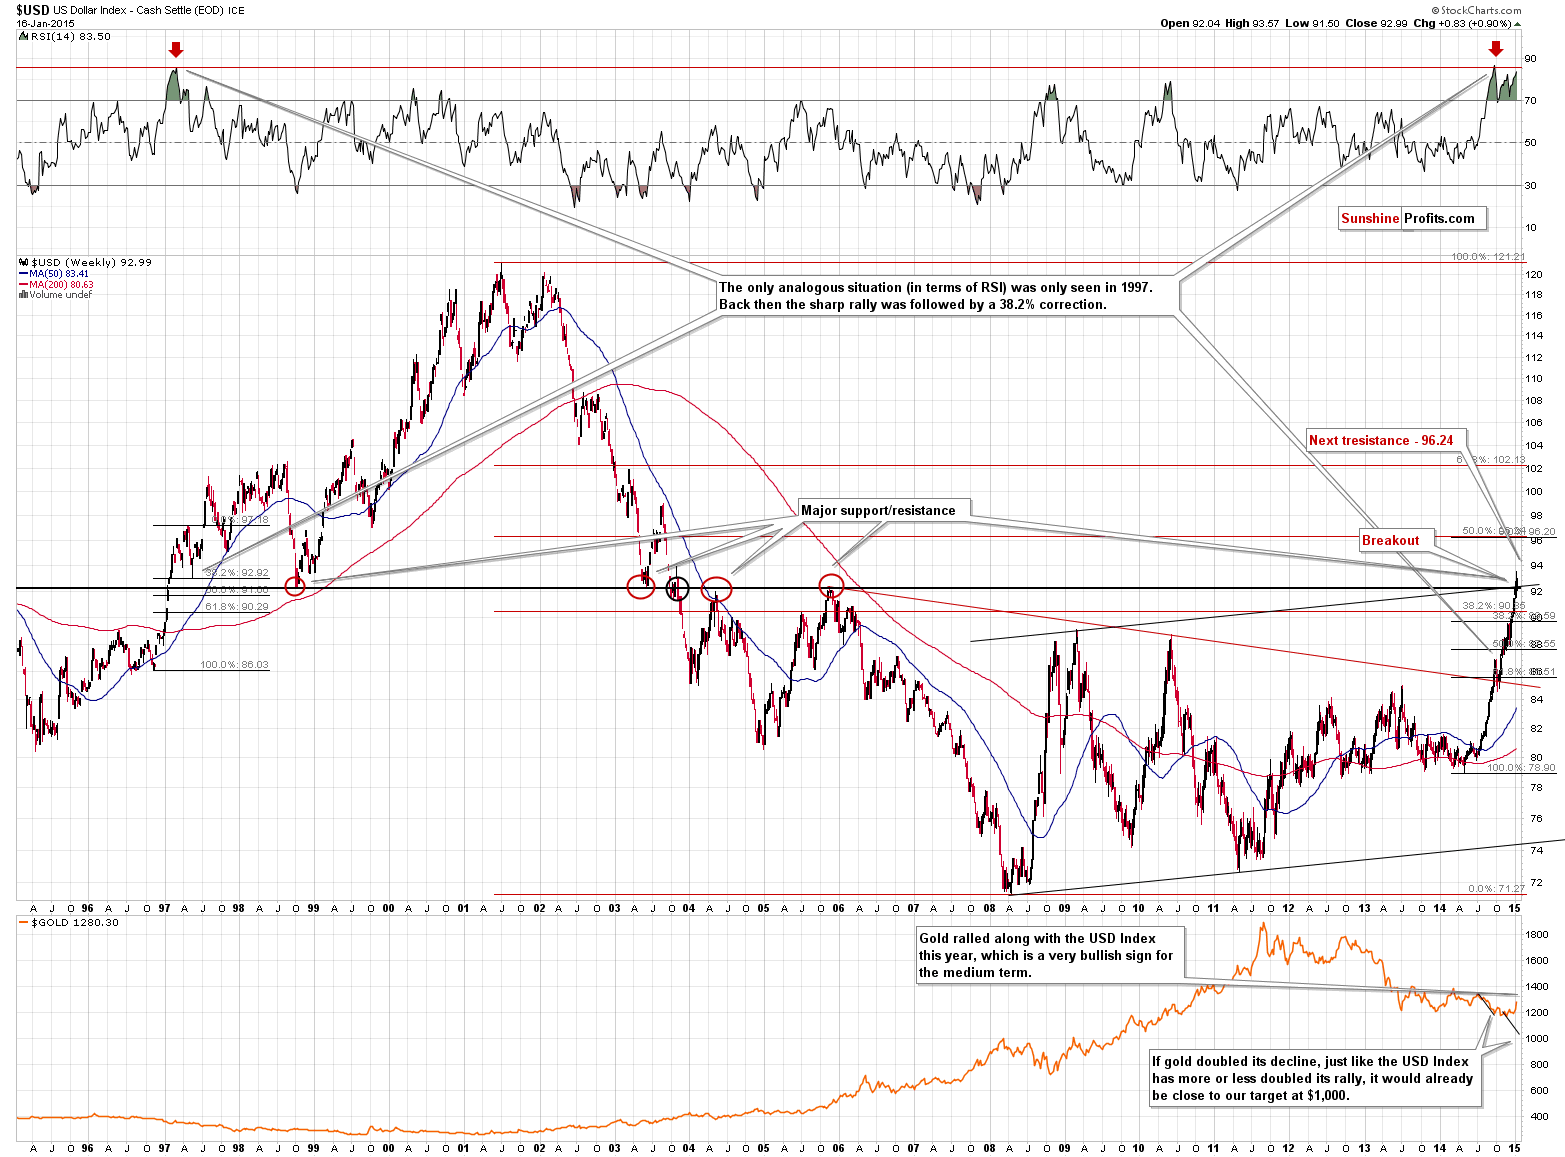
The USD Index moved and – more importantly – closed the week above the resistance level. We have just seen a breakout.
The USD Index had been trading below the resistance for some time and it paused at the cyclical turning point. Perhaps the pause was the effect that the turning point had – the trend might have been too strong for this signal to generate a decline.
The breakout has not yet been verified, but a weekly close above the resistance (quite visibly above it) is quite meaningful. The situation is not very bullish yet, but it’s more bullish than not at this time. The next resistance is slightly above the 96 level, so there’s quite significant upside potential.
The above has bearish implications for the gold market, however, given gold’s recent ability to rally along with the USD, we could expect the bearish implications to be delayed. Let’s check the signal from the bond market.
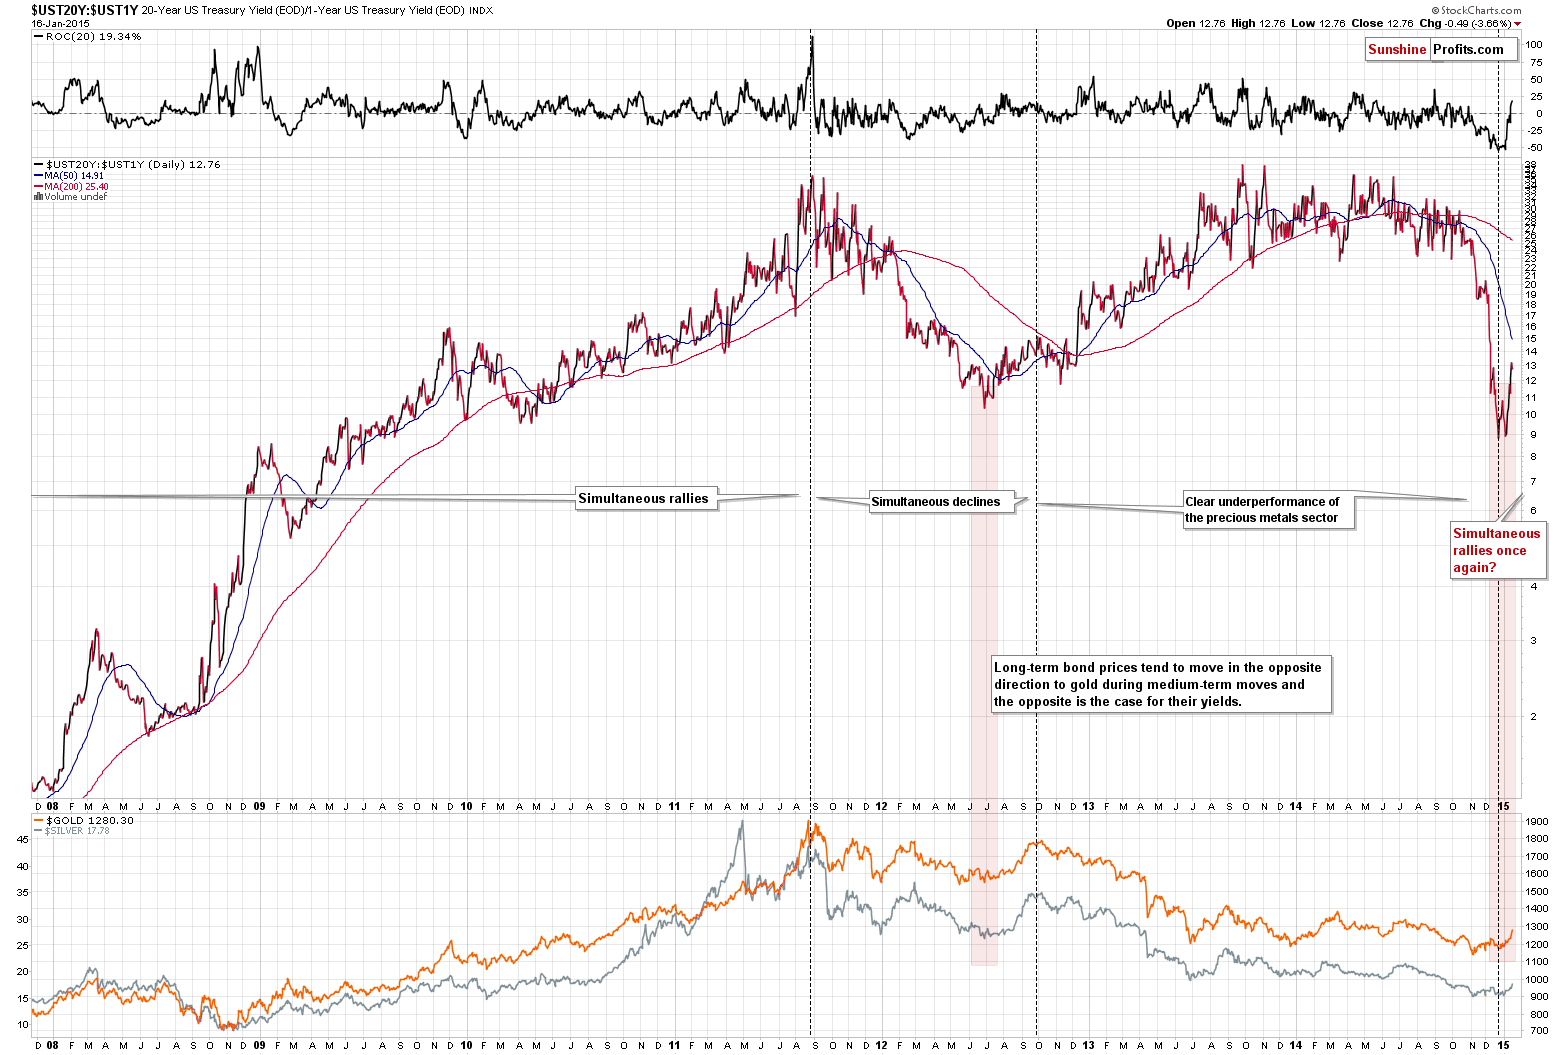
Let’s be clear – the above chart doesn’t have meaningful short-term implications. It covers many years to filter-out the short-term price swings and focus on the main trends. The relationships between major economic indicators, such as gold and bond prices, don’t have to work in the short term – they are not technical tools. The way the two markets react to each other can tell us something about the major trends, though.
We divided the entire period into 4 sub-periods. Before mid-2011 both gold and the ratio of 20-year to 1-year bond yields rallied. Then they both declined for about a year. After that the ratio moved higher, while gold declined. The early divergence was a bearish sign indicating a major decline.
In the final weeks of 2014 we saw something different. The gold market finally reacted to the moves in the bond market. The huge decline in the ratio wasn’t able to push gold price lower but gold reacted visibly to a move up in the ratio. They are both rallying together this year. This suggests that the next big change in the precious metals market “is here” and that it was a very good decision to get partly back on the long side of the market with the long-term investments a few tens of dollars ago in the case of gold.
On the above chart, we’ve marked the only situation that was similar to the current one – the 2012 bottom. Both the ratio and gold bottomed after a visible decline and then started to rally together. Back then it meant that a rather significant rally would follow in gold. However, there was some back and forth trading before gold moved much higher.
Will gold decline or rally shortly?
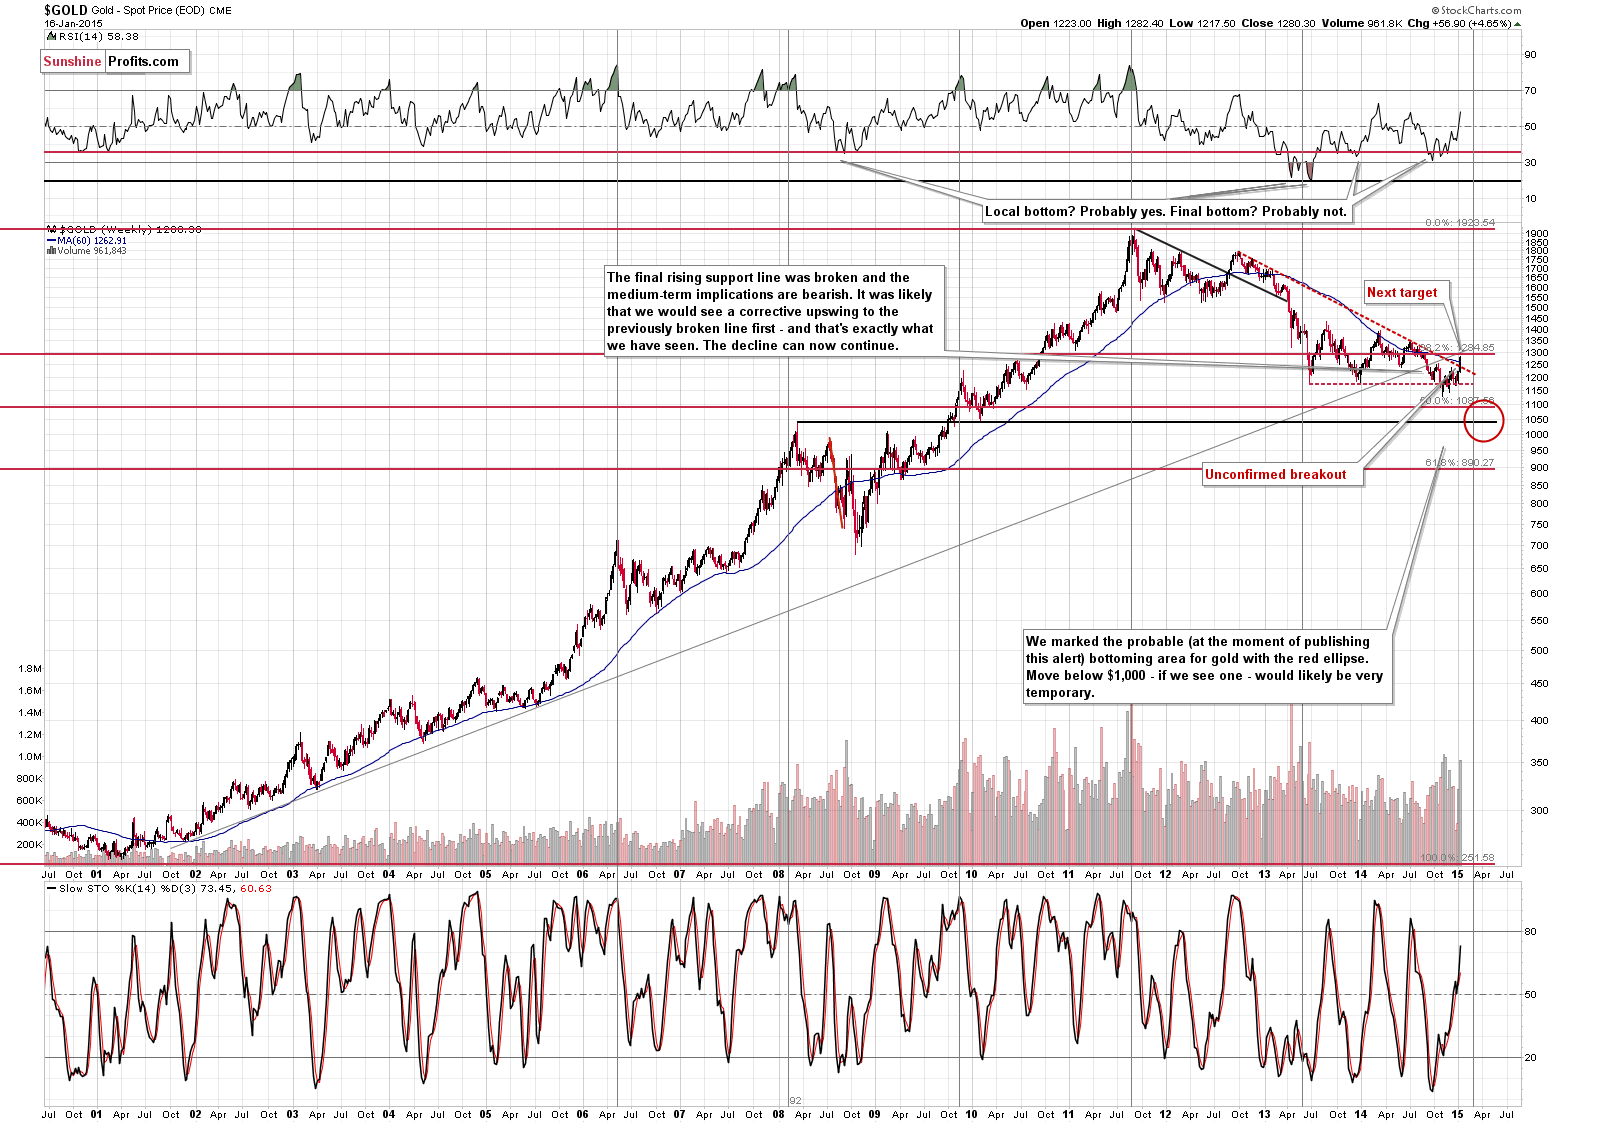
Gold moved visibly higher above the declining resistance line and ended the session close to the 38.2% Fibonacci retracement level based on the 2001 – 2011 rally, which was a significant support at the time and now could provide resistance. The next significant resistance is at about $1,300, which is not only a psychologically important number (being a round one) – it’s also where the rising very long-term resistance line is currently located.
Please note that the long-term cyclical turning point is very close. The previous turning point was due in mid-2013 and the major bottom materialized several weeks after that point. Perhaps it will be the case once again, which means that we could see a bottom after April or so. It’s not a very strong bearish factor, but we’d say it’s something worth keeping in mind – especially given the breaking-out USD Index.
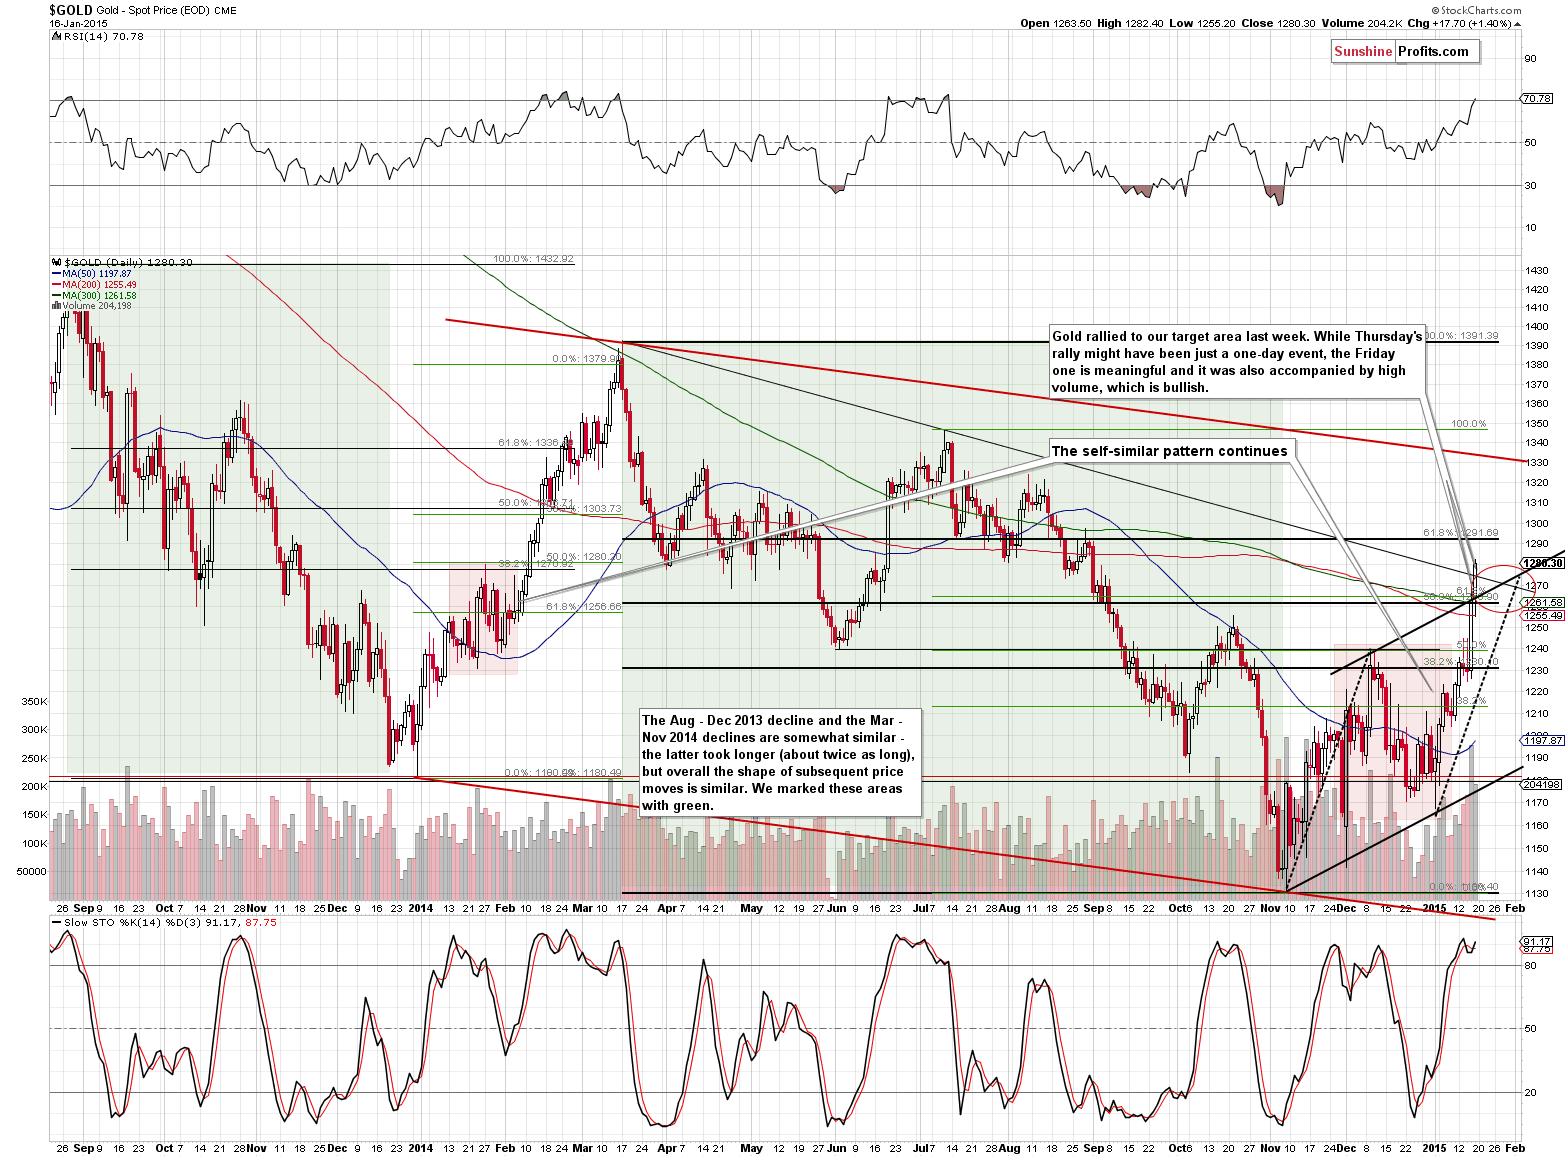
Gold broke above the medium-term resistance line and several other resistance levels, but this move has not been verified, and if the USD Index keeps rallying, it might not be verified. On the other hand, the self-similar pattern that we marked on the above chart in green and red remains in place, which has bullish implications as back in Feb. 2014 gold rallied even higher before stopping.
The RSI indicator just moved above 70, which means that the rally could pause or stop shortly. In June 2013 gold kept rallying for a few more weeks, but it didn’t move much higher. We could be in this type of situation once again.
In our previous alert, we wrote the following:
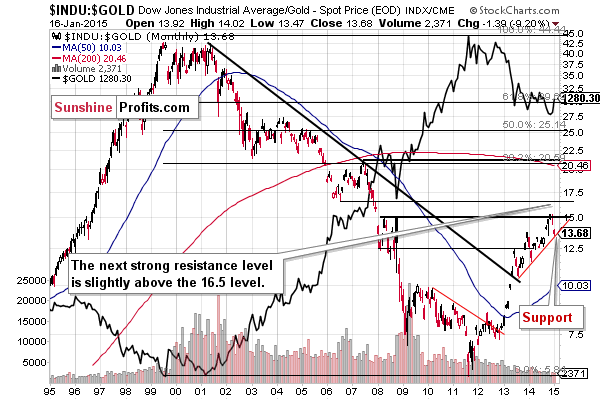
Because of the rising red support line, the Dow to gold ratio chart tells us that this ratio could move lower, but it’s not likely to move much lower before stopping or pausing. This means that gold could move higher but not likely much higher before stopping or pausing.
Gold has indeed moved higher and the ratio has moved lower, reaching the support line. The implications are bullish for the ratio and bearish for gold.
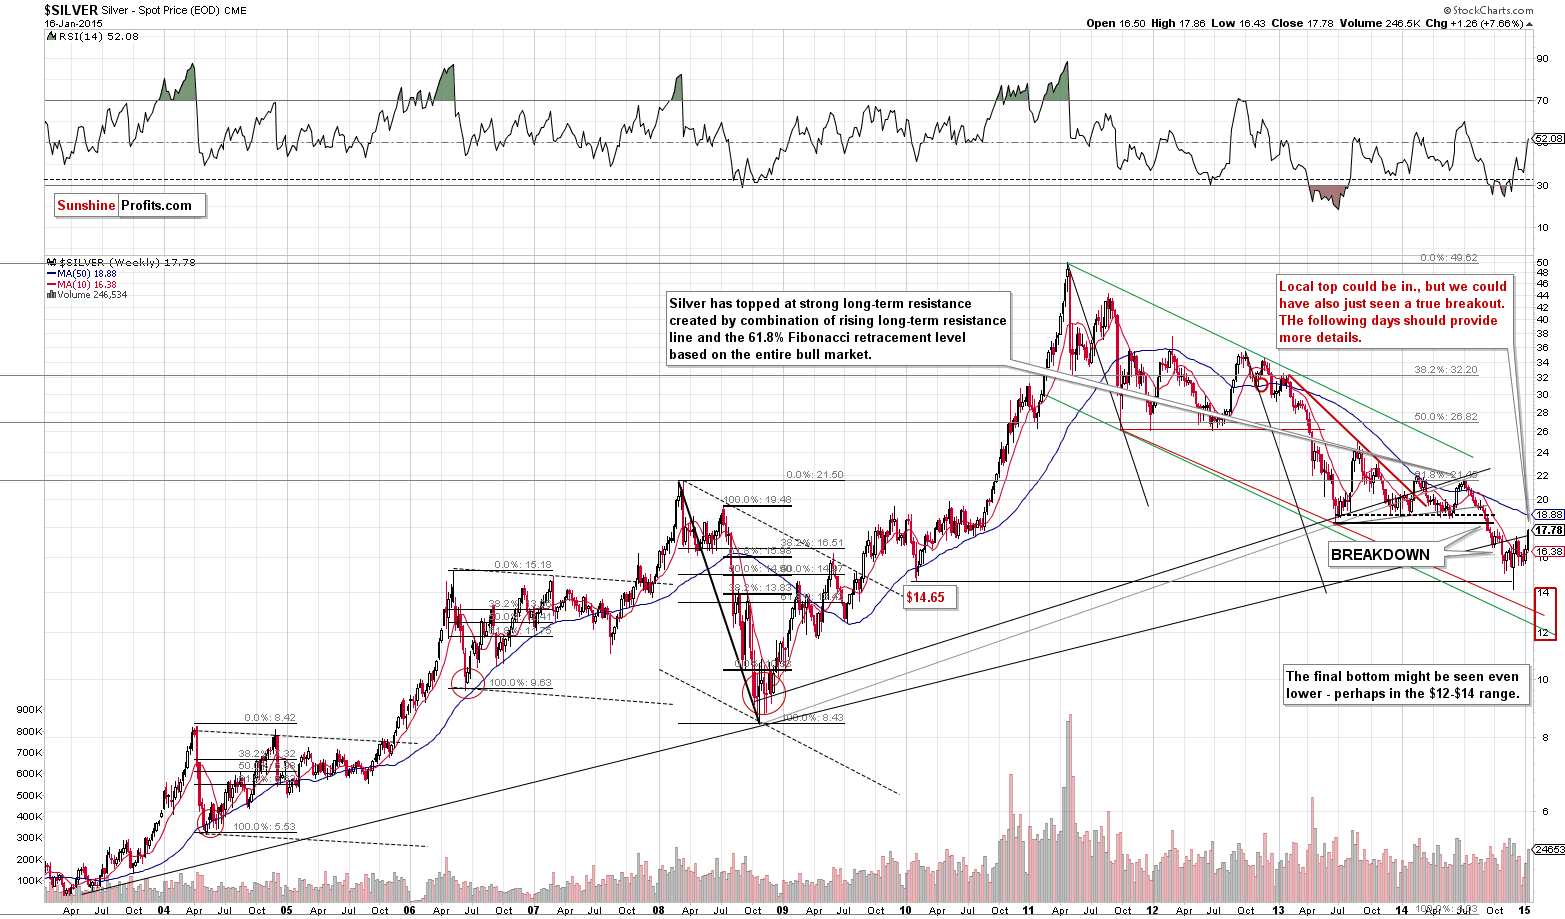
Silver moved back slightly above the very long-term, rising resistance line, which seems bullish, but let’s keep in mind that silver tends to “fake out” instead of “breaking out”. Breakouts are often signs of a looming decline, which makes us skeptical toward this “traditionally bullish” development.
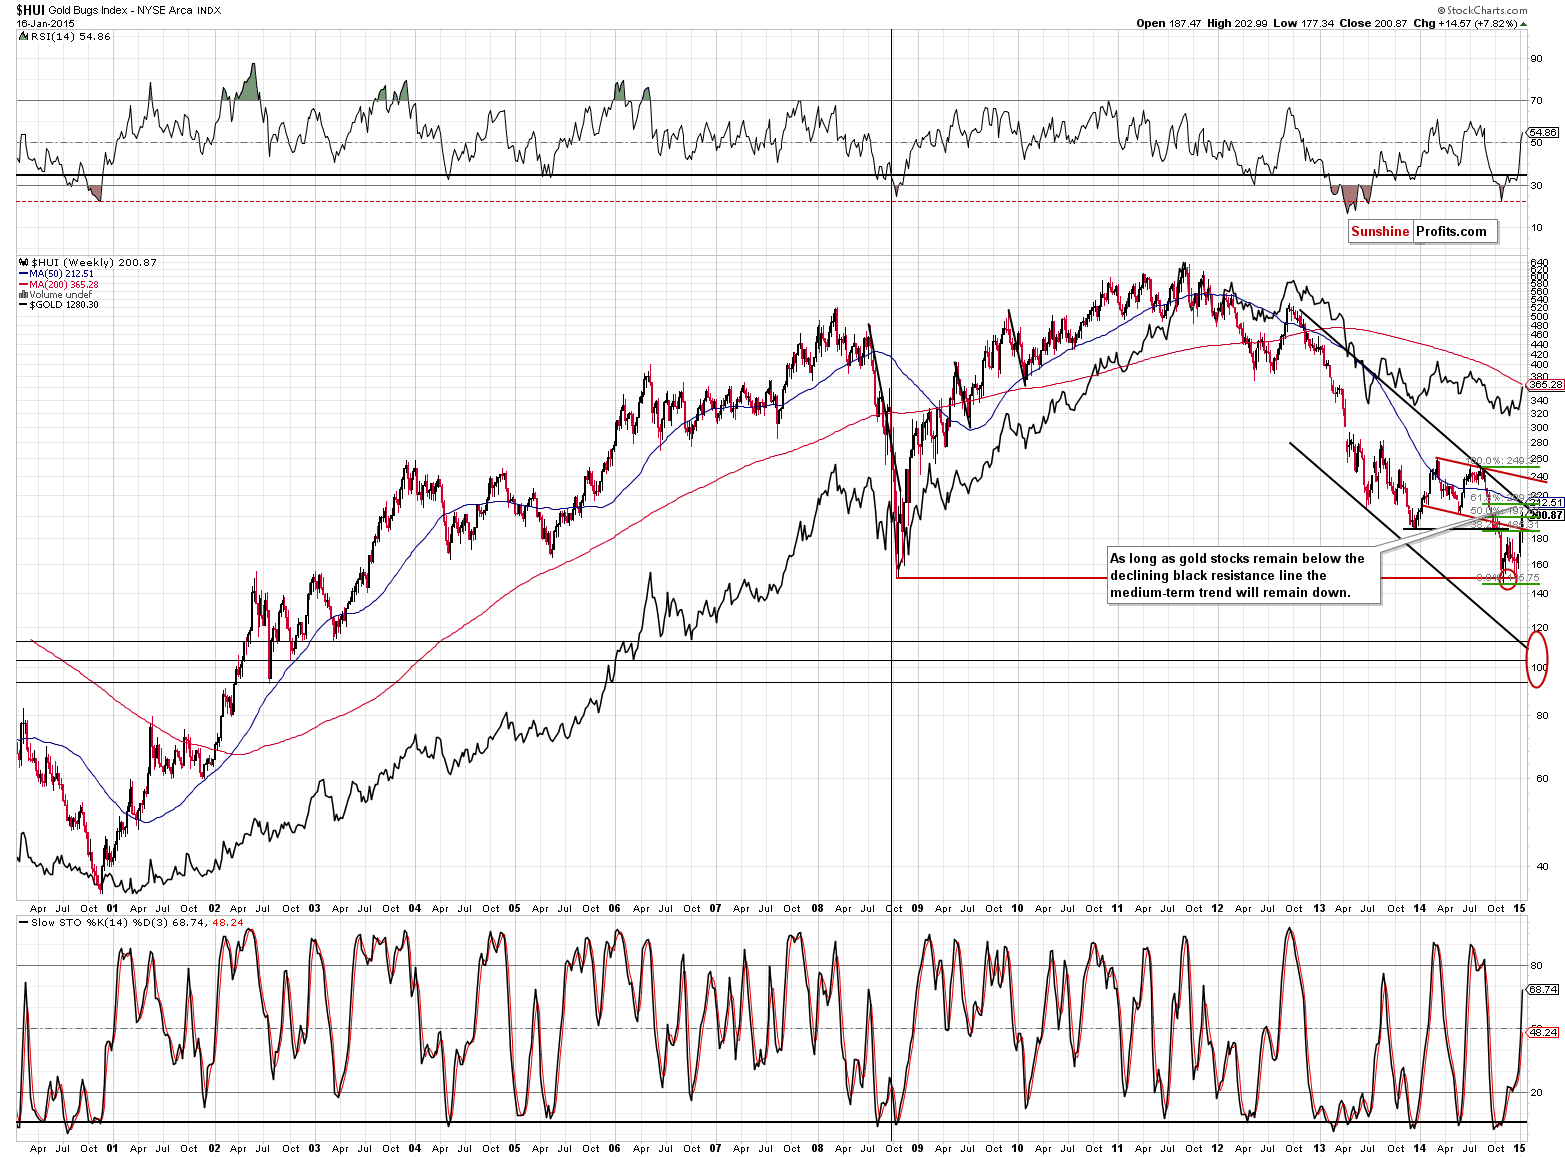
Gold stocks corrected about half of their recent decline, but the strongest resistance was not reached. The 3 important resistance levels intersect close to the 210 level: the 61.8% Fibonacci retracement, the 50-week moving average, and – most importantly – the declining long-term resistance line. If gold stocks manage to break and confirm the breakout above this level, it might serve as a confirmation that another major upswing is underway. For now, the current rally looks similar to the corrections that saw in July 2013, in late-2013 to early-2014, and in June 2014.
Summing up, while there are some signs that this rally might be the beginning of another major upleg in the precious metals market, it’s still more likely than not that it’s just a correction. Gold seems to be once again responding very positively to the signs from the bond market, but if the USD Index keeps rallying, the yellow metal might give up its recent gains and decline once again. Whether it declines significantly or not, it could be the case that we’re just one decline away from the final bottom before the next major rally.
That’s the clearest thing that we can say based on the current situation in many markets. Things are not as clear regarding the very short-term outlook. Gold could decline based on the USD’s strength or simply because the short-term breakouts have not been confirmed yet. It could move higher based on the self-similar pattern that has been working very well in the recent weeks. It seems that “when in doubt, stay out” is a justified approach at this time. Things might become clearer in the coming days or weeks. We’ll keep you – our subscribers – informed.
To summarize:
Trading capital (our opinion): No positions
Long-term capital (our opinion): Half positions in gold, half positions in silver, half position in platinum and half position in mining stocks.
Insurance capital (our opinion): Full position
Please note that a full position doesn’t mean using all of the capital for a given trade. You will find details on our thoughts on gold portfolio structuring in the Key Insights section on our website.
As a reminder – “initial target price” means exactly that – an “initial” one, it’s not a price level at which we suggest closing positions. If this becomes the case (like it did in the previous trade) we will refer to these levels as levels of exit orders (exactly as we’ve done previously). Stop-loss levels, however, are naturally not “initial”, but something that, in our opinion, might be entered as an order.
Since it is impossible to synchronize target prices and stop-loss levels for all the ETFs and ETNs with the main markets that we provide these levels for (gold, silver and mining stocks – the GDX ETF), the stop-loss levels and target prices for other ETNs and ETF (among other: UGLD, DGLD, USLV, DSLV, NUGT, DUST, JNUG, JDST) are provided as supplementary, and not as “final”. This means that if a stop-loss or a target level is reached for any of the “additional instruments” (DGLD for instance), but not for the “main instrument” (gold in this case), we will view positions in both gold and DGLD as still open and the stop-loss for DGLD would have to be moved lower. On the other hand, if gold moves to a stop-loss level but DGLD doesn’t, then we will view both positions (in gold and DGLD) as closed. In other words, since it’s not possible to be 100% certain that each related instrument moves to a given level when the underlying instrument does, we can’t provide levels that would be binding. The levels that we do provide are our best estimate of the levels that will correspond to the levels in the underlying assets, but it will be the underlying assets that one will need to focus on regarding the sings pointing to closing a given position or keeping it open. We might adjust the levels in the “additional instruments” without adjusting the levels in the “main instruments”, which will simply mean that we have improved our estimation of these levels, not that we changed our outlook on the markets. We are already working on a tool that would update these levels on a daily basis for the most popular ETFs, ETNs and individual mining stocks.
Our preferred ways to invest in and to trade gold along with the reasoning can be found in the how to buy gold section. Additionally, our preferred ETFs and ETNs can be found in our Gold & Silver ETF Ranking.
As always, we'll keep you - our subscribers - updated should our views on the market change. We will continue to send out Gold & Silver Trading Alerts on each trading day and we will send additional Alerts whenever appropriate.
The trading position presented above is the netted version of positions based on subjective signals (opinion) from your Editor, and the automated tools (SP Indicators and the upcoming self-similarity-based tool).
As a reminder, Gold & Silver Trading Alerts are posted before or on each trading day (we usually post them before the opening bell, but we don't promise doing that each day). If there's anything urgent, we will send you an additional small alert before posting the main one.
Would you like to stay updated on our free alerts (like the one that you've just read)? Sign up for our free mailing list today - it will take just a few seconds and you can unsubscribe just as easily.
Thank you.
Sincerely,
Przemyslaw Radomski, CFA
Founder, Editor-in-chief
Gold & Silver Trading Alerts
Forex Trading Alerts
Oil Investment Updates
Oil Trading Alerts
