
Forex Trading Alert originally sent to subscribers on April 1, 2014, 7:55 AM.
Earlier today, the U.S. currency moved higher against the British pound after data showed that U.K. manufacturing PMI fell to an eight-month low of 55.3 in March (from 56.2 in February), while analysts had expected an increase to 56.7. Meanwhile, the U.S. dollar declined against its Australian counterpart after the Reserve Bank of Australia left interest rates unchanged. Will today’s U.S. economic reports support the greenback later in the trading day? Before we know the answer to this question, let’s take a look at the current situation in major currency pairs. We invite you to read our today's Forex Trading Alert.
In our opinion the following forex trading positions are justified - summary:
EUR/USD
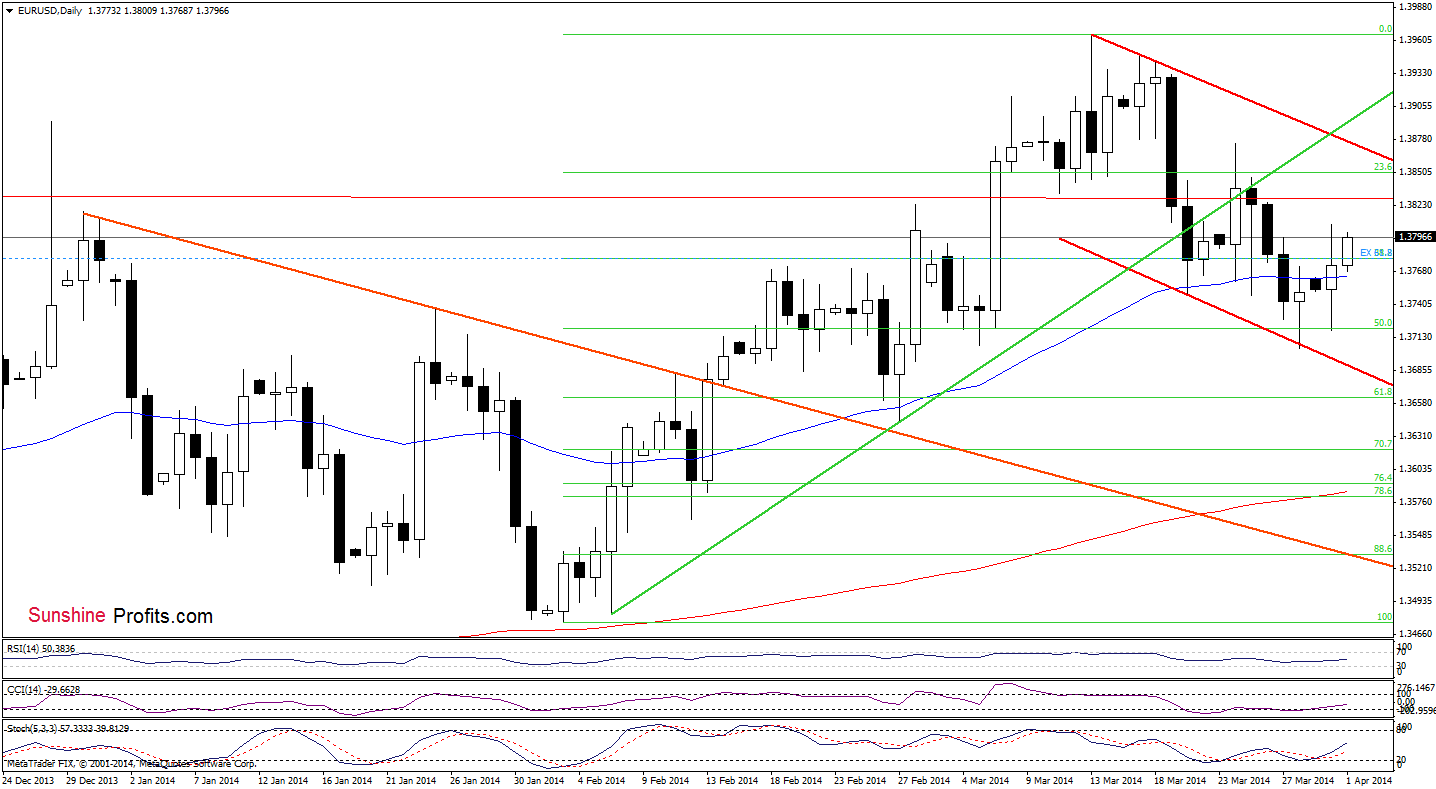
On the above chart, we see that the situation hasn’t changed much as EUR/USD remains between yesterday’s high and low. Therefore, what we wrote in our last Forex Trading Alert is still valid.
(…) EUR/USD bounced off the 50% Fibonacci retracement and came back above the 50-day moving average. (…) the CCI and Stochastic Oscillator generated buy signals, which suggests further improvement in the coming days.
However, before we summarize this currency pair, let’s take a look at the 4-hour chart below and find out what could happen later in the day.
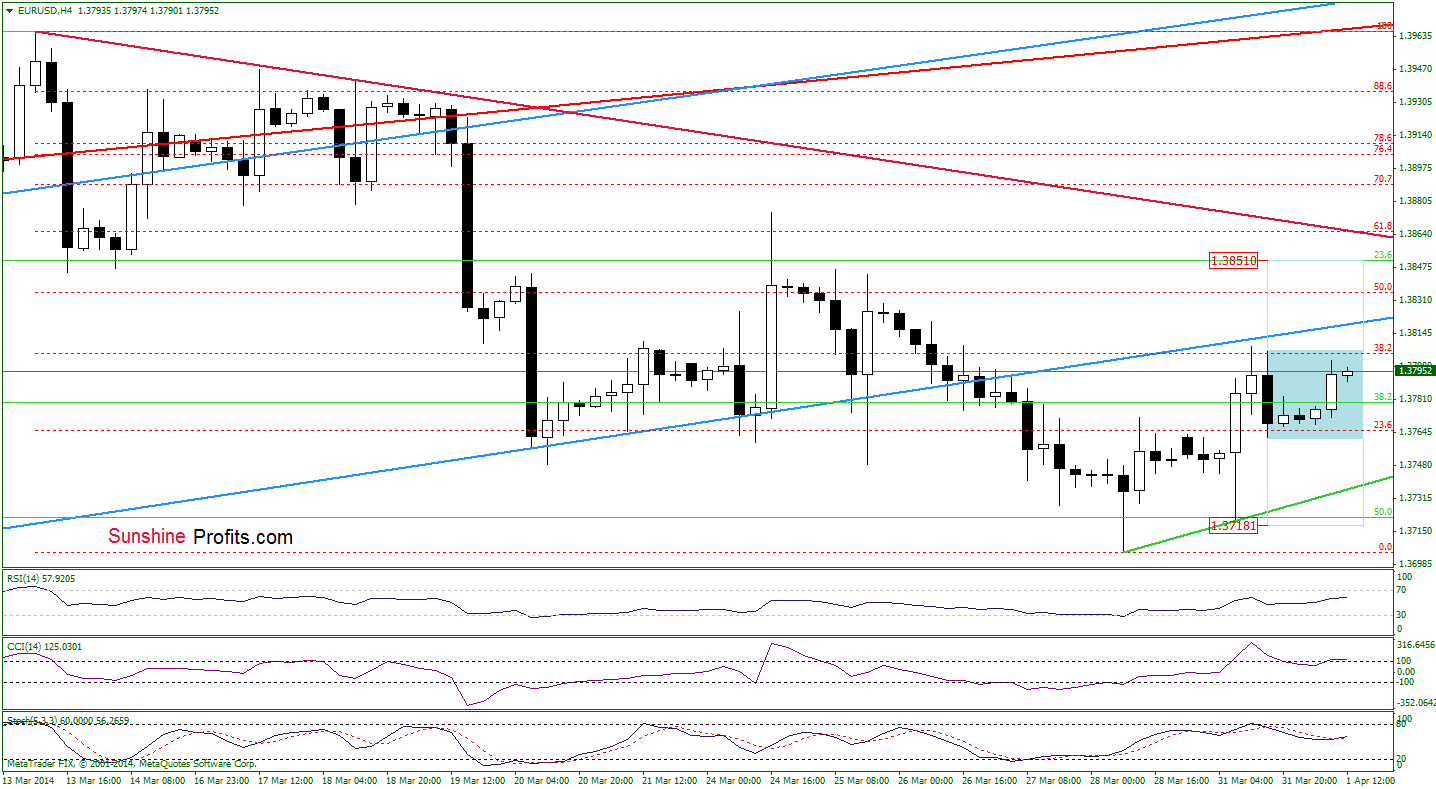
From this perspective, we see that the pair remains in a consolidation below the 38.2% Fibonacci retracement and the previously-broken lower border of the blue rising trend channel. If the exchange rate extends gains and broke above this resistance zone, we will likely see further improvement and the initial upside target will e around 1.3851 (slightly below the declining resistance line based on the March 13 and March 18 highs). On the other hand, if the buyers fail and EUR/USD declines below yesterday’s low, we will likely see a pullback to the green support line based on the recent lows (currently around 1.3736).
Very short-term outlook: mixed
Short-term outlook: mixed
MT outlook: mixed
LT outlook: bearish
Trading position: In our opinion no positions are justified from the risk/reward perspective. We will keep you informed should anything change, or should we see a confirmation/invalidation of the above.
GBP/USD
Quoting our last Forex Trading Alert:
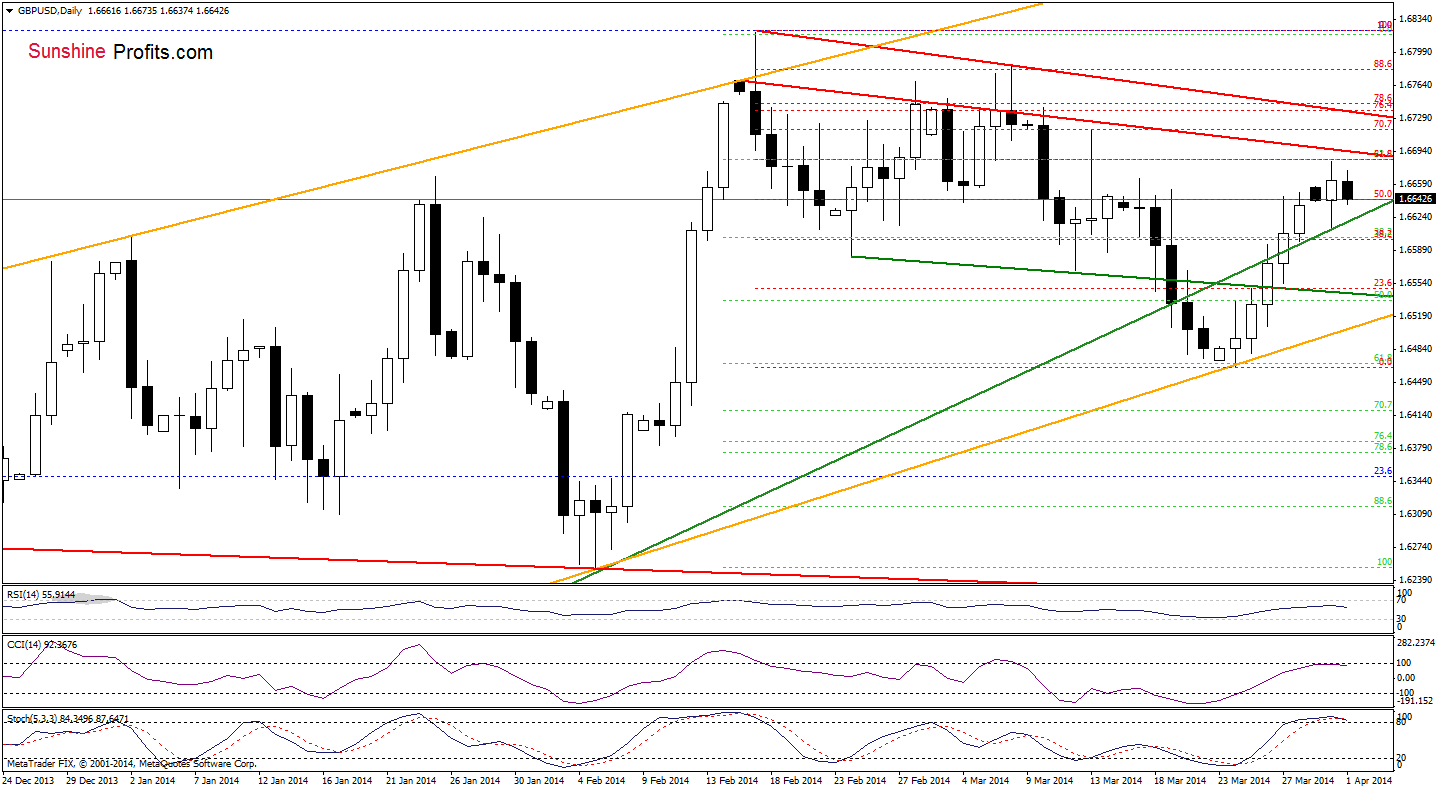
(…) the exchange rate approached a strong resistance zone created by the 61.8% Fibonacci retracement and the red declining resistance line. If this area encourages the sellers to act, we will likely see a pullback in the coming day (or days).
Earlier today, we noticed such price action as GBP/USD gave up some gains and declined. Despite this drop, the exchange rate still remains above the medium-term green support line, which is a positive signal. Nevertheless, we should keep in mind that the current position of the indicators (the CCI and Stochastic Oscillator are overbought) suggests that further deterioration is just around the corner. Where the pair could decline in the near future? Will the 4-hour chart give us any clues? Let’s take a look.
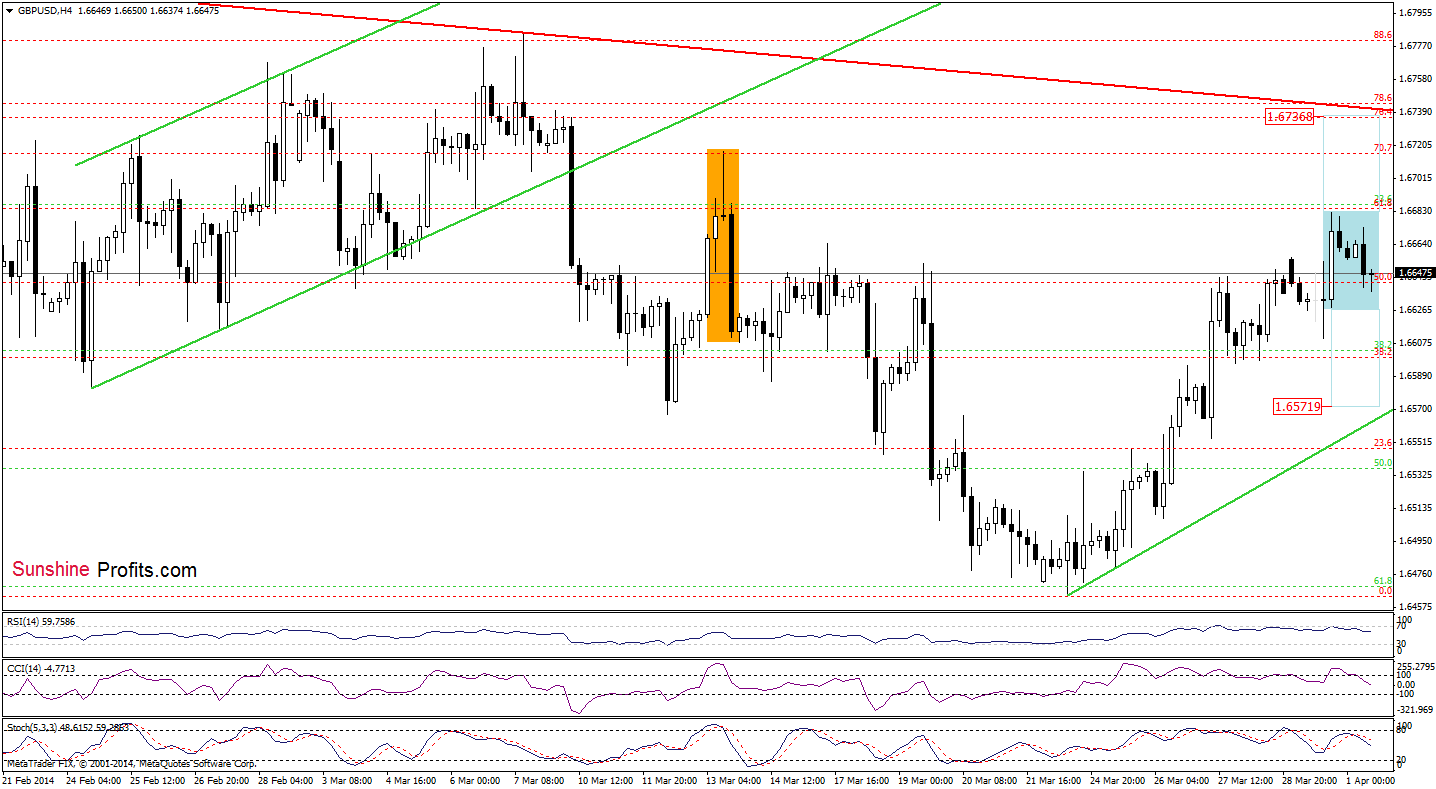
From this perspective, we see that GBP/USD remains in a consolidation. However, looking at the position of the indicators (they all generated sell signals), it seems justified to write about a bearish scenario. So, if the exchange rate declines below yesterday’s low, we may see further deterioration and the first downside target would be around 1.6572 – slightly above the very short-term rising support line (marked with green).
Very short-term outlook: mixed with bearish bias
Short-term outlook: mixed
MT outlook: mixed
LT outlook: mixed
Trading position (short-term): In our opinion no positions are justified from the risk/reward perspective at the moment. We will keep you informed should anything change, or should we see a confirmation/invalidation of the above.
USD/JPY
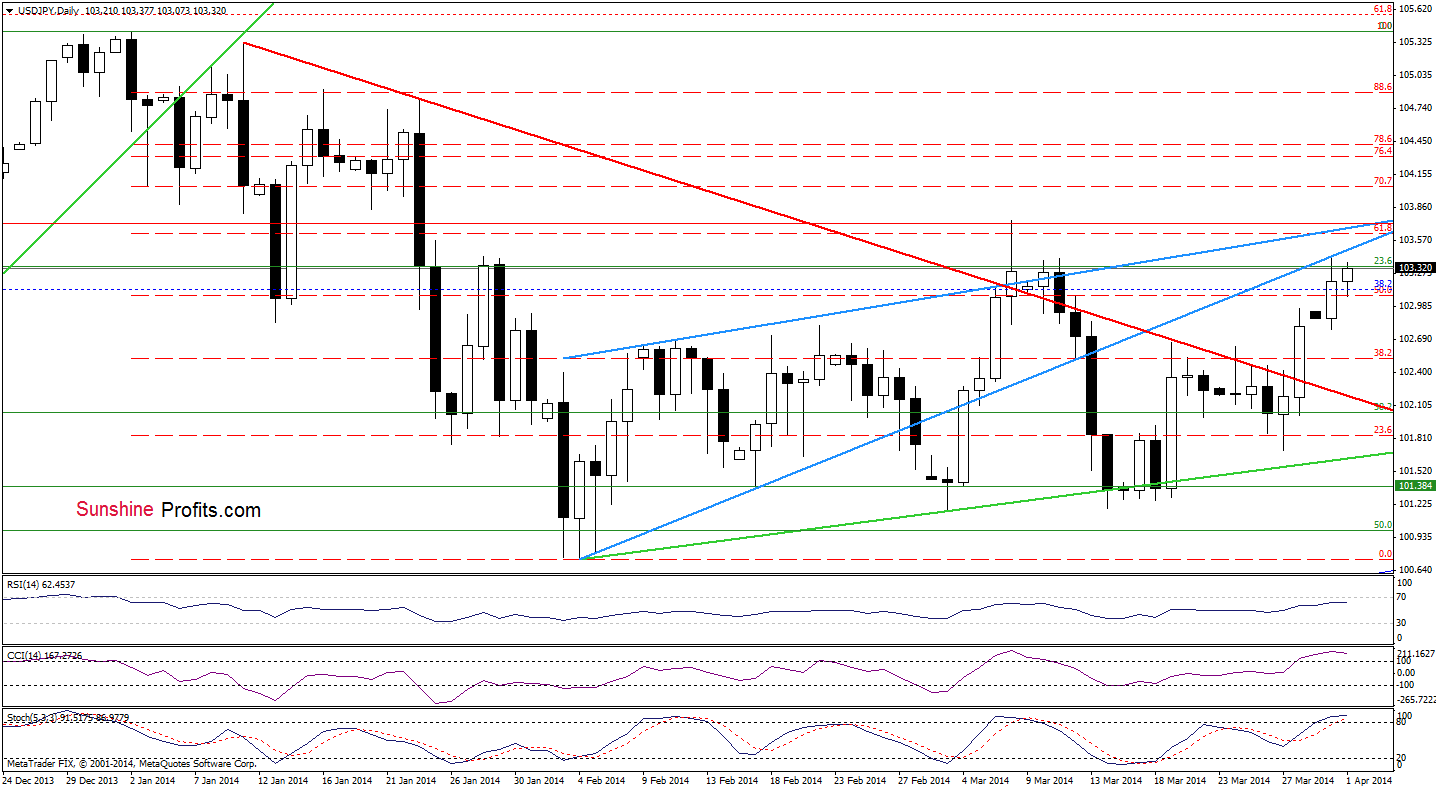
As you see on the above chart, the situation hasn’t changed much as USD/JPY remains between yesterday’s high and low. Therefore, what we wrote in our last Forex Trading Alert is still up-to-date.
(…) USD/JPY extended gains and (…) climbed to the previously-broken lower line of the blue rising wedge. If this resistance encourages the sellers to act, we will likely see a pullback to the March 19 high. However, if it is broken, we may see an increase to a strong resistance zone created by the 61.8% Fibonacci retracement, the upper line of the blue rising wedge and the March 7 high. Looking at the current position of the indicators, we see that the CCI and Stochastic Oscillator are overbought, which suggests that the space for further growth seems to be limited.
Very short-term outlook: mixed
Short-term outlook: mixed
MT outlook: bullish
LT outlook: bearish
Trading position (short-term): In our opinion no positions are justified from the risk/reward perspective at the moment. We will keep you informed should anything change, or should we see a confirmation/invalidation of the above.
USD/CAD
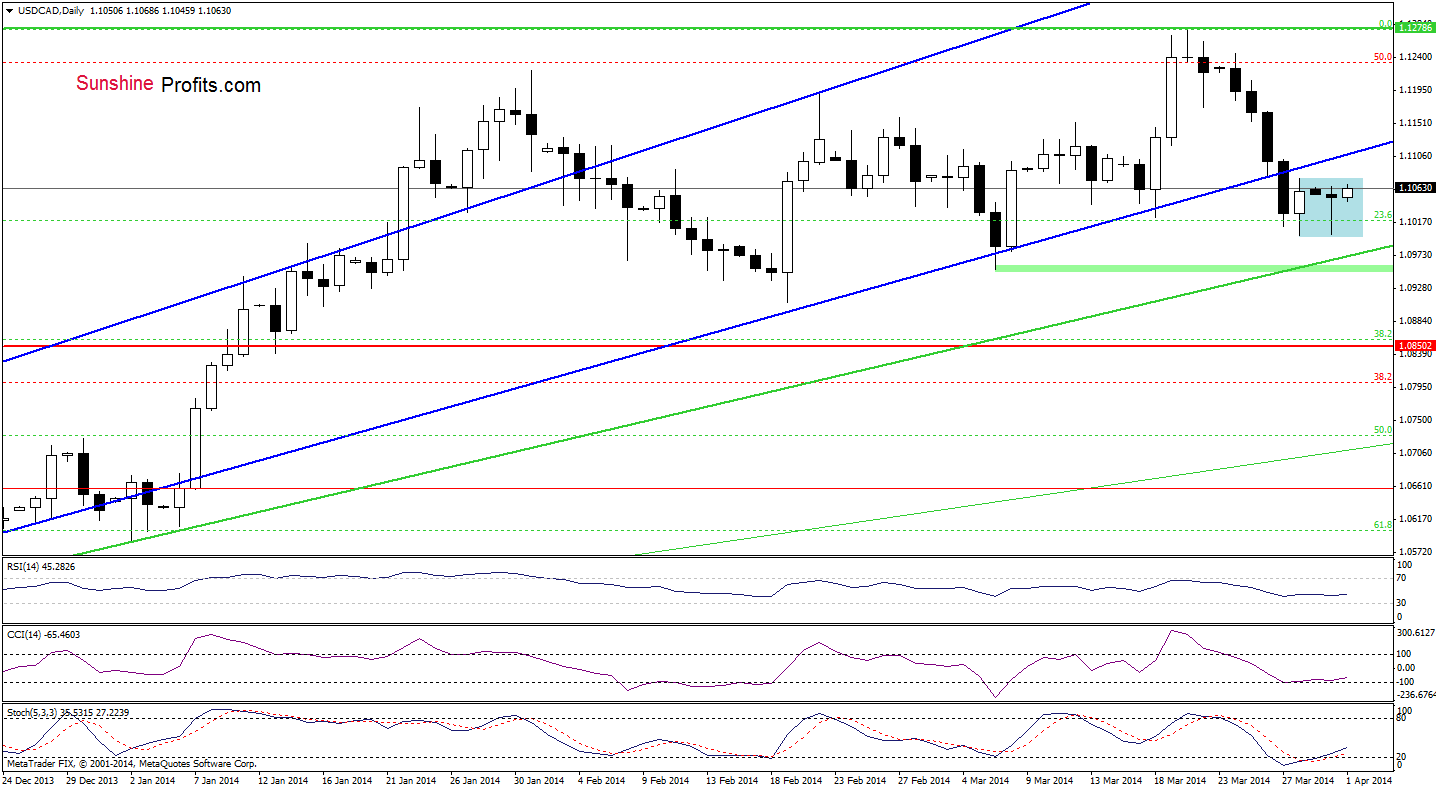
As you see on the above chart, the situation hasn’t changed much as USD/CAD remains in a consolidation between Friday’s high and low. Therefore, what we wrote in our last Forex Trading Alert is still up-to-date.
(…) If the pair extends gains, we will likely see another attempt to reach the previously-broken lower border of the rising trend channel. Please note that even if the exchange rate drops below Friday’s low, the medium-term green support line will likely stop further deterioration. At this point, it’s worth noting that the CCI and Stochastic Oscillator generated buy signals, which reinforces a pro growth scenario.
Before we summarize this currency pair, let’s take a look at the 4-hour chart.
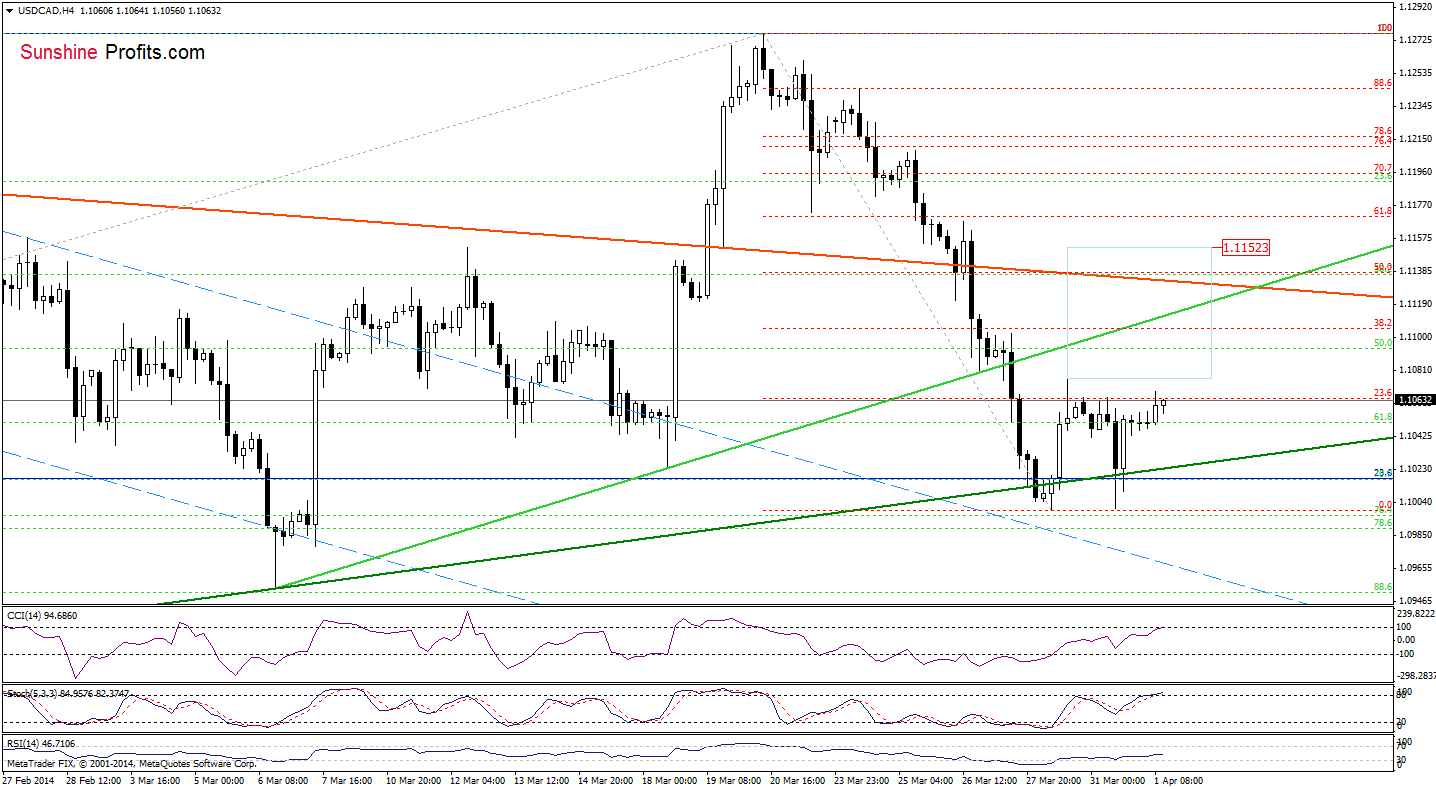
From this perspective, we see that the pair is slightly below Friday’s high. On one hand, if this resistance level encourages sellers to act, we may see a pullback to the rising support line (marked with dark green). On the other hand, if it is broken, we may see a post double bottom ray. In this case, the upside target would be around 1.1152. However, looking at the current position of the indicators (the CCI and Stochastic Oscillator are overbought), it seems that a bearish scenario is more likely to be seen later in the day.
Very short-term outlook: mixed with bullish bias
Short-term outlook: mixed
MT outlook: bullish
LT outlook: bearish
Trading position (short-term): In our opinion no positions are justified from the risk/reward perspective. We will keep you informed should anything change, or should we see a confirmation/invalidation of the above.
USD/CHF
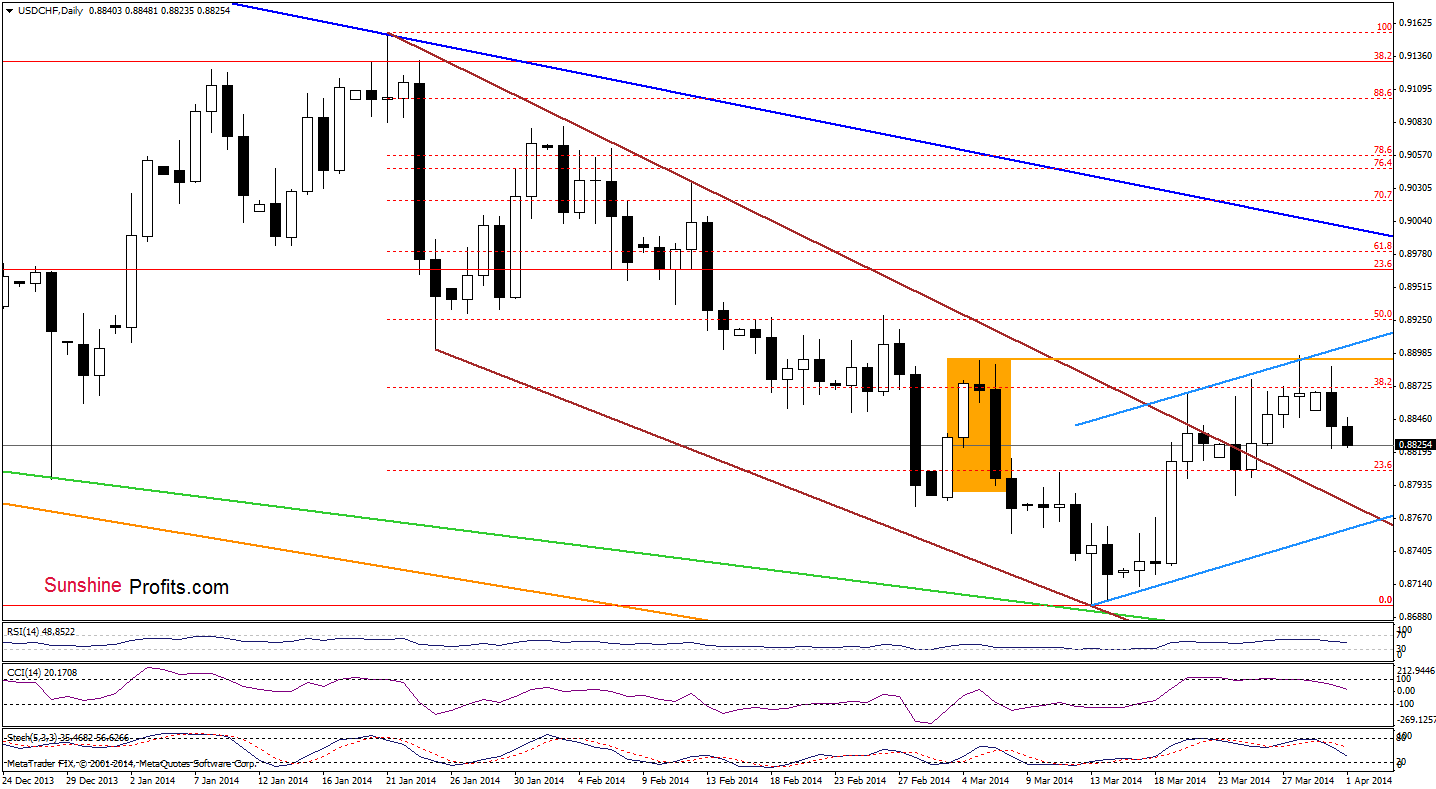
As you see on the above chart, the situation hasn’t changed much as USD/CHF remains between yesterday’s high and low. However, taking into account the current position of the indicators, it seems that further deterioration is likely to be seen. Where the exchange rate could drop in the near future? Let’s take a look at the 4-hour chart.
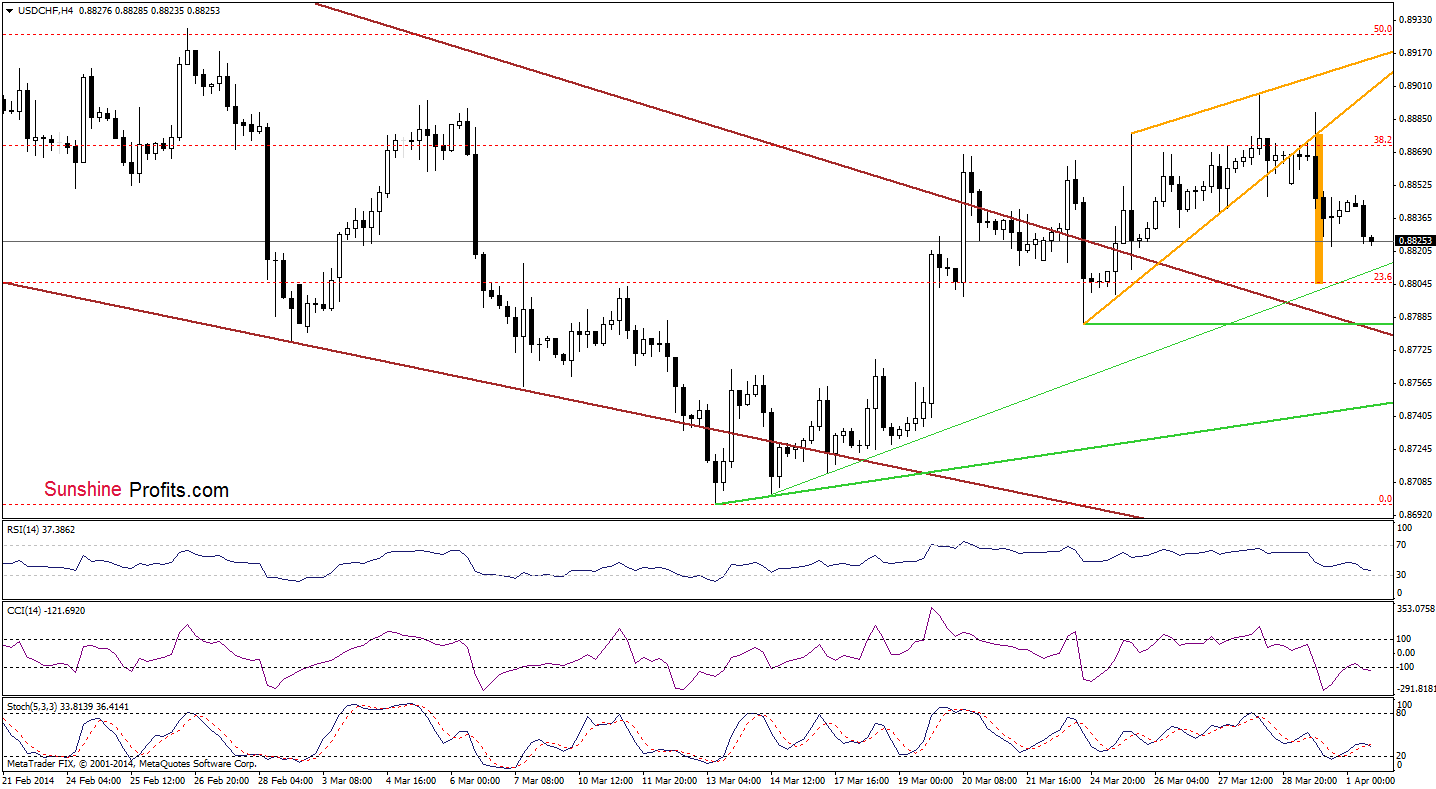
From this perspective, we see that the exchange rate paused after a breakdown below the lower line of the rising wedge (marked with orange) yesterday. However, if the pair drops below yesterday’s low, we will see a decline to the very short-term support line (marked with green). Nevertheless, we should keep in mind that according to theory, the downside target is around 0.8805 – slightly below this line. Please note that if this area doesn’t stop sellers, the next downside target will be the short-term brown declining line, which is currently slightly below the March 24 low.
Very short-term outlook: bearish
Short-term outlook: mixed with bearish bias
MT outlook: bearish
LT outlook: bearish
Trading position (short-term): In our opinion no positions are justified from the risk/reward perspective. We will keep you informed should anything change, or should we see a confirmation/invalidation of the above.
AUD/USD
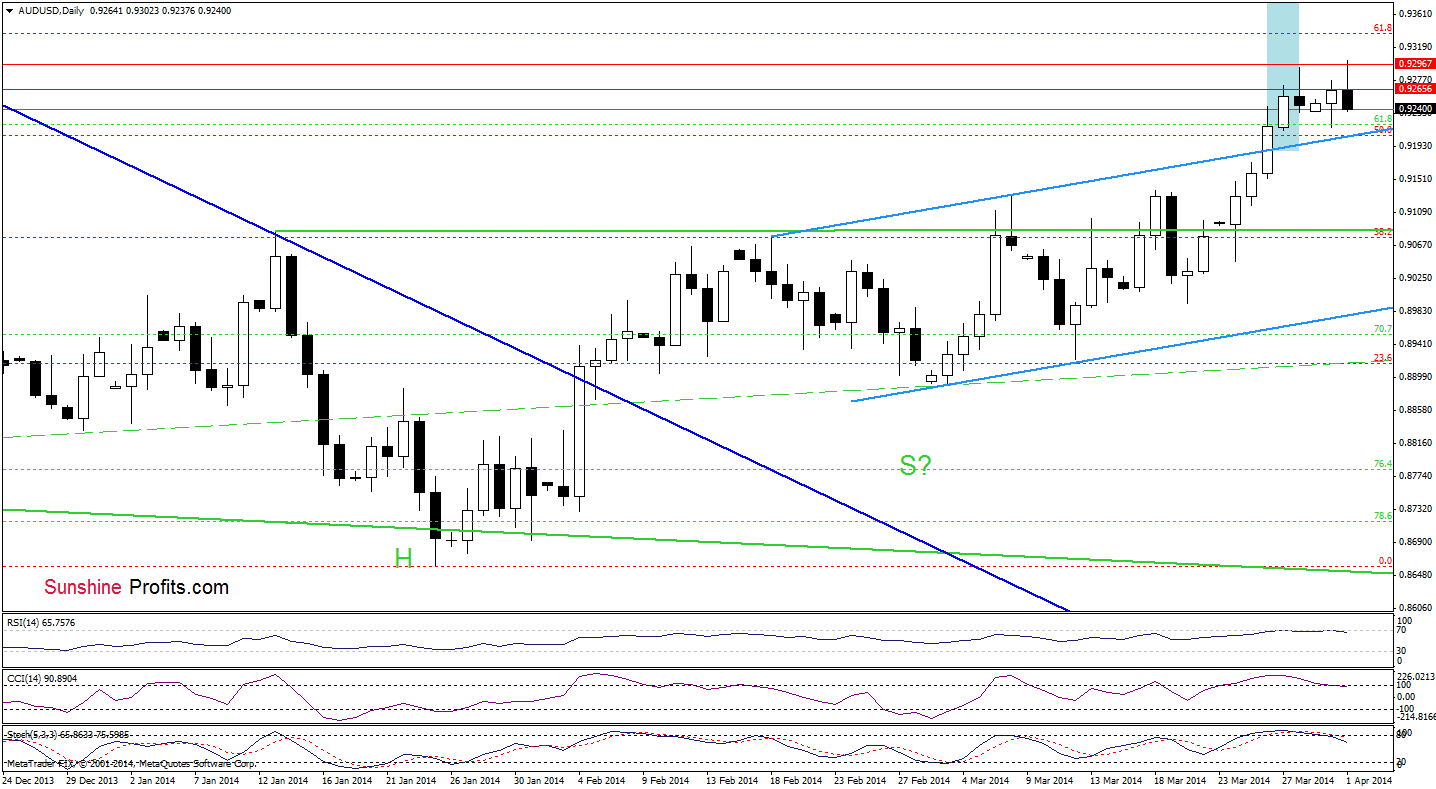
Looking at the above chart, we see that although AUD/USD extended gains and hit a fresh 2014 high, a resistance zone created by lows from mid-November stopped further improvement and the pair reversed. As you see on the daily chart, despite this drop, the exchange rate still remains above the previously-broken upper line of the trend channel. However, taking into account the fact that all indicators generated sell signals, it seems that we may see an attempt to break below the upper line of the trend channel later in the day. If this is the case, the first downside target will be around March 7 high (0.9132).
Very short-term outlook: mixed with bearish bias
Short-term outlook: bullish
MT outlook: bearish
LT outlook: bearish
Trading position (short-term; our opinion): In our opinion no positions are justified from the risk/reward perspective at the moment. However, if the pair drops below the upper line of the trend channel, we will consider opening short positions. We will keep you informed should anything change, or should we see a confirmation/invalidation of the above.
Thank you.
Nadia Simmons
Forex & Oil Trading Strategist
Forex Trading Alerts
Oil Investment Updates
Oil Trading Alerts
