
Based on the November 19th, 2013 Oil Investment Update
In our essay on oil stocks from Nov. 14, we focused on the connection between the XOI and the general stock market to find out what impact the S&P500 index could have on the oil stock index’s future moves. Back then, we also wrote about the relationship between the oil stocks and crude oil:
(…) crude oil has remained in the narrow range, but yesterday it climbed above $95. What’s interesting, at the same time the XOI increased slightly above an important resistance. Although they moved in the same direction after weeks of negative correlation, this positive correlation might be just another temporary phenomenon – especially when we factor in the weekly outlook.
Taking the above into account, we’ve decided to comment on the relationship between them. Let’s take a look at the chart below (charts courtesy by http://stockcharts.com).
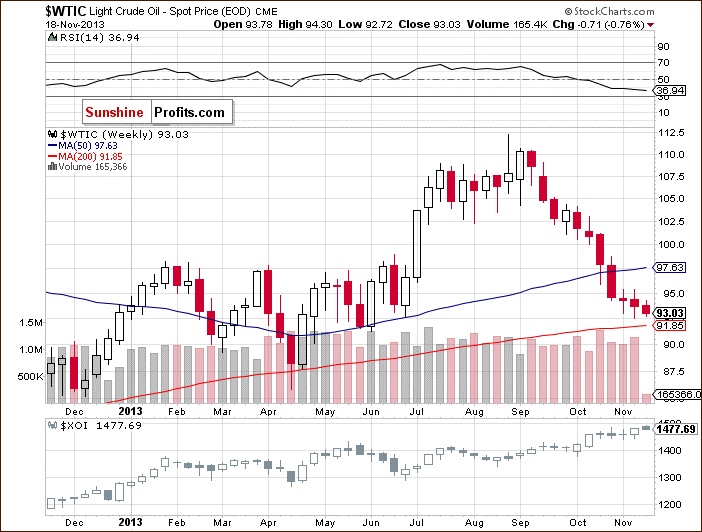
When we take a look at the above chart and compare the price action in both cases, we clearly see that oil stocks were stronger in the previous week. They bounced off the bottom of the recent corrective move, pulled back and approached the 2013 high on Friday. What happened with the price of crude oil at the same time? Light crude declined once again and reached a new monthly low of $92.51. On top of that, on Monday the oil stock index climbed up once again and hit a fresh annual high. Meanwhile, crude oil lost almost 1% and declined to slightly above the November low. This price action clearly showed its weakness in relation to oil stocks.
Once we know the current relationship between crude oil and oil stocks, let’s take a closer look at the oil-stocks-to-oil ratio. Today, we begin with the long-term chart.

The first thing that catches the eye on the above chart is a strong negative correlation between the ratio and the price of light crude. When we go back to 2008, we clearly see that the annual high in crude oil was in perfect tune with the ratio’s 2008 low. We could see this strong reltionship also in 2009, when the annual low in crude oil corresponded to the ratio’s 2009 high (marked with a red ellipse). In the following months, the ratio declined heavily, which led to higher oil prices.
What’s interesting, the ratio’s 2010 high was in tune with the bottom of the corrective move that we saw in crude oil. We noticed similar price action in September 2011, May, August and October 2012, and February and May 2013.
Looking at the above chart, we see that the ratio remains in the gap between the April 2009 low and May 2009 high (marked with the red rectangle). In all previous cases, such a position of the ratio triggered a correction, which resulted in higher prices of light crude. Additionally, the ratio has approached the 38.2% Fibonacci retracement level (based on the entire 2009-2011 decline), which is a strong resistance level.
Taking the above into account, if history repeats itself once again and the ratio declines, we will likely see the bottom of the current correction.
Now, let’s zoom our picture and examine the weekly chart.
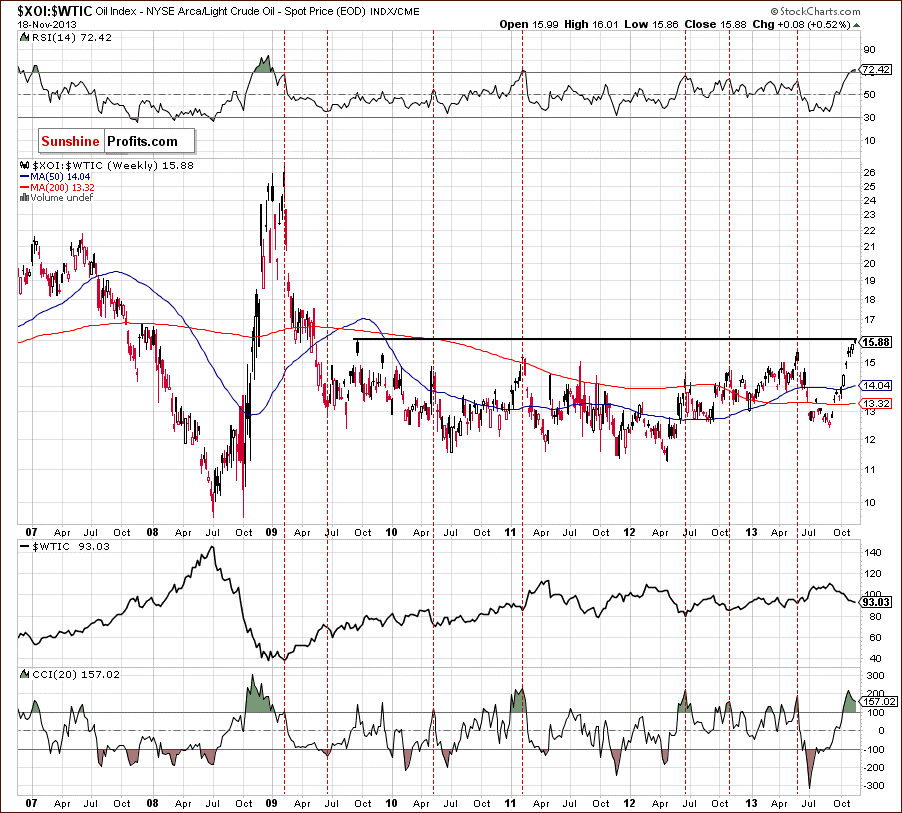
Looking at the above chart, we see the same price action - most of the ratio’s tops have corresponded to the crude oil’s lows. Additionally, the RSI has moved above the 70 level. We saw such situations in 2008, 2011 and again in 2012. Back then, such a high reading on the RSI preceded a move down in the ratio and an upward move in crude oil. If history repeats itself once again, we may see a pullback in crude oil in the near future.
When we factor in the position of the CCI, we clearly see that the indicator is extremely overbought, which is another bearish signal for the ratio.
Now, let’s check the short-term outlook.
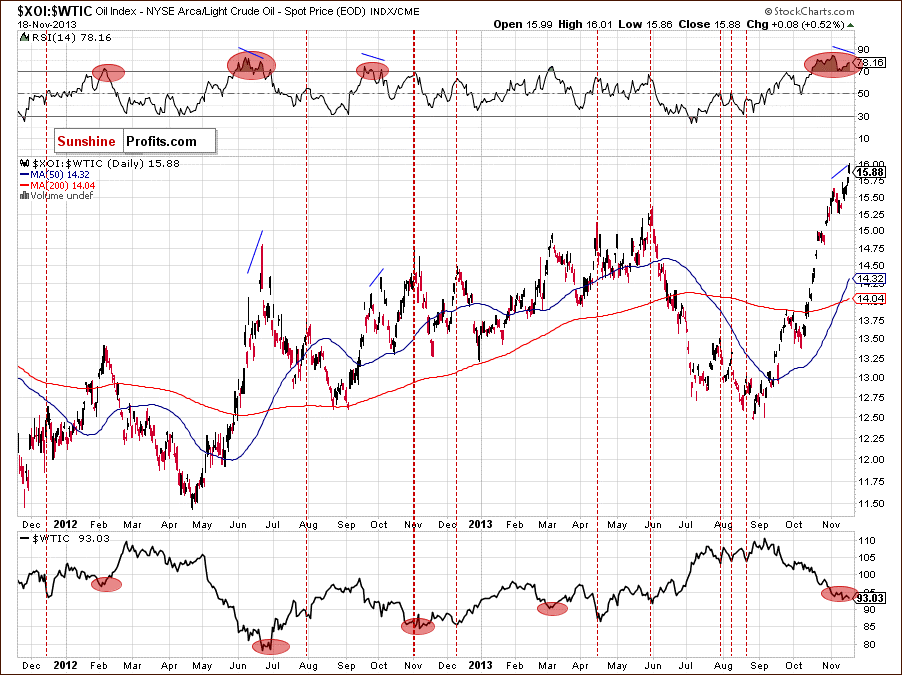
On the above chart, we see that the ratio has rallied since September, which is in perfect tune with declines in crude oil. In the recent days, the ratio has moved higher once again and hit a new 2013 high. Despite this increase, we haven’t noticed a new high in case of the RSI. When we take a closer look at the above chart, we clearly see a negative divergence between the ratio and the position of the indicator.
At this point, it’s worth mentioning that there were similar situations in the past – for example in June and October 2012. Back then, such divergences preceded declines in the ratio and had a positive impact on crude oil.
Please note that earlier this year, lower readings on the RSI triggered downswings in the ratio and indicated the bottoms of correction moves. Taking the above facts into account, we can assume that the final bottom of the current correction is just around the corner.
Summing up, the oil-stocks-to-oil ratio is oversold (not only on a short-term basis, but also from the medium-term perspective) as indicated by the RSI. Additionally, it has reached a strong resistance zone created by the gap between the April 2009 low and May 2009 high (marked with the red rectangle on the monthly chart) and reinforced by the September 2009 high, which may trigger a correction in the ratio and an upward move in crude oil in the near future.
Please note that at this time we still have a promotional offer that allows you to subscribe to my Oil Investment Updates and Oil Trading Alerts for only $1 and $2, respectively, for the first 3 weeks of service. I encourage you to subscribe today.
Thank you.
Nadia Simmons
Sunshine Profits' Crude Oil Expert
Oil Investment Updates
Oil Trading Alerts
