Moving Average
A moving average (rolling average, rolling mean, running average, MA) is the average of the closing price of a security over a specified period of time. It smoothes short-term price fluctuations, thus giving a clearer picture of the trend. The 50-day and 200-day moving averages are quite often used as support and resistance levels for gold, silver and mining stocks.
Definition
The most commonly used moving averages are: the 20-day moving average (because a month contains roughly 20 trading days), 50-day moving average (roughly 3 months) and 200-day moving average (often used by long term traders). It’s worth customizing moving averages for particular markets or even individual securities.
Moving averages can be used to determine support and resistance levels – it may be hard for the price to cross the moving average. It can also be used to determine the trend – the price of a security in a downtrend will be below its moving average and the price of a security in an uptrend, above it.
When the short-term moving average crosses from underneath the long-term moving average, this move is known as a golden cross and is considered bullish. On the other hand, when the short-term moving average crosses from above the long-term moving average, this move is called a dead cross and is considered bearish.
Simple Moving Average
In the case of a simple moving average (SMA) each price is given an equal weight. To calculate the simple 3-day moving average for example, we can use the following equation:
SMA = (p yesterday + p 2 days ago + p 3 days ago)/3
The following chart shows the 50-day moving average acting as a resistance level (chart courtesy by http://stockcharts.com).
Weighted Moving Average
A weighted moving average (WMA) gives different weights to data at different positions. WMA used in technical analysis gives weights that decrease in arithmetic progression. Thus in the case of an n-day WMA the latest day has weight n, the second latest has weight n-1, and so on.
Weighted Moving Average A weighted moving average (WMA) gives different weights to data at different positions. WMA used in technical analysis gives weights that decrease in arithmetic progression. Thus in the case of an n-day WMA the latest day has weight n, the second latest has weight n-1, and so on.
Exponential Moving Average
(Exponentially Smoothed Moving Average)
The EMA gives the greatest weight to recent prices and exponentially smaller weight to older prices.
EMA = α x (p1 + (1 – α)p2 + (1 – α)2p3 + (1 – α)3p4 + … )
where
α – represents the degree of weighting decrease.
p – represents the prices of some security.
Moving Averages - Examples
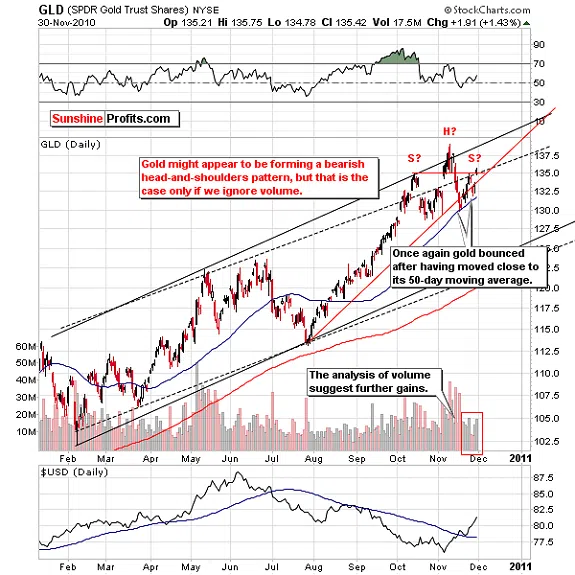
GLD Moving Average
From February to July, the moving average was a support line, but once it was breached, it started to act as a resistance line.
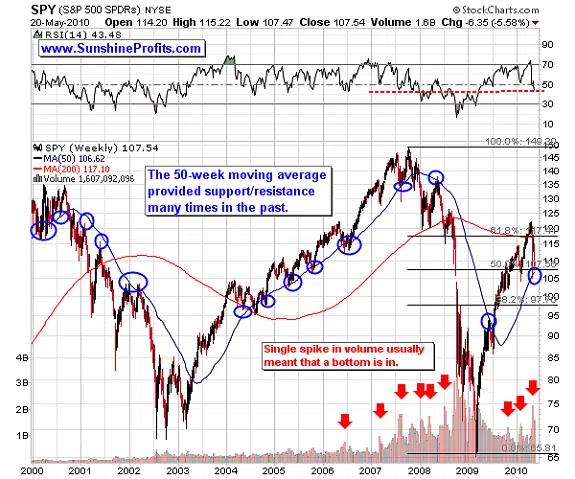
Medium Term S&P 500 Index Moving Average
On the following chart, the 200-day moving average acts as a resistance line, but once it is breached, it becomes a support line.
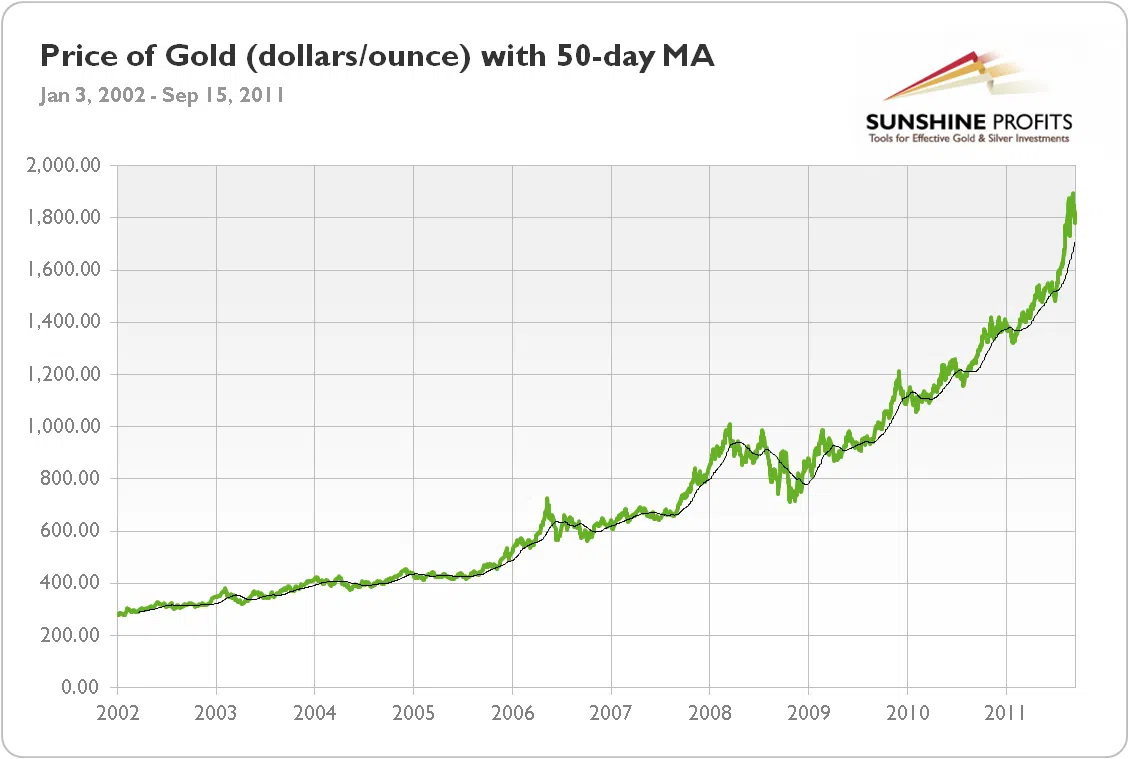
Gold Moving Average
The following chart presents the price of gold with a 50-day moving average. As you can see, a period of 50 days is too small to determine long-term trends – MA coincides with the price of gold.
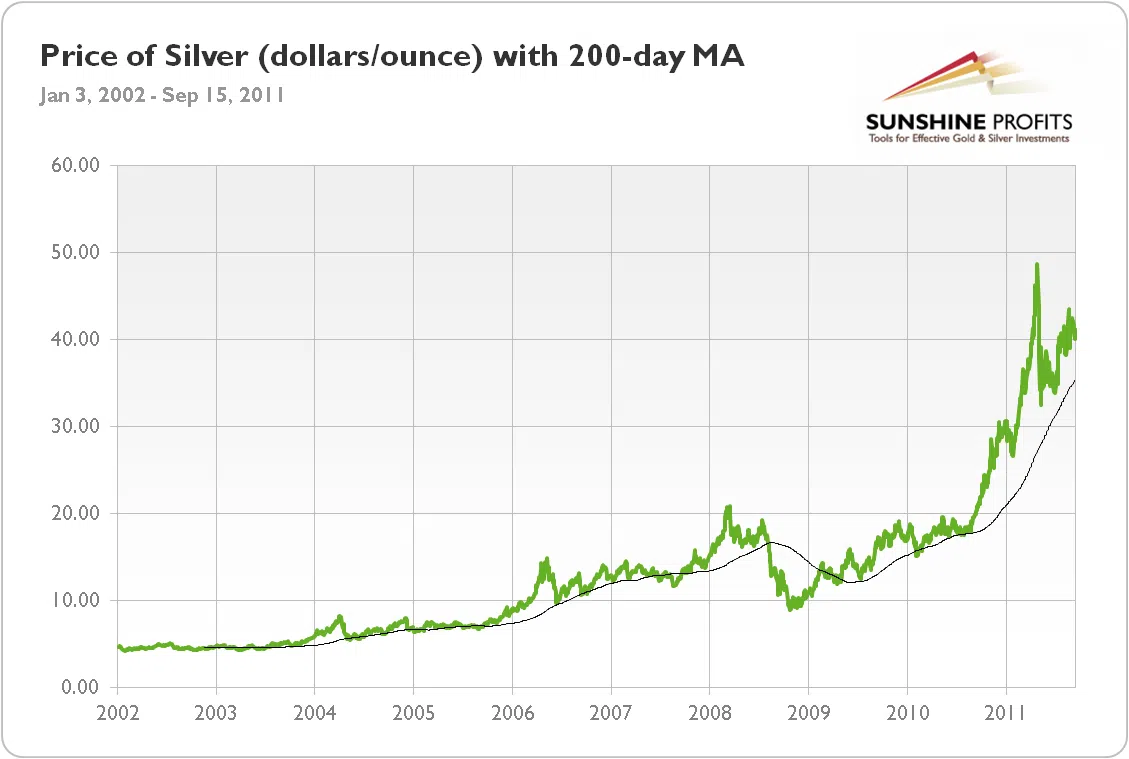
Silver Moving Average
Here, the moving average is also a support line – breaching it in the second half of 2008 caused a significant meltdown in the price of silver.
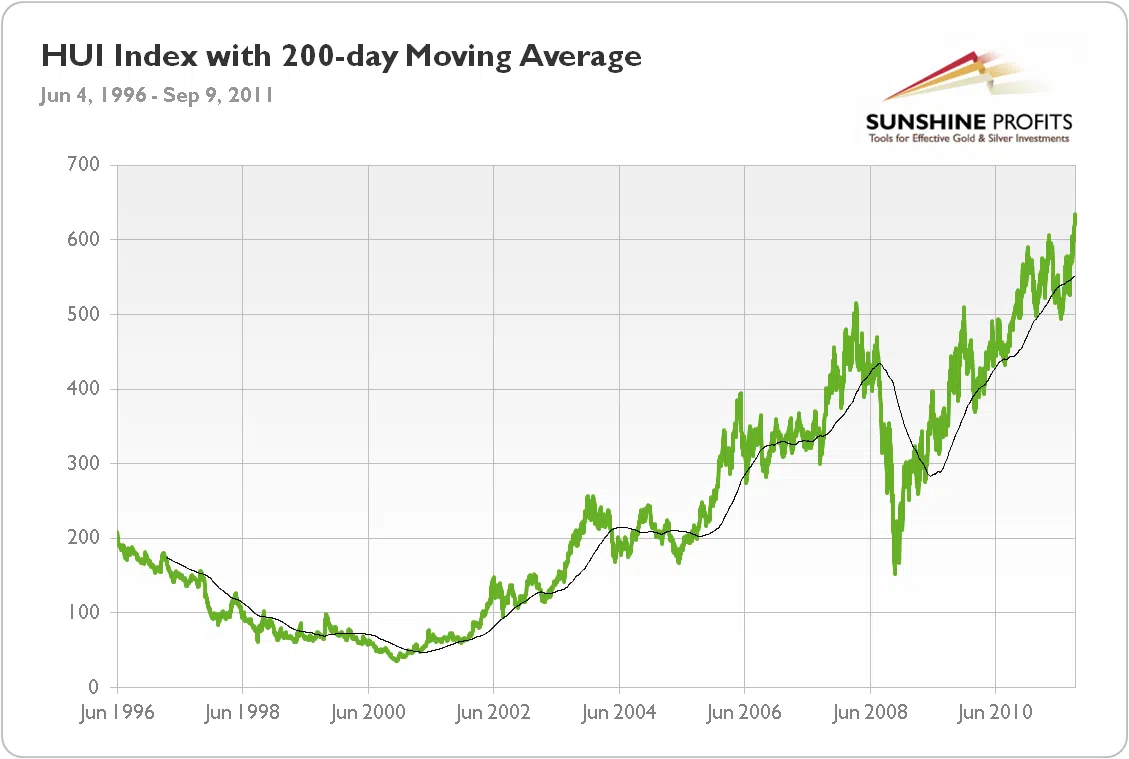
Gold Stocks Moving Average
Once the 200-day moving average was breached in late 2008, we witnessed significant decline.