
Based on the October 19th, 2012 Premium Update. Visit our archives for more gold & silver articles.
In today’s essay on the current correction in gold we would like to focus on one single question:
Is the correction in gold over?
In order to provide you with a reply to this question, we will analyze 2 charts (USD and gold) and the table that links them. Let’s start with the former one.
Let’s start with the USD Index chart (charts courtesy by http://stockcharts.com.)
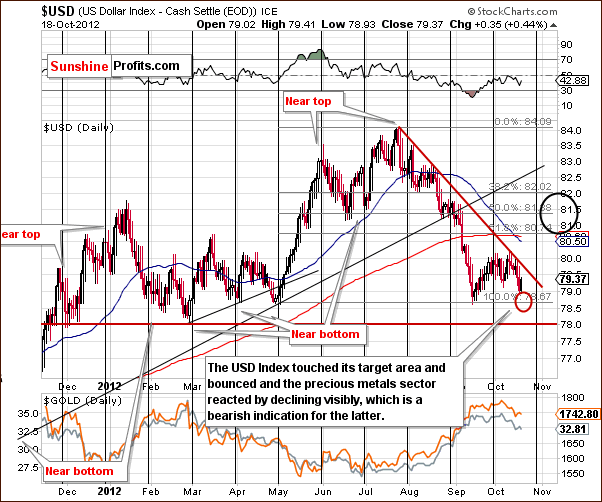
On the above chart we see that a rally appears possible as we have seen a move to the upper part of our downside target red ellipse. Another significant rally could be seen from here with a local top in late October or early November. The maximum upside target level is shown with a black ellipse – the 80.50 to 82 range.
We don’t expect major strength in the USD Index before the coming election as this could hurt the general stock market and that could cost votes.
Please take a look at the lower part of the above chart that features gold and silver and compare it to the recent performance of the USD Index. The key point here is that the recent sideways trading in the USD has resulted in lower precious metals prices – if we see more sideways trading, we can easily see more declines in the metals. If, however, the USD Index rallies (not even significantly) the metals could decline sharply. We expect this relationship to be short-lived, but still this is something that is currently in play.
Is the link between USD and gold really in place?
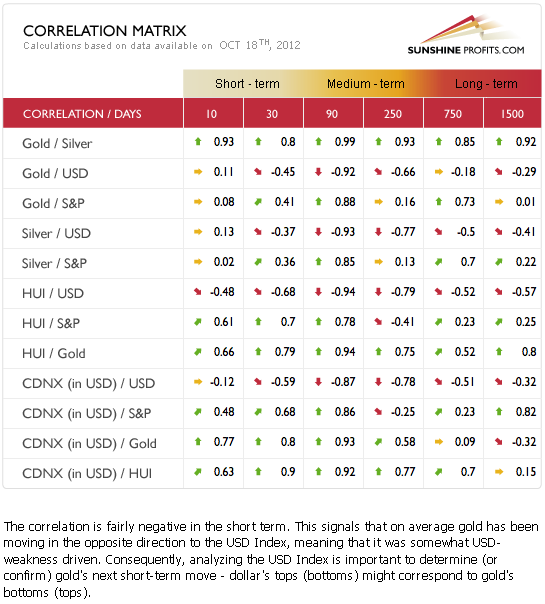
The Correlation Matrix is a tool which we have developed to analyze the impact of the currency markets and the general stock market upon the precious metals sector. The correlations (here: the above-mentioned link) have actually weakened since last week. What’s most important is the way in which they weakened.
Precious metals prices moved lower even though the USD Index did not rally and in spite of the rally seen in stocks. With these two bullish indicators in place, gold did not respond positively; this is a sign of weakness. There are clearly bearish implications going forward. This lack of reaction to the strength in stocks means that the bullish picture in the latter is not necessarily a threat to our speculative short positions in gold and silver. We are concerned but not to a point of closing them.
While the full version of this article includes gold seen from various perspectives (and it’s literally 12 times bigger than the essay that you are currently reading), we believe some important points can be made using only one of them - let’s have a look at the yellow metal from the non-USD perspective. It is a non-USD gold chart, meaning a weighted average of gold priced in different currencies, other than the USD – the weights are as in the USD Index, so this charts is similar to the one featuring gold priced in euro.
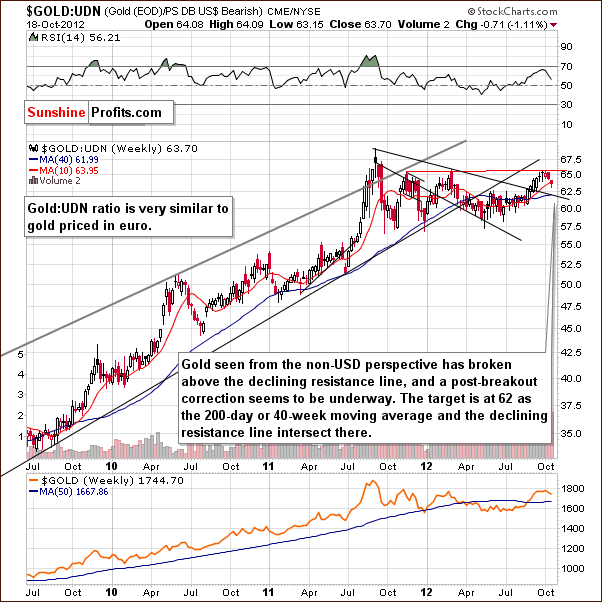
In the chart, a correction now appears to be underway with gold reaching its 2012 high, and the correction does not appear to be over yet. The 200-day moving average (blue-sloping line) has provided support in the past and it seems that it will stop the current decline as well. The declining support line based on 2011 and 2012 highs is also just a bit below Thursday’s price level. In fact these two support lines intersect at approximately 62 level and this is where we expect the decline to end. All in all, this means that the correction – seen from this perspective - is about halfway done.
Is the correction in gold over? Not likely. We will leave the reply to the "when will it be over" question to our subscribers.
Earlier today we have posted the full version of this article - today's Premium Update and it is the biggest update that we ever created (if you were waiting for a special occasion to establish a subscription with us - this might be it).
Essentially, it's like 2 updates combined: one of them with the in-depth analysis of the current situation in the precious metals market, and the other one with detailed replies to our subscribers' questions.
There was much to reply to - we received multiple questions about the precious metals market, about the upcoming elections in the US and many other ones. Here are just 3 examples:
- What should precious metals investors do with their long-term investments if Romney wins?
- Will gold plunge along with a rally in the USD?
- Can the situation in mining stocks be compared to a coiled spring?
Today's Premium Update includes up-to-date price targets for the current decline in gold, silver, and mining stocks along with corresponding probabilities (the probability for mining stocks to reach its target is different than for gold and silver...) and our additional comments about the time-frame in which the bottom will likely be seen. Our unique indicators play an important role in this estimation.
Speaking of our indicators, we are happy to inform you that we have just release a section with performance of the SP gold & silver indicators. You will find average performance of each of the indicators along with our comments and default actions that traders are to make based on them.
As we mentioned above, this seems like a very good moment to join our subscribers - you can go premium using this link.
Thank you for reading. Have a great weekend and profitable week!
Przemyslaw Radomski, CFA
Back