
Briefly: In our opinion, no speculative positions are justified.
Our intraday outlook is neutral, and our short-term outlook is neutral. Our medium-term outlook remains neutral, following S&P 500 index breakout above last year's all-time high:
Intraday outlook (next 24 hours): neutral
Short-term outlook (next 1-2 weeks): neutral
Medium-term outlook (next 1-3 months): neutral
Long-term outlook (next year): neutral
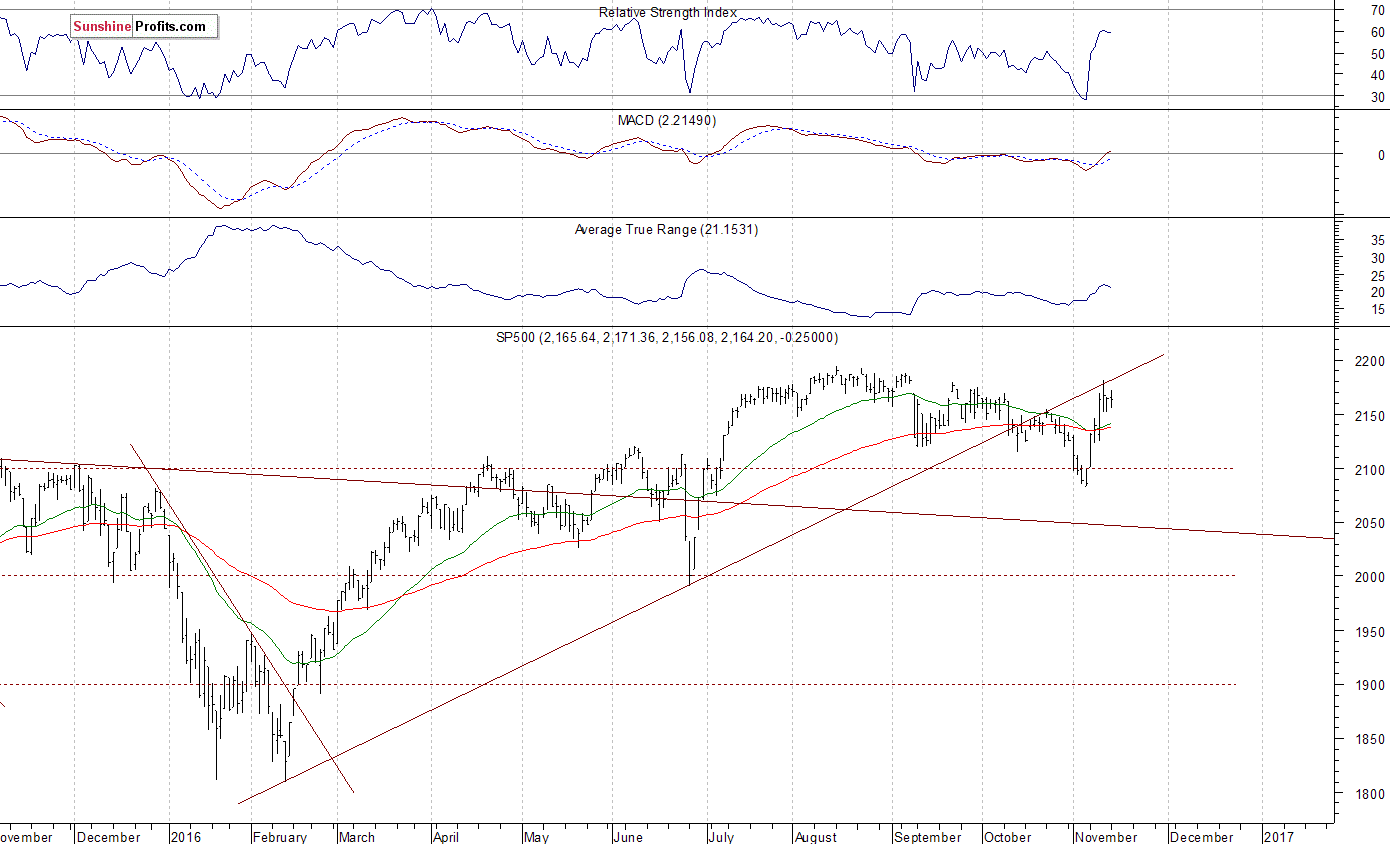
The U.S. stock market indexes were mixed between -1.1% and +0.1% on Monday, as investors continued to hesitate following recent volatility. The S&P 500 index broke above the resistance level of 2,150-2,160 recently. The next resistance level is at 2,180-2,200, marked by record high. On the other hand, support level is at 2,100-2,120, marked by previous resistance level. The next important level of support remains at around 2,080, marked by recent local lows, as we can see on the daily chart:
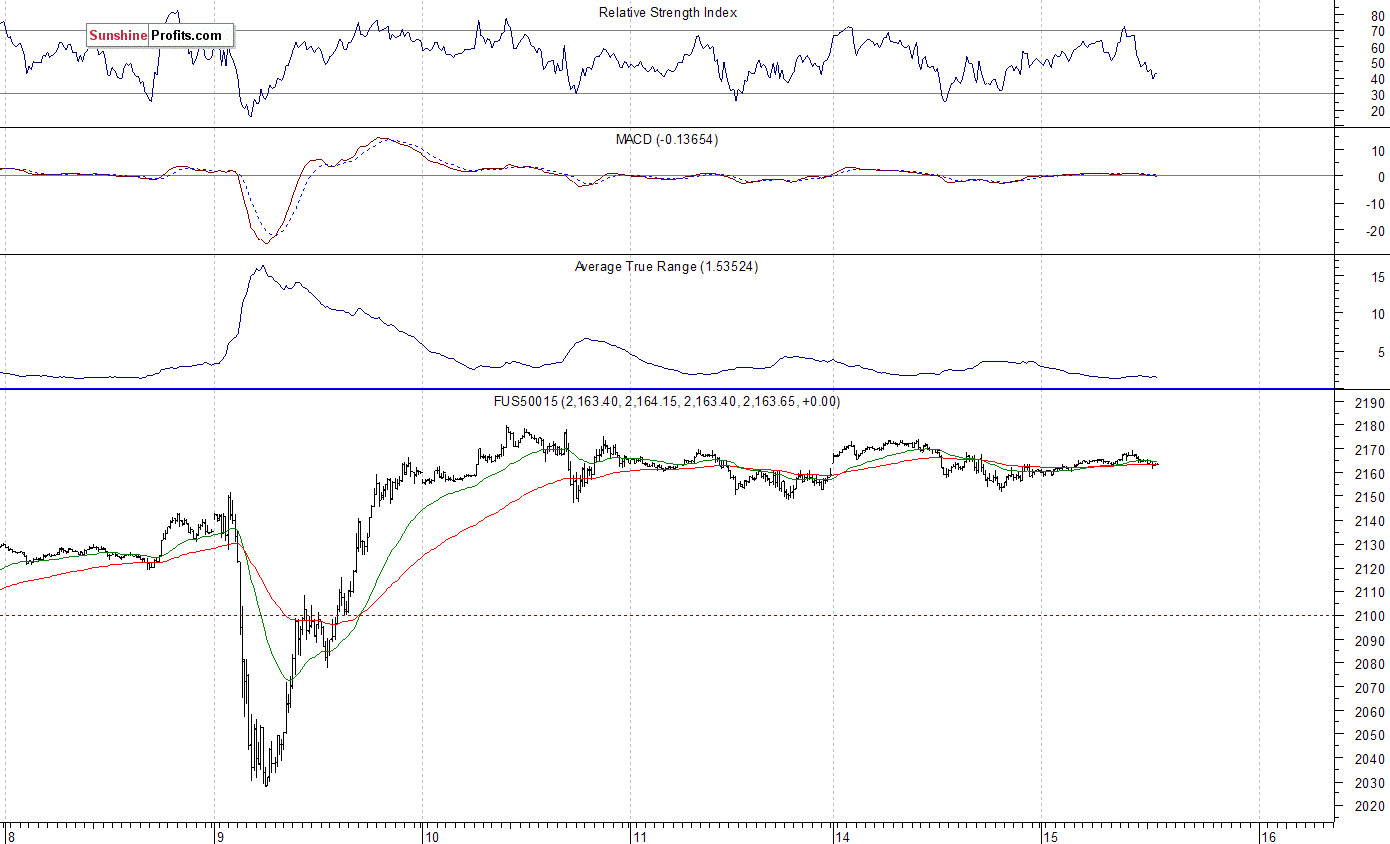
Expectations before the opening of today's trading session are slightly positive, with index futures currently up 0.2%. The European stock market indexes have gained 0.1-0.6% so far. Investors will now wait for some economic data announcements: Retail Sales, Empire Manufacturing at 8:30 a.m., Business Inventories at 10:00 a.m. The S&P 500 futures contract trades within an intraday consolidation, as it extends its short-term uncertainty. The nearest important support level is at around 2,150, marked by some recent local lows. The nearest important resistance level remains at 2,170-2,190, marked by medium-term highs:
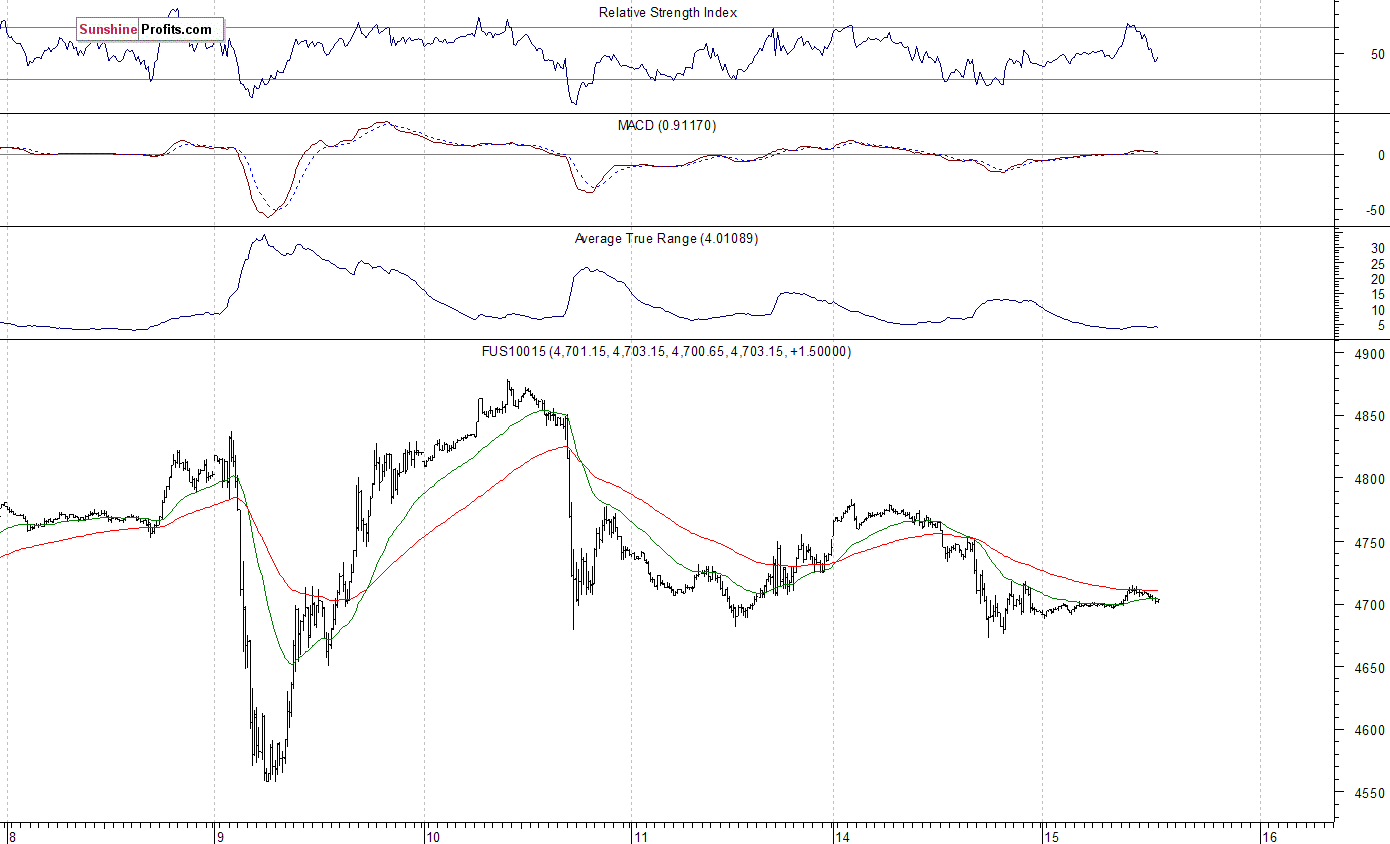
The technology Nasdaq 100 futures is relatively weaker, as it currently trades closer to its recent local low below the level of 4,700. The nearest important resistance level is at around 4,750-4,780, among others. On the other hand, support level is at 4,650-4,670, as the 15-minute chart shows:
Concluding, the broad stock market continues to fluctuate following last week's move up. There is no clear short-term direction. Is this some topping pattern or just flat correction before another leg up? We decided to close our profitable short position (opened on July 18 at 2,162 - S&P 500 index) at the opening of previous Friday's (November 4th) trading session - the average opening price of the S&P 500 index was at 2,085. Overall, we gained 77 index points on that over three-month-long speculative short trade following June - July rally off "Brexit" low. Currently, we prefer to be out of the market, avoiding low risk/reward ratio trades. We will let you know when we think it is safe to get back in the market.
Thank you.
Paul Rejczak
Stock Trading Strategist
Stock Trading Alerts

