
Briefly: In our opinion, speculative short positions are favored (with stop-loss at 2,210, and profit target at 2,050, S&P 500 index).
Our intraday outlook is bearish, and our short-term outlook is bearish. Our medium-term outlook is now neutral, following S&P 500 index breakout above last year's all-time high:
Intraday outlook (next 24 hours): bearish
Short-term outlook (next 1-2 weeks): bearish
Medium-term outlook (next 1-3 months): neutral
Long-term outlook (next year): neutral
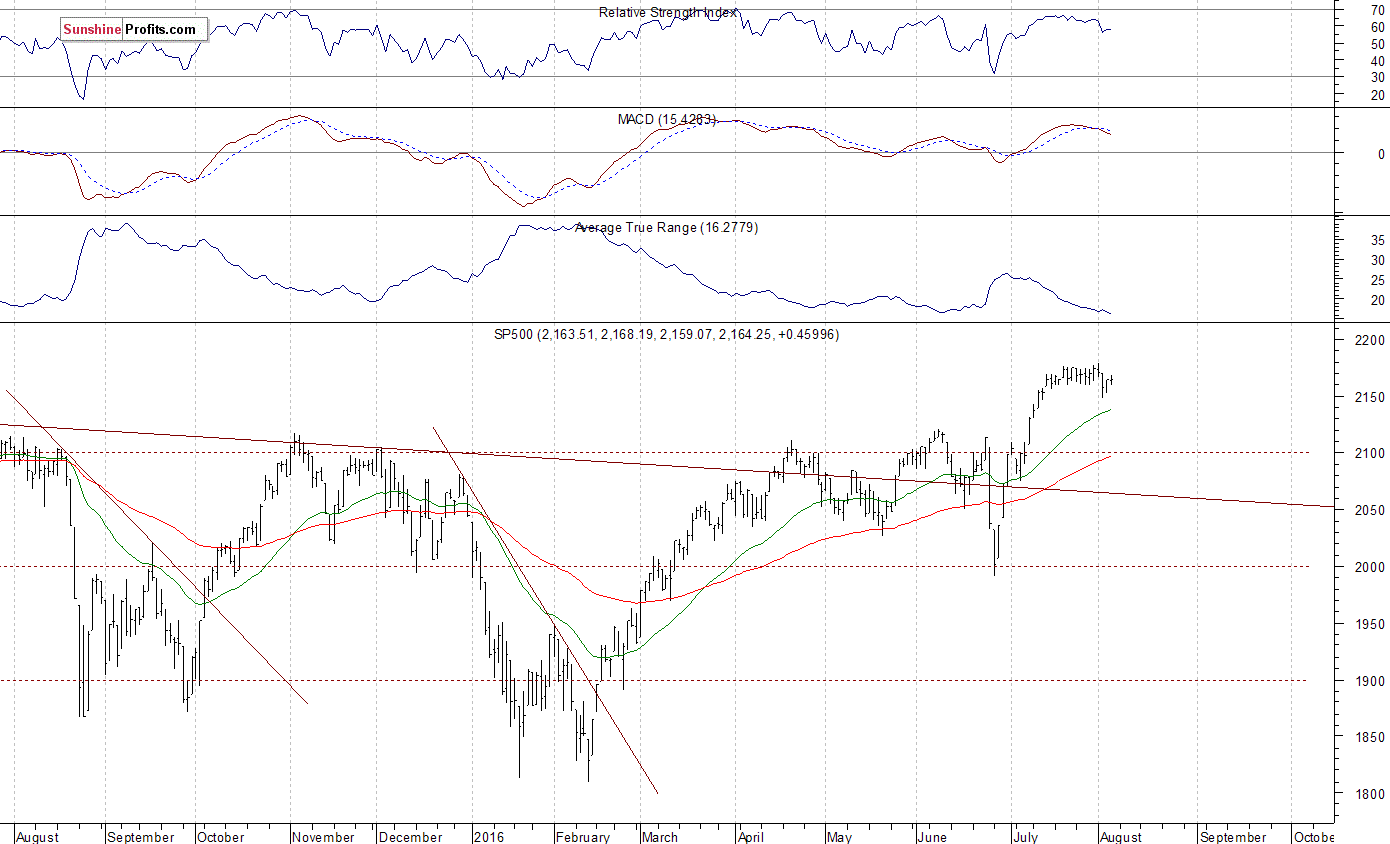
The U.S. stock market indexes were mixed between 0.0% and +0.2% on Thursday, as investors continued to hesitate ahead of today's monthly jobs data release, among others. The S&P 500 index remains relatively close to its Monday's record high of 2,178.29. The nearest important level of support is at around 2,150, marked by Tuesday's daily low. The next important support level is at 2,130-2,135, marked by previous level of resistance. On the other hand, resistance level is at 2,170-2,175, marked by all-time high. The next potential resistance level is at 2,200. For now, it looks like a relatively flat correction within medium-term uptrend. Will the market continue higher? Or is this some kind of a topping pattern before downward reversal?
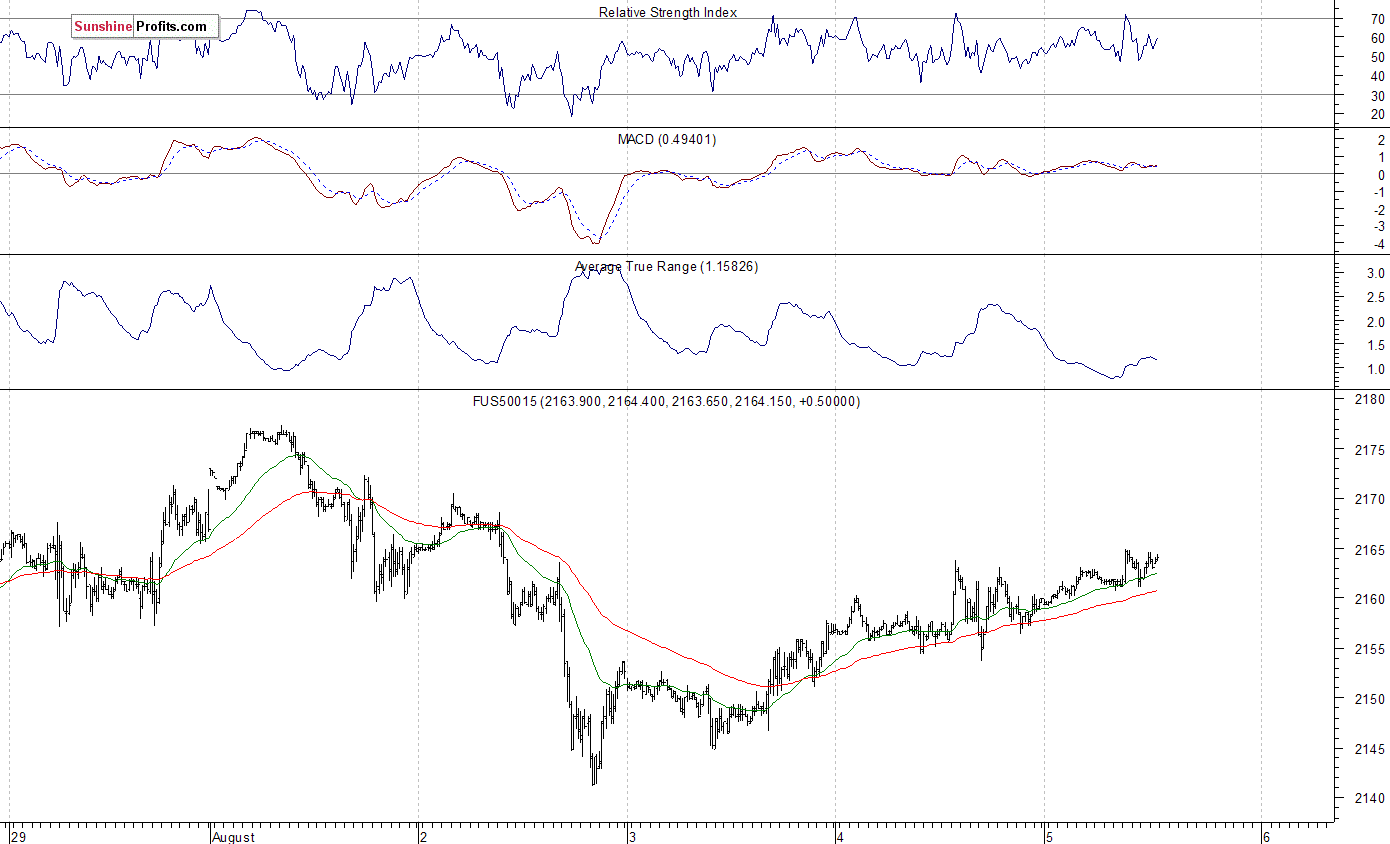
Expectations before the opening of today's trading session are positive, with index futures currently up 0.2%. The main European stock market indexes have gained 0.3-0.6% so far. Investors will now wait for some important economic data announcements: Nonfarm Payrolls, Unemployment Rate, Trade Balance at 8:30 a.m. The S&P 500 futures contract trades within an intraday uptrend, as it retraces some of its recent move down. The nearest important level of resistance is at 2,170-2,180, marked by short-term local highs. On the other hand, support level remains at 2,140-2,150, among others, as we can see on the 15-minute chart:
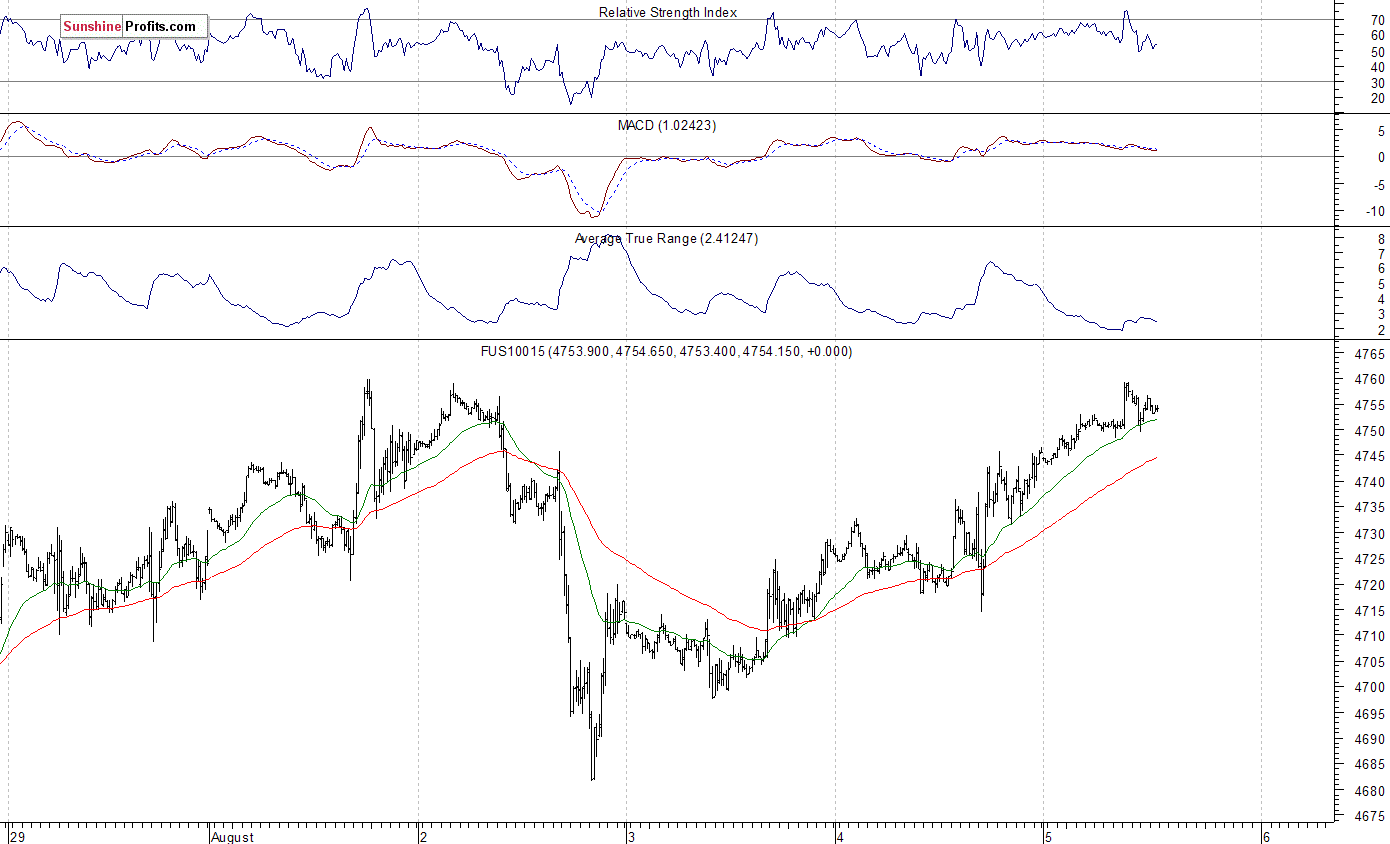
The technology Nasdaq 100 futures contract follows a similar path, as it currently extends its yesterday's move up. The nearest important level of resistance is at around 4,760, marked by record high. The next potential resistance level is at 4,800. On the other hand, support level is at 4,680-4,700, among others. Will the uptrend extend even further? We can see some short-term overbought conditions:
Concluding, the broad stock market extends its short-term consolidation following last month's rally. The S&P 500 index remains close to its record high of 2,178.29. We still can see technical overbought conditions accompanied by bearish technical divergences. Therefore, we continue to maintain our speculative short position (opened on July 18th at 2,162, S&P 500 index). Stop-loss level is at 2,210 and potential profit target is at 2,050 (S&P 500 index). You can trade S&P 500 index using futures contracts (S&P 500 futures contract - SP, E-mini S&P 500 futures contract - ES) or an ETF like the SPDR S&P 500 ETF - SPY. It is always important to set some exit price level in case some events cause the price to move in the unlikely direction. Having safety measures in place helps limit potential losses while letting the gains grow.
Due to a holiday break, beginning from next Monday until Friday, August 12, there will be no Stock Trading Alerts. However, there will be one more Stock Trading Alert this weekend, following today's trading session. We apologize for inconvenience.
As stated above, we continue to maintain our short position for the coming week. The stop-loss remains at 2,210, and potential profit target is at 2,050 (S&P 500 index).
Thank you.
Paul Rejczak
Stock Trading Strategist
Stock Trading Alerts

