
Briefly: In our opinion, no speculative positions are justified.
Our intraday outlook is neutral, and our short-term outlook is neutral. Our medium-term outlook remains bearish, as the S&P 500 index extends its lower highs, lower lows sequence. However, we decided to change our long-term outlook to neutral recently, following recent move down below medium-term lows:
Intraday outlook (next 24 hours): neutral
Short-term outlook (next 1-2 weeks): neutral
Medium-term outlook (next 1-3 months): bearish
Long-term outlook (next year): neutral
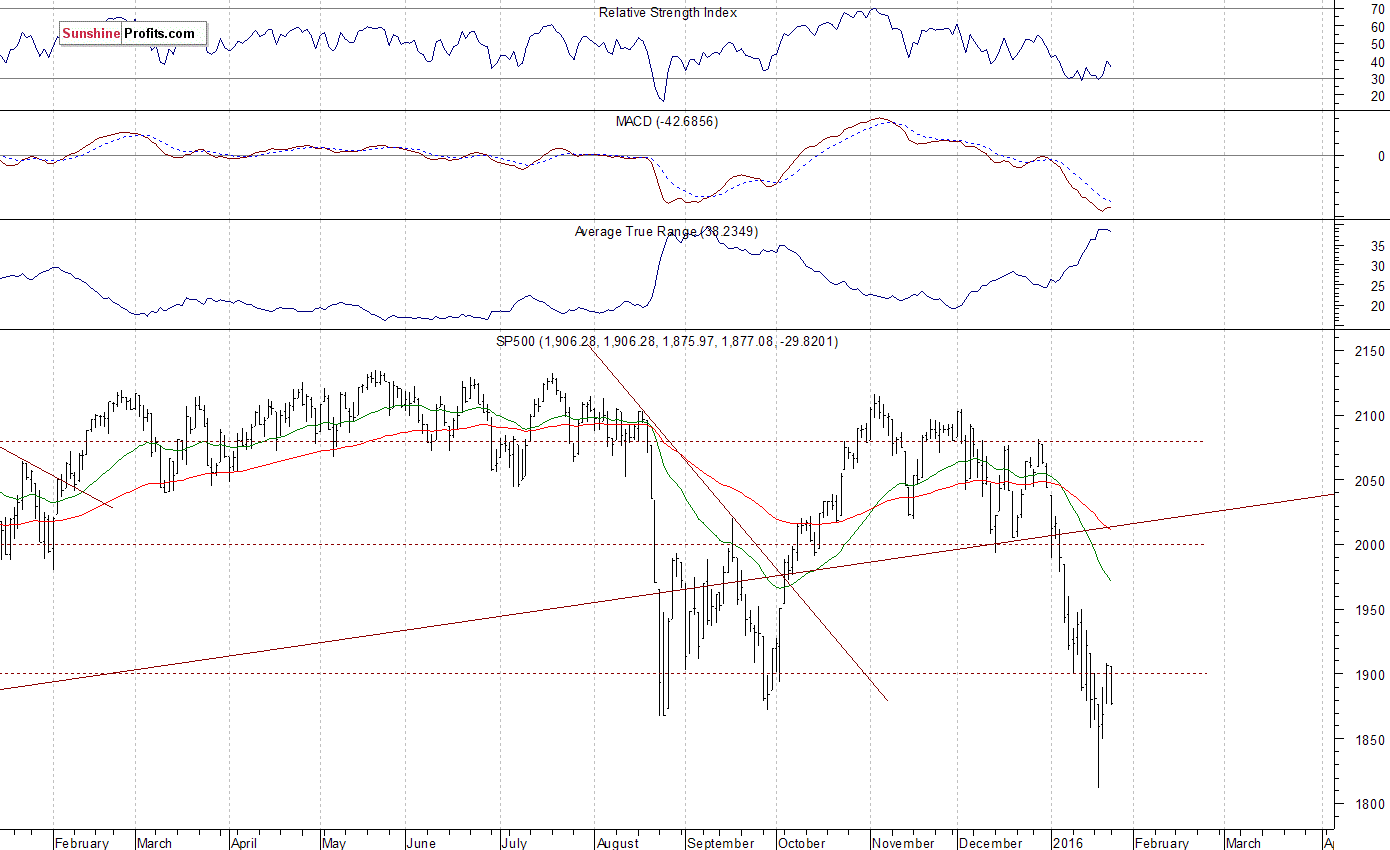
The main U.S. stock market indexes lost between 1.3% and 1.6%, retracing a part of their Friday's rebound, as investors reacted to oil prices retreat, Asian stock markets move down. The S&P 500 index got back below the level of 1,900. The nearest important level of resistance is at around 1,900-1,920, marked by recent local highs. On the other hand, support level remains at 1,850-1,880. We can see some relatively volatile fluctuations following first half of the month's sell-off. For now, it looks like a correction within a short-term downtrend. There have been no confirmed positive signals so far. However, the market may form some downtrend reversal pattern here:
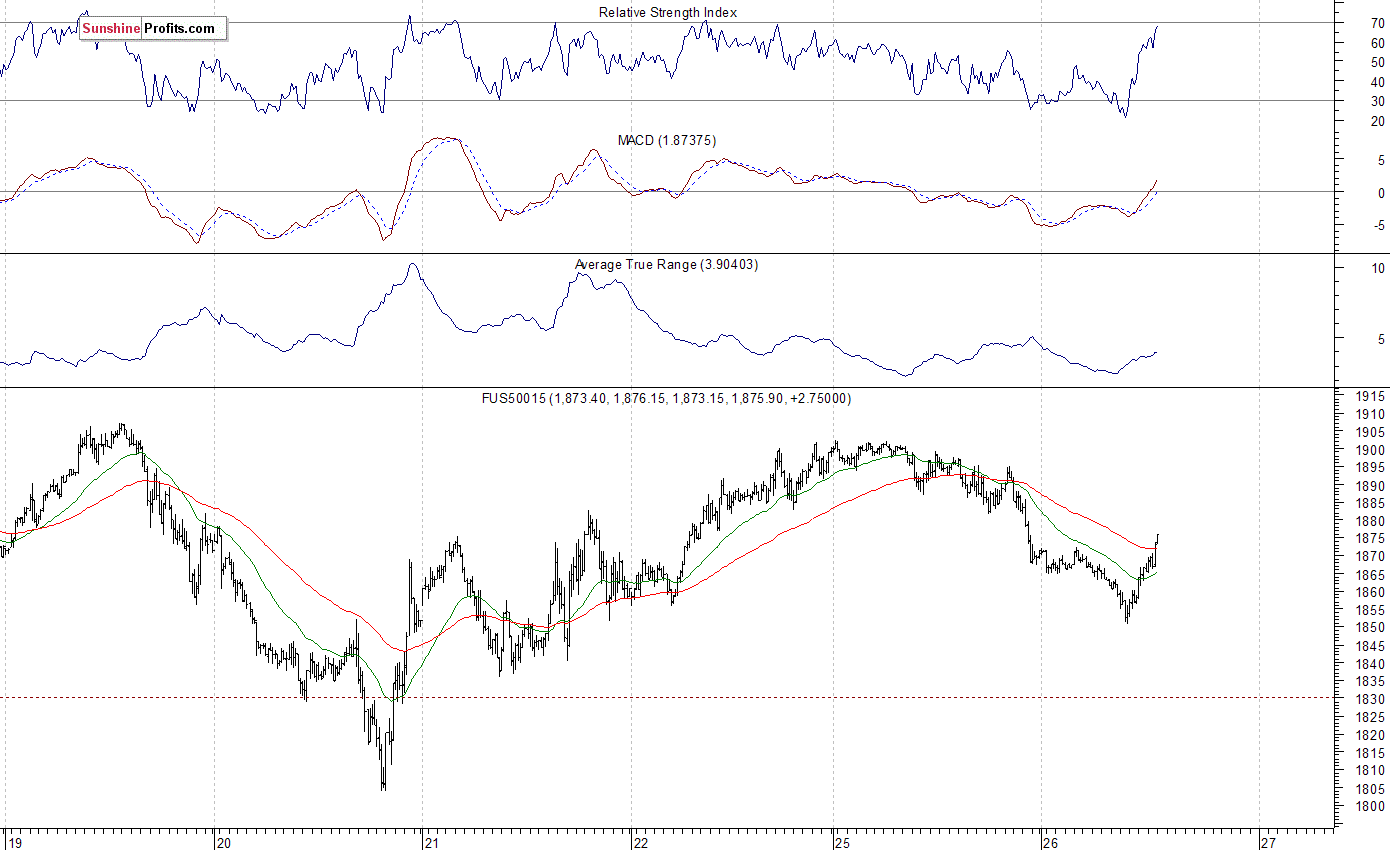
Expectations before the opening of today's trading session are slightly positive, with index futures currently up 0.1-0.2%. The main European stock market indexes have lost 0.1-0.5% so far. Investors will now wait for some economic data announcements: Case-Shiller 20-city Index, FHFA Housing Price Index at 9:00 a.m., Consumer Confidence at 10:00 a.m. Investors will also wait for series of quarterly corporate earnings releases, with Apple's report after the close of today's trading session. The S&P 500 futures contract trades within an intraday uptrend, as it bounces off support level of 1,850. The nearest important level of resistance is at around 1,880-1,900. For now, it looks like more short-term consolidation following previous sell-off. The market continues to trade along 1,850 level, as we can see on the 15-minute chart:
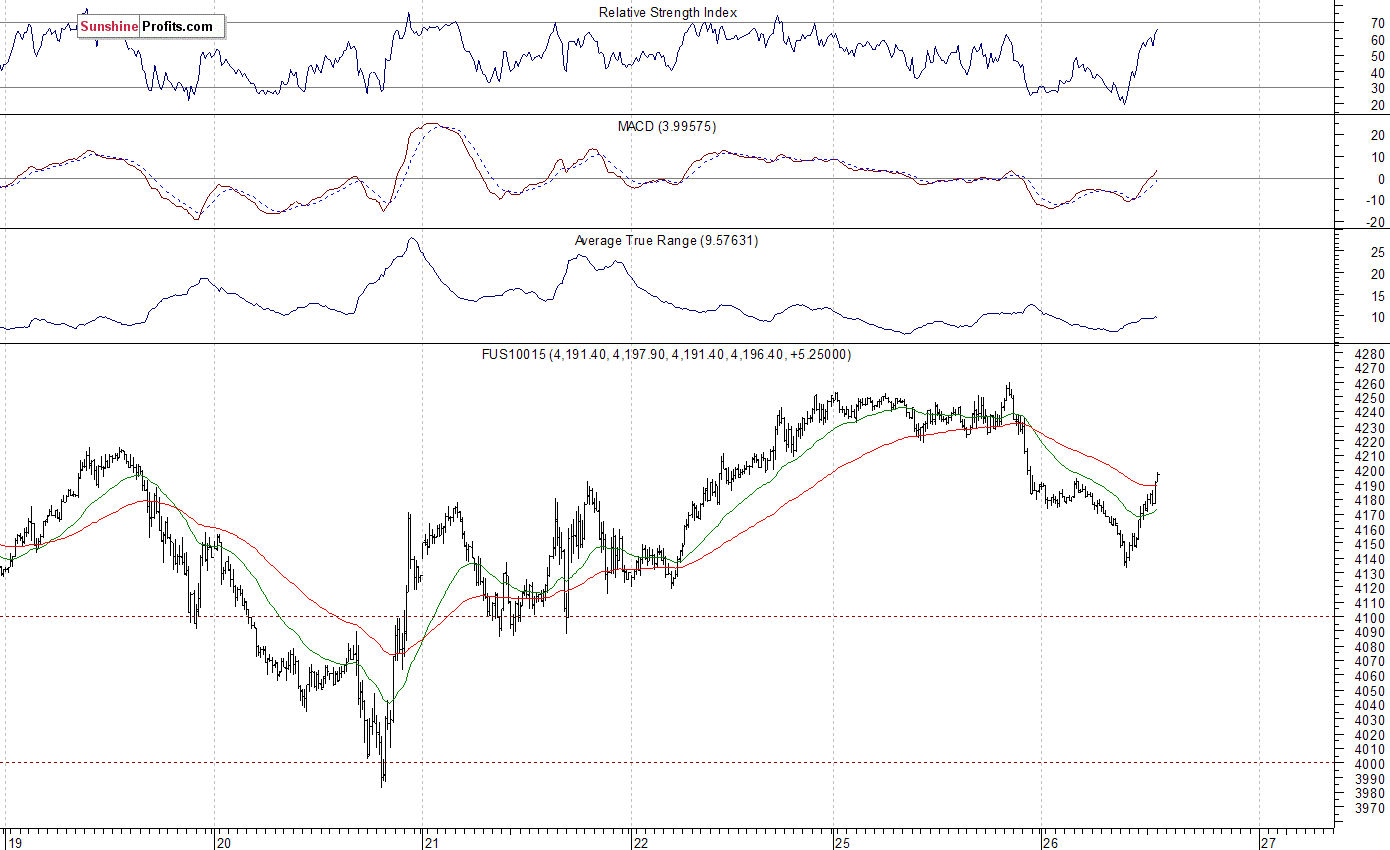
The technology Nasdaq 100 futures contract follows a similar path, as it currently trades slightly below the level of 4,200, after bouncing off support level at 4,100-4,150 earlier this morning. The nearest important level of resistance is at 4,200, and the next resistance level is at 4,250-4,270, marked by previous intraday local highs. For now, it looks like a consolidation following short-term downtrend. It is hard to say whether this is a bottoming pattern, or just consolidation / some sort of a flat correction before another leg down:
Concluding, the broad stock market extends its relatively volatile short-term consolidation, as investors react to oil prices, Asian stock markets. The index may trade along its last year's August - September local lows for some time, as they continue to act as a medium-term level of support. Our speculative long position (1,891.68, S&P 500 index) has been closed at the stop-loss level of 1,840 (S&P 500 index) on Wednesday, as the futures contract broke slightly below the level of 1,835 ahead of the cash market's opening (it currently trades around 5 points lower than the cash market). We prefer to be out of the market, avoiding low risk/reward ratio trades. We will let you know when we think it is safe to get back in the market.
Thank you.
Paul Rejczak
Stock Trading Strategist
Stock Trading Alerts

