
Briefly: In our opinion, speculative short positions are favored (with stop-loss at 2,180, and profit target at 2,020, S&P 500 index).
Our intraday outlook is bearish, and our short-term outlook is bearish. Our medium-term outlook is neutral, following S&P 500 index breakout above last year's all-time high:
Intraday outlook (next 24 hours): bearish
Short-term outlook (next 1-2 weeks): bearish
Medium-term outlook (next 1-3 months): neutral
Long-term outlook (next year): neutral
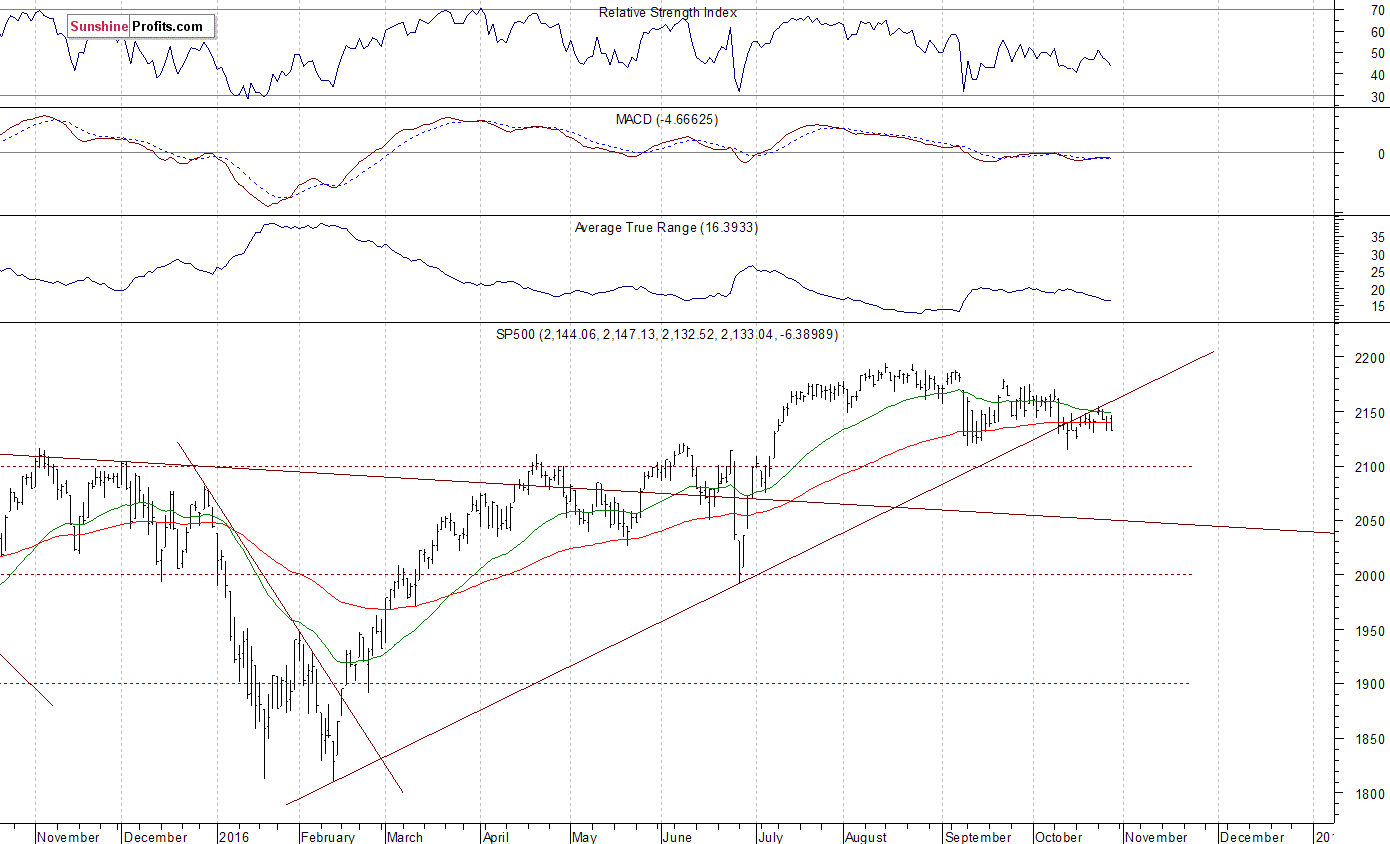
The main U.S. stock market indexes lost 0.2-0.5% on Thursday, extending their short-term consolidation, as investors reacted to economic data, quarterly corporate earnings releases. The S&P 500 index continues to trade slightly below its resistance level of 2,150. There has been no clear short-term direction so far. The next resistance level is at 2,170-2,180, marked by some previous local highs. On the other hand, level of support is at 2,130, and the next support level is at 2,115-2,120, marked by previous local lows. The market continues to trade along medium-term upward trend line, as the daily chart shows:
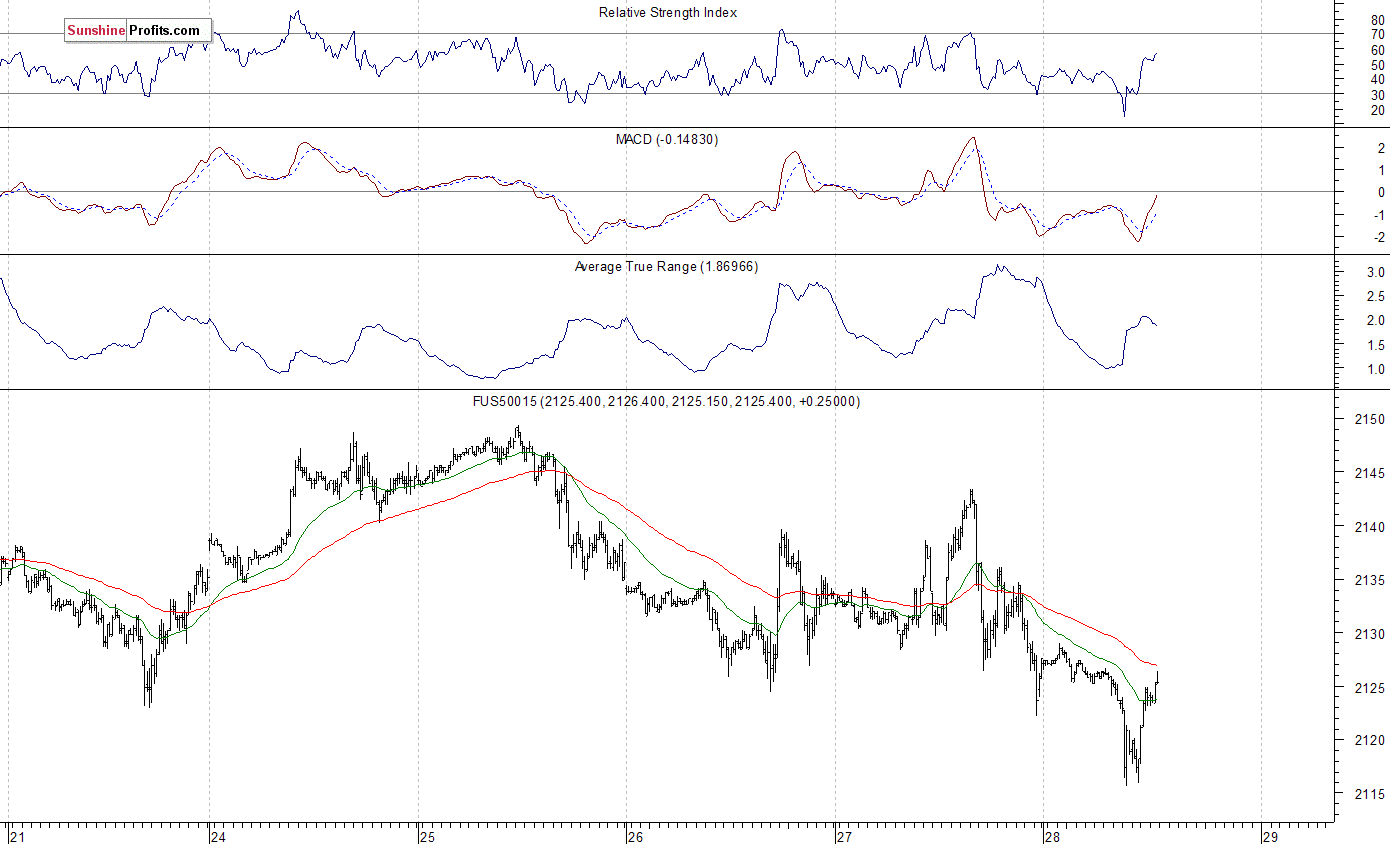
Expectations before the opening of today's trading session are negative, with index futures currently down 0.1-0.7%. The European stock market indexes have been mixed so far. Investors will now wait for some economic data announcements: GDP - Advance number at 8:30 a.m., Michigan sentiment at 10:00 a.m. The S&P 500 futures contract trades within an intraday consolidation, following a move down. The nearest important level of resistance remains at around 2,130-2,140, marked by recent fluctuations. On the other hand, support level is at 2,100-2,120. There have been no confirmed positive signals so far:
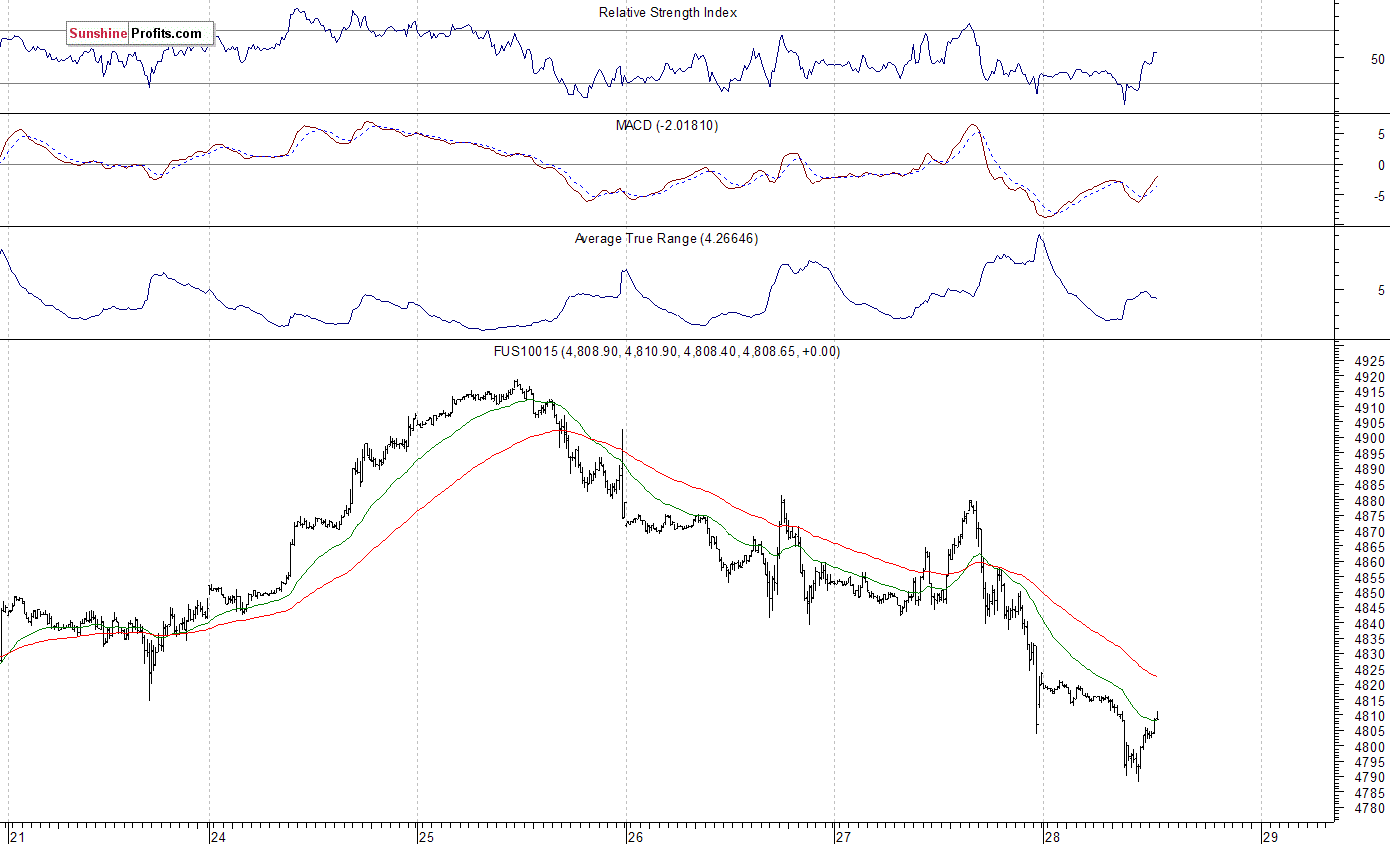
The technology Nasdaq 100 futures contract follows a similar path, as it trades within an intraday consolidation, following a move down below the level of 4,800. The nearest important resistance level is at 4,820-4,850, marked by previous support level. On the other hand, support level is at 4,780-4,800, as we can see on the 15-minute chart:
Concluding, the broad stock market extended its short-term consolidation on Thursday, as the S&P 500 index bounced off resistance level at around 2,150. For now, it looks like a flat correction within a downtrend. Therefore, we continue to maintain our speculative short position (opened on July 18th at 2,162, S&P 500 index). However, we decided to move our stop-loss level from 2,210 down to 2,180 (S&P 500 index). We also decided to move our potential profit target level from 2,050 down to 2,020 (S&P 500 index). You can trade S&P 500 index using futures contracts (S&P 500 futures contract - SP, E-mini S&P 500 futures contract - ES) or an ETF like the SPDR S&P 500 ETF - SPY. It is always important to set some exit price level in case some events cause the price to move in the unlikely direction. Having safety measures in place helps limit potential losses while letting the gains grow.
Thank you.
Paul Rejczak
Stock Trading Strategist
Stock Trading Alerts

