
Briefly: In our opinion, speculative short positions are favored (with stop-loss at 2,140, and profit target at 1,980, S&P 500 index)
Our intraday outlook is bearish, and our short-term outlook is bearish:
Intraday outlook (next 24 hours): bearish
Short-term outlook (next 1-2 weeks): bearish
Medium-term outlook (next 1-3 months): neutral
Long-term outlook (next year): bullish
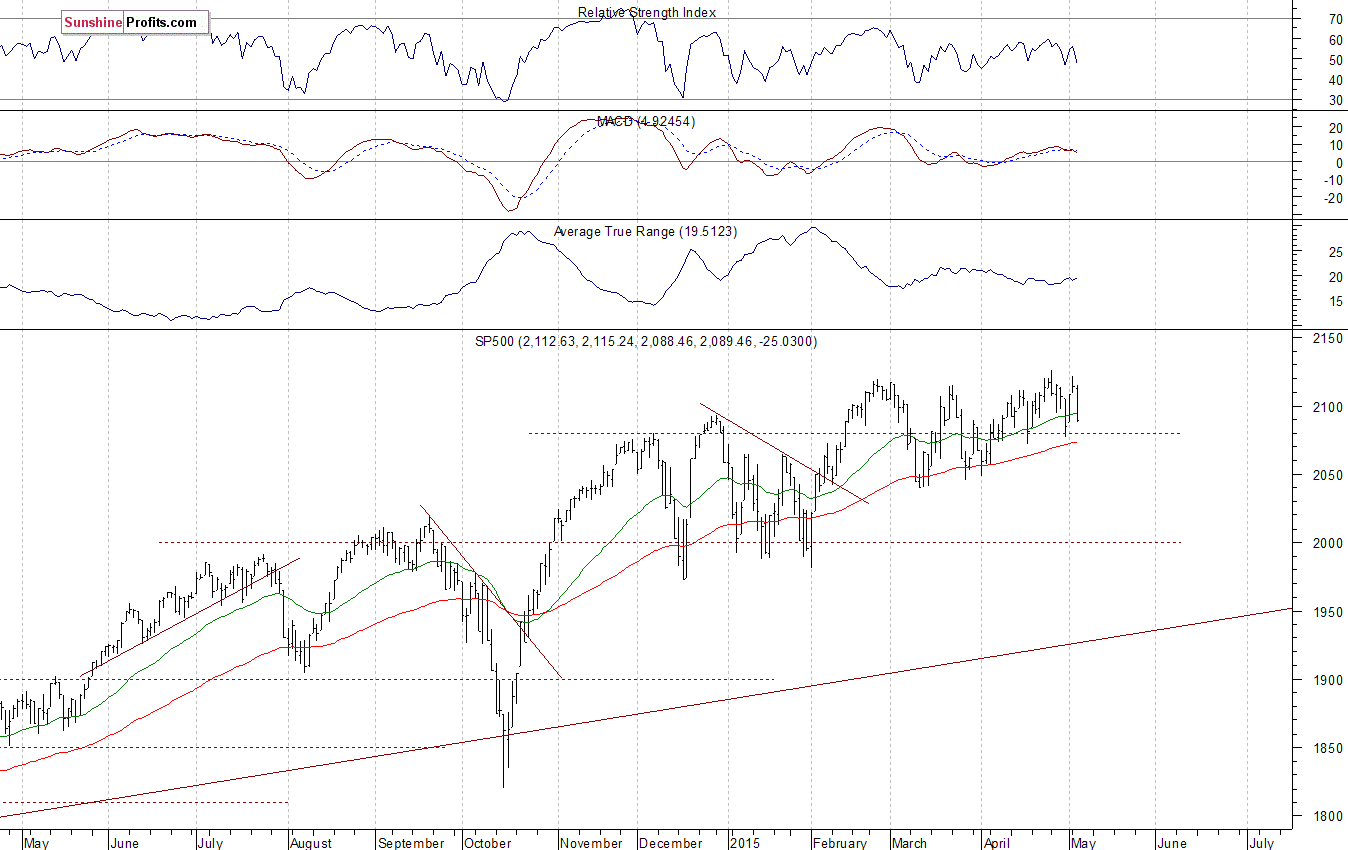
The main U.S. stock market indexes lost between 0.8% and 1.6% on Tuesday, retracing their recent move up, as investors took profits off the table. Our yesterday's bearish intraday outlook has proved accurate. The S&P 500 index bounced off resistance level at around 2,115-2,125, marked by April 27 all-time high of 2,125.92. On the other hand, level of support is at 2,070-2,080, marked by previous local lows. There have been no confirmed negative signals so far, however, we can see negative technical divergences:
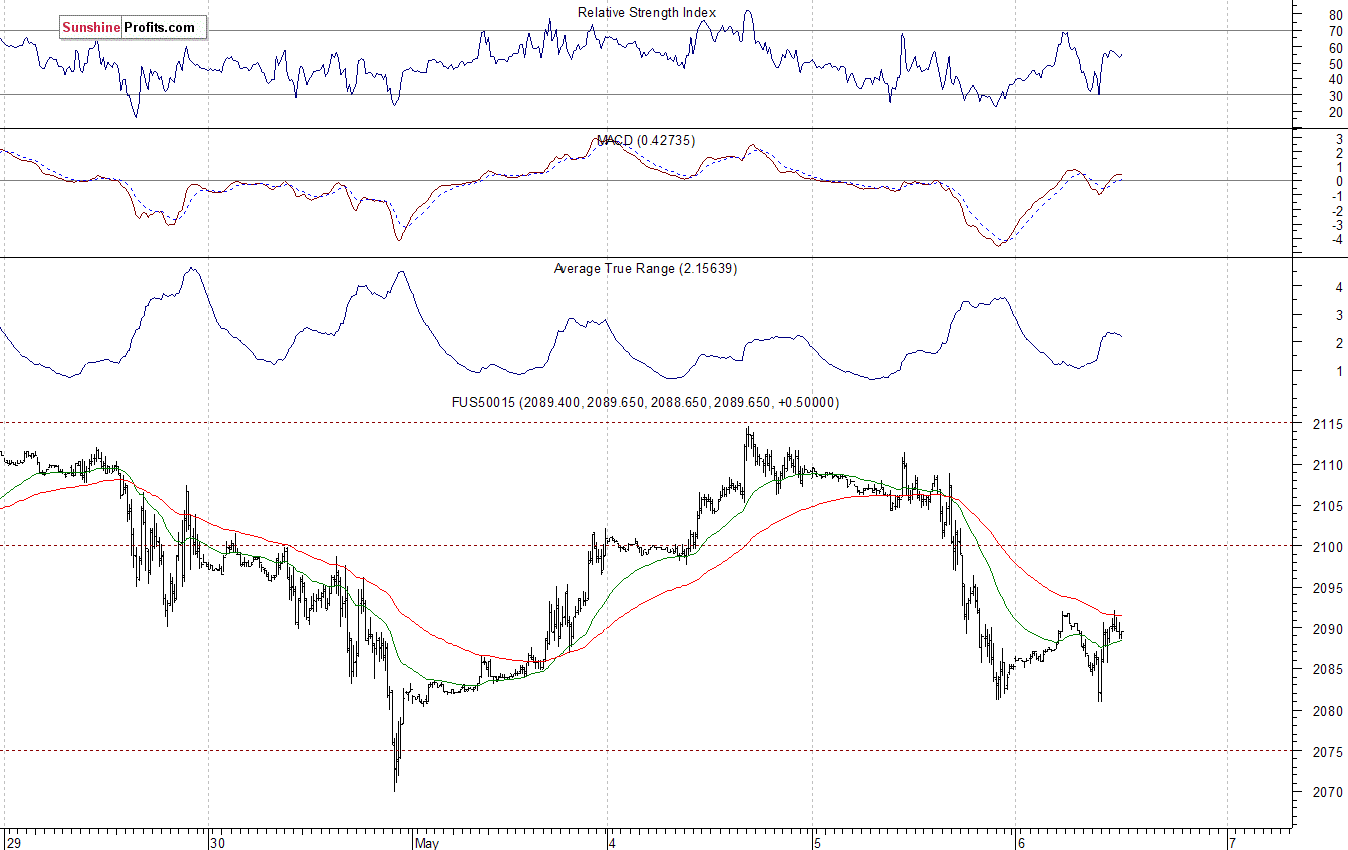
Expectations before the opening of today's trading session are slightly positive, with index futures currently up 0.1-0.3%. The European stock market indexes has gained 0.2-0.8% so far, following yesterday's decline. Investors will now wait for some economic data announcements: ADP Employment Change report at 8:15 a.m., Productivity, Union Labor Costs at 8:30 a.m., Crude Inventories at 10:30 a.m. The S&P 500 futures contract (CFD) trades within an intraday consolidation, as it fluctuates following yesterday's move down. The nearest important level of support remains at around 2,080, and resistance level is at 2,090-2,100, as the 15-minute chart shows:
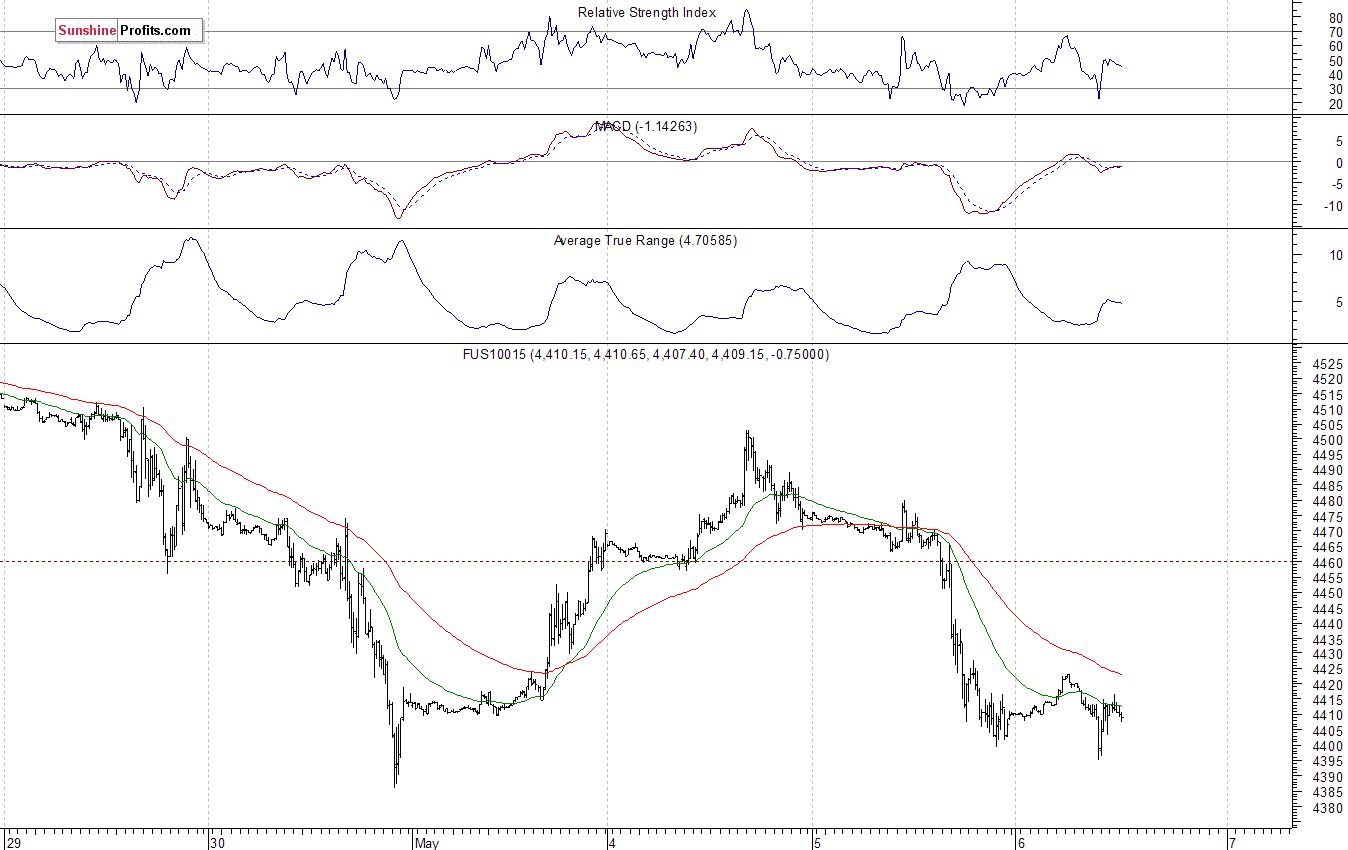
The technology Nasdaq 100 future contract (CFD) follows a similar path, as it fluctuates along the level of 4,400. The nearest important support level is at 4,390-4,440, and level of resistance is at 4,420-4,430, among others, as we can see on the 15-minute chart:
Concluding, the S&P 500 index retraced most of its recent advance yesterday as it got further away from its late April record high. We continue to maintain our speculative short position (2,098.27, S&P 500 index), as we expect a downward correction or an uptrend reversal. Stop-loss is at 2,140, and potential profit target is at 1,980. You can trade S&P 500 index using futures contracts (S&P 500 futures contract - SP, E-mini S&P 500 futures contract - ES) or an ETF like the SPDR S&P 500 ETF - SPY. It is always important to set some exit price level in case some events cause the price to move in the unlikely direction. Having safety measures in place helps limit potential losses while letting the gains grow.
Thank you.
Paul Rejczak
Stock Trading Strategist
Stock Trading Alerts

